
A Data-Driven Approach for Predictive Maintenance of Impellers in
Flexible Impeller Pumps Using Prophet
Efe Can Demir
a
and Sencer Sultano
˘
glu
b
Eliar Electronics Corp., Istanbul, Turkey
Keywords:
Predictive Maintenance, Flexible Impeller Pumps, Prophet Algorithm, Data-Driven Approach, Textile
Industry, Fabric Dyeing Efficiency, Machine Learning.
Abstract:
This article presents a data-driven approach aimed at improving the efficiency of fabric dyeing operations in
the textile industry. It specifically focuses on the predictive maintenance of flexible impeller pumps (FIP) and
the application of the Prophet algorithm. The study extensively explores the potential of machine learning
and data analytics to increase operational efficiency and enable early failure detection. By using the Facebook
Prophet model and time series data for early detection of wear and tear, it offers an approach to maintain pump
efficiency without installing new hardware, relying solely on data.
1 INTRODUCTION
The textile industry is a broad sector encompassing
complex physical and chemical processes involved
in the production stages of textile products. At the
heart of these processes is the fabric dyeing opera-
tion, where dyes and chemicals are applied to en-
sure color and durability. Fabric dyeing, as a batch
process, is conducted in fabric dyeing machines and
requires careful control of various variables such as
temperature, chemical ratio, dye quantity, conductiv-
ity, pH, and duration. This control is a critical ele-
ment determining the success of the dyeing process
and the correct chemical application is a crucial step
in achieving the fabric’s color absorption capacity and
desired color. (Sarkar et al., 2023).
In the textile dyeing process, liquid chemicals are
weighed in order of the steps of the dyeing process
and transferred to the chemical dosing tanks in real-
time without human intervention. This process, en-
hancing the repeatability of the dyeing process, is car-
ried out by mechatronic systems shown in Figure 1.
These systems robotically weigh chemicals according
to the given recipe and send them to the main tanks of
the fabric dyeing machines for dosing. For instance,
in a factory with 40 fabric dyeing machines, a liq-
uid chemical weighing system performs about 1000
weighings daily for approximately 30 different chem-
a
https://orcid.org/0009-0000-5251-9101
b
https://orcid.org/0009-0000-1521-8596
Figure 1: Liquid Chemical Weighing and Dispensing Sys-
tem.
icals.
In the liquid chemical weighing process, chem-
icals taken from chemical silos are weighed using
pumps and flow meters. The impeller in the FIP
(Flexible Impeller Pump), a significant rotating me-
chanical part containing blades in the middle between
two faces, is often referred to as a closed impeller.
Due to mechanical wear, the impeller requires care-
ful monitoring. This wear can lead to serious dam-
age in the pump and significantly reduce both the life
span of the pumps and overall efficiency. In weighing
and dispensing systems using FIP, the wear of the im-
peller over time is inevitable. Predicting this wear is
vital for ensuring accurate weighing within tolerance
limits and the uninterrupted continuation of produc-
tion. Recently, there has been an increase in the use
Demir, E. and Sultano
ˇ
glu, S.
A Data-Driven Approach for Predictive Maintenance of Impellers in Flexible Impeller Pumps Using Prophet.
DOI: 10.5220/0012710100003756
Paper published under CC license (CC BY-NC-ND 4.0)
In Proceedings of the 13th International Conference on Data Science, Technology and Applications (DATA 2024), pages 245-252
ISBN: 978-989-758-707-8; ISSN: 2184-285X
Proceedings Copyright © 2024 by SCITEPRESS – Science and Technology Publications, Lda.
245

of machine learning-based methods for anomaly and
damage detection in textile dyeing processes (G
¨
org
¨
ul
et al., 2023), (Wang and Li, 2022). Studies related
to the detection of impeller wear in FIP have been
conducted experimentally or using additional sensors
(Qu et al., 2009), (Daraz et al., 2019). Our proposed
approach focuses on effectively solving the impeller
wear issue in FIP without additional hardware, us-
ing a data-driven approach and the Facebook Prophet
method (Taylor and Letham, 2017). The necessary
methodology for this approach has been determined
and its effectiveness has been demonstrated through
implementation. This study addresses the wear is-
sue of FIP not merely as the deterioration of a ma-
chine part but also as a strategic matter in terms of the
efficiency and sustainability of the entire production
chain.
The rest of the paper is organized as follows. In
Section 2, related works on predictive maintenance of
pumps are given Section 3 defines the problem in de-
tail. In Section 4, the proposed methodology is pre-
sented. Section 5 gives details of application in the
pilot textile factory. Finally, concluding remarks are
provided in Section 6.
2 RELATED WORKS
Recent studies in the literature mainly focus on pre-
dictive maintenance and performance prediction of
FIP , with emphasis on various approaches including
artificial intelligence models and real-time data anal-
ysis, especially in the textile industry. This area of
research integrates various approaches, including ad-
vanced computational models and real-time data anal-
ysis, to improve the operational efficiency and relia-
bility of FIP in industrial environments.
(Demirkiran et al., 2022) conducted a study on the
application of the Prophet method for time series fore-
casting in AI models and the real-time data analysis
of industrial equipment. This research highlights the
effective utilization of the Prophet method with opti-
mized parameters.
(Chhabria et al., 2022) focused on the develop-
ment of a system architecture for the early detec-
tion of failures in industrial water pumps using ma-
chine learning techniques. Utilizing the Random For-
est method, this approach enables the early detection
of potential failures.
(Emir
ˇ
Zuni
´
c, 2020) presents a retail sales fore-
casting framework using Prophet algorithm, focusing
on real-world data from a major retail company. It
aims to enhance inventory and production planning
through accurate forecasts and product classification.
(Khoie et al., 2015) developed a novel magnetic
sensor to measure wear in centrifugal pumps. This
sensor provides real-time measurements of wear, cru-
cial for maintaining the efficiency of pumps and min-
imizing downtime.
(Sugiyama et al., 2009) examined the prediction
of wear depth distribution caused by slurry in alu-
minum pump impellers. The study successfully pre-
dicts wear distribution, showcasing its usefulness in
maintenance and material selection.
(Almazrouei et al., 2023) conducted a comprehen-
sive review of AI models used in the predictive main-
tenance of water injection pumps. This review un-
derscores the effectiveness and challenges of various
AI techniques including machine learning and deep
learning.
(Sanayha and Vateekul, 2017) developed a two-
stage model for fault detection in circulating water
pumps. The model focuses on forecasting sensor
trends using the ARIMA method and classifying fail-
ure modes based on these predictions.
(Chen et al., 2022) designed an IoT system archi-
tecture with smart sensors for monitoring and predic-
tive maintenance of centrifugal pumps. This design
emphasizes the effectiveness of both wired and wire-
less sensors in real-time fault detection and diagnosis.
This research area integrates varied approaches,
including advanced computational models and real-
time data analysis, to enhance the operational effi-
ciency and reliability of FIP in industrial environ-
ments.
3 PROBLEM DEFINITION
A FIP shown in Figure 2 is a pump style featuring
a rubber impeller that is circular in shape, equipped
with numerous pliable rubber vanes. This impeller is
set within a housing or casing (Hooton, 2019).
The liquid chemical weighing and dispensing sys-
tem shown in in Figure 3, significant wear and tear oc-
cur over time on the impeller within the FIP, as shown
in Figure 4. These harsh working conditions can lead
to incorrect amounts of liquid chemical weighing or
Figure 2: Flexible impeller pump and impeller.
DATA 2024 - 13th International Conference on Data Science, Technology and Applications
246
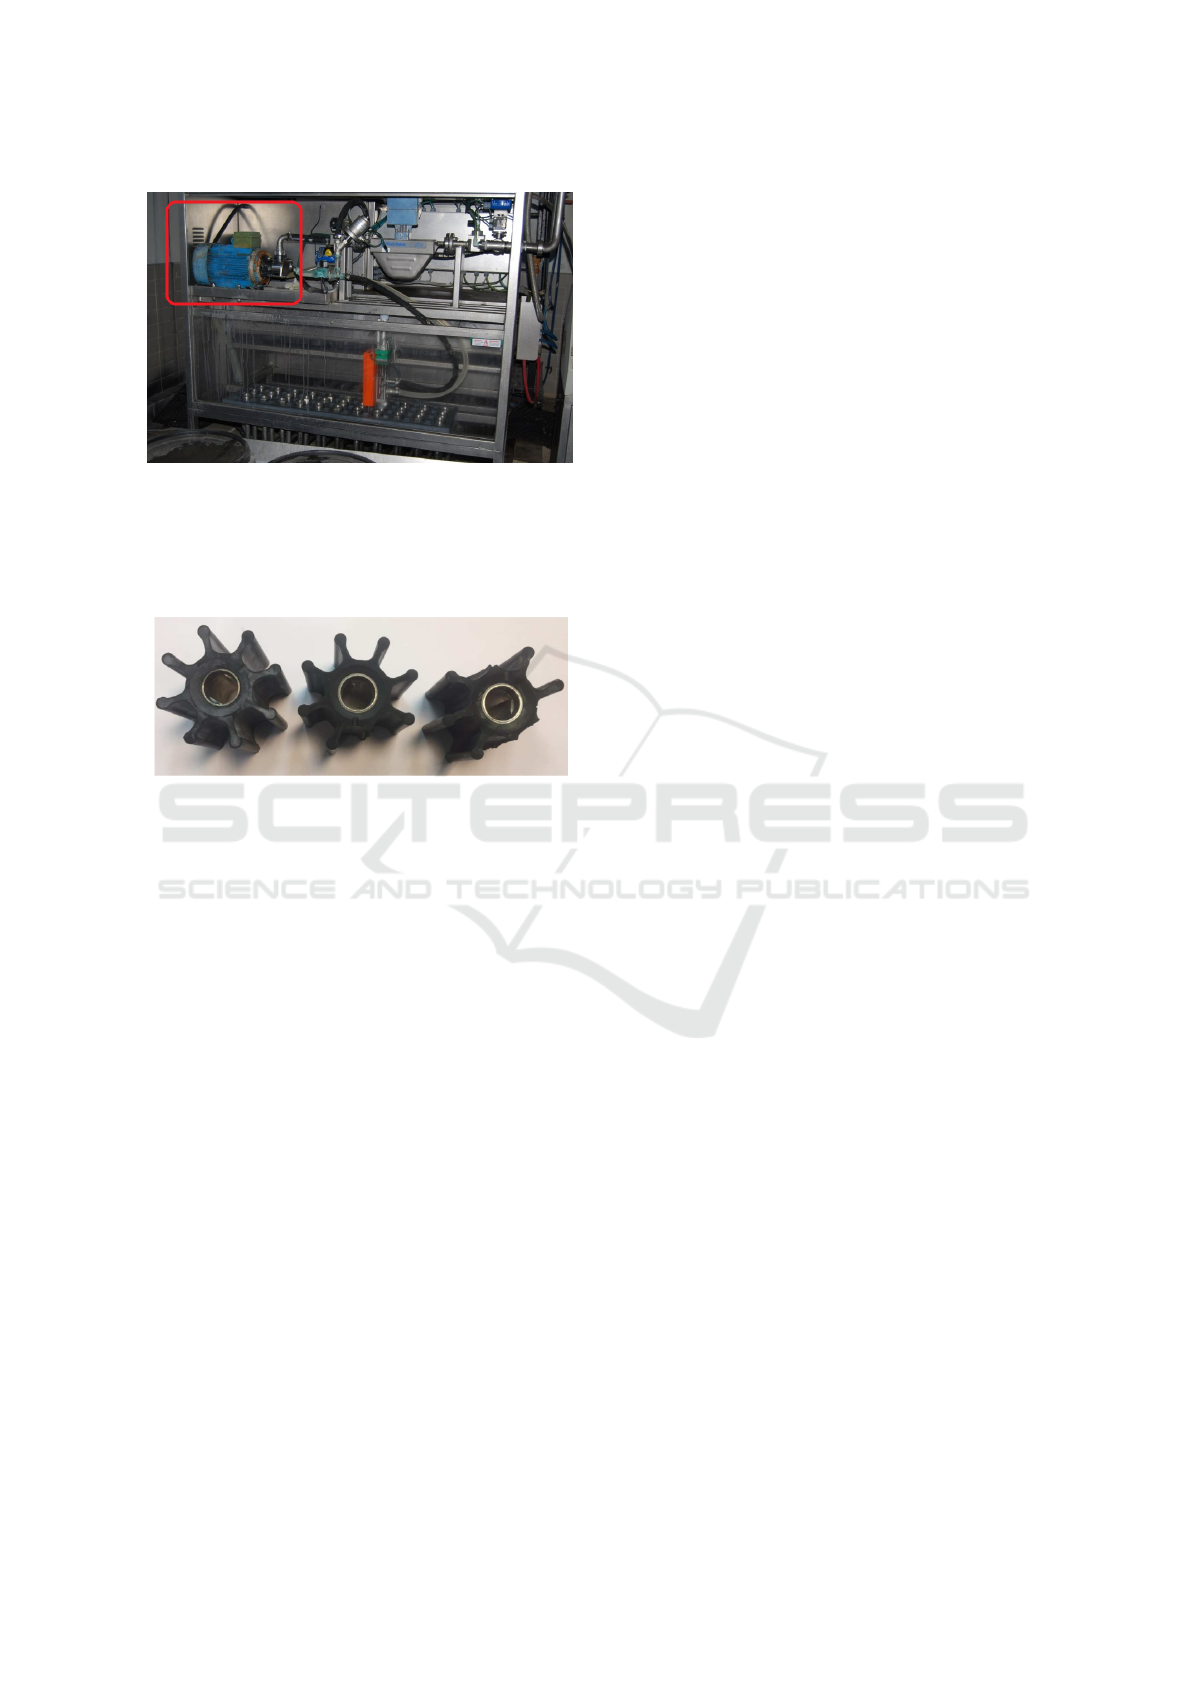
Figure 3: Pump position of liquid chemical weighting and
dispensing system.
prolonged weighing durations. This may result in un-
desirable dyeing quality and can disrupt the dyeing
process if the pump fails.
Figure 4: Impeller wear out.
FIP, particularly in precise operations like fabric
dyeing, are critical for the accurate and timely trans-
mission of fluids. As one of the most crucial com-
ponents of these pumps, the impeller, being in con-
stant motion, wears down depending on the physical
and operational stress, the chemicals weighed, and the
number of weightings. This wear jeopardizes the effi-
ciency of the pumps over time and thus the integrity of
the entire production process. Detailed observations
and process analyses have revealed that these pumps
typically show significant signs of wear after a usage
period of 4 to 6 months. During this time, the wear
of the impeller leads to a noticeable decrease in the
amount of fluid pumped per unit time.This reduction
is observed to adversely affect not just the efficiency
of the operation.
However, the real magnitude of the problem man-
ifests in the quality of the final product. Due to the
wear of this critical component, the pump becomes
dysfunctional, which may lead to the machine operat-
ing at reduced efficiency for weeks, thereby causing
serious disruptions in production processes. These
disruptions lead not only to financial losses but also
to negative impacts on production continuity and cus-
tomer satisfaction.
4 PROPOSED METHODOLOGY
4.1 Data Acquisition and Cleaning
In factories, impeller pumps used are prone to wear
and tear and fragmentation depending on the intensity
and conditions of use, leading to the halt of chemical
weighing operations in the factory and disruptions in
production.This study aims to detect the wear condi-
tion of the pump early by using data collected from
the devices, and to provide a solution by informing
the operation before a problem occurs. The analysis
of the data obtained from the devices plays a critical
role in determining the wear condition of the pump
over time and making predictions for the pump’s per-
formance based on the amount of wear. This method-
ology aims to reduce the need for regular maintenance
in businesses and prevent disruptions in production
processes. The flowchart of the methodology is given
in Figure 5.
Our database reflects daily data records show-
ing the operational performance of the pump sys-
tem. The data are obtained through daily ETL (Ex-
tract, Transform, Load) data collection cycles. Our
ETL module deployed on a cloud server and connect
the databases of dispensing systems through VPN.
These records include process values such as Weight-
ing time, Weighted amount (g), Weighting duration
(s) and g/s. Our sample dataset can be examined in
Table 1. Below are the descriptions of the dataset
columns:
• Name / Type: Weighting time / Timestamp
Description: The operation start time with pre-
cise timestamps.
• Name / Type: Weighted amount (g) / Float
Description: The amount of substance used.
• Name / Type: Weighting duration (s) / Integer
Description: The total operation duration in sec-
onds.
• Name / Type: g/s / Float
Description: The rate of substance pumped per
second.
This dataset is not limited only to the compilation of
process data but also includes these data in a simpli-
fied and transformed form.
During the data collection process, the accuracy
of each weighing in liquid chemical weighing and
distribution systems is of critical importance. Out-
lier detection identifies data points that deviate from
the expected or indicate possible errors. For exam-
ple, interruptions in the weighing process, deviations
from expected values, or sensor errors, as well as
A Data-Driven Approach for Predictive Maintenance of Impellers in Flexible Impeller Pumps Using Prophet
247
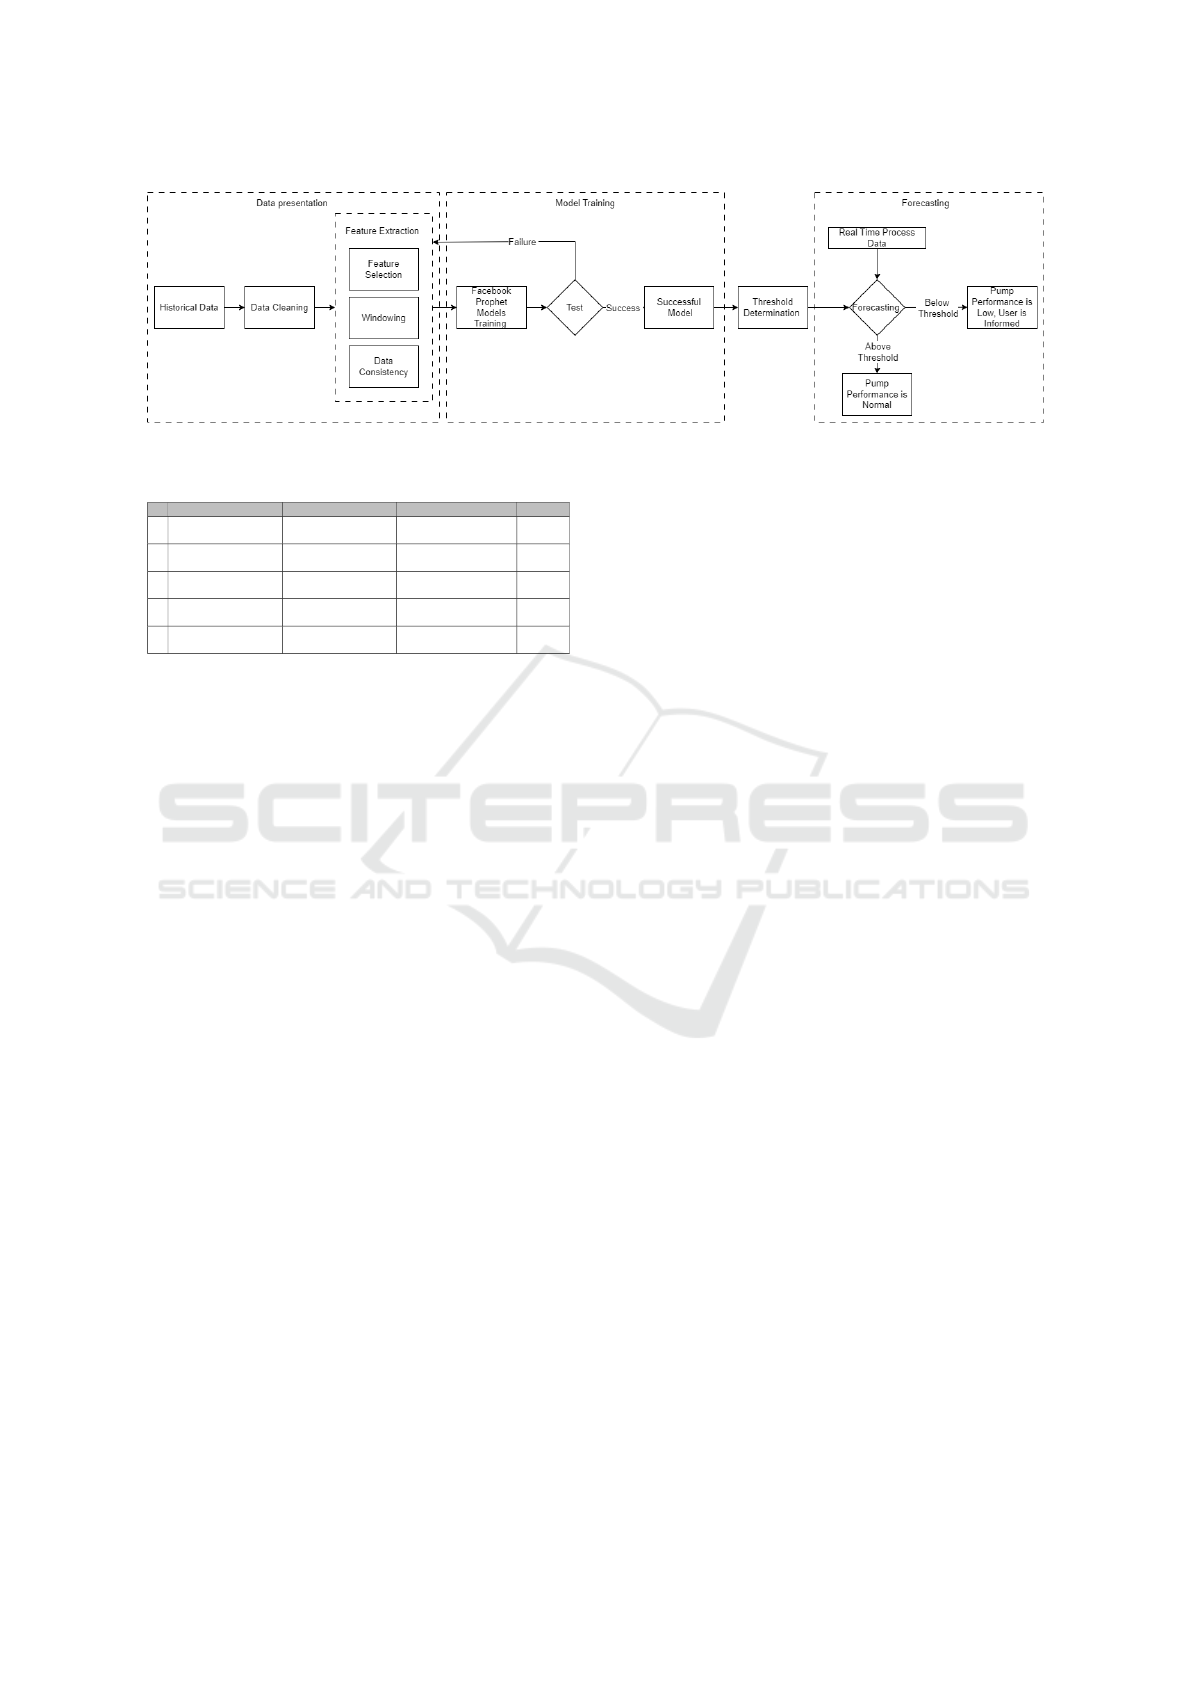
Figure 5: Flowchart of the methodology.
Table 1: Sample dataset.
# Weighting time Weighted amount (g) Weighting duration (s) g/s
1
2024-01-23
15:49:43.160
168.166 59 2.850
2
2024-01-23
15:48:38.152
497.0 5 99.4
3
2024-01-23
15:48:21.447
239.087 50 4.781
4
2024-01-23
15:47:41.000
4790.0 27 177.407
5
2024-01-23
15:47:40.263
144.0 3 48.0
certain inconsistencies in daily weighing speeds, can
be observed. These inconsistencies may stem from
the operational status of the business; for instance,
days when the business is closed due to bans, reduced
working hours, or holidays, can affect the integrity
of our dataset. Such data are carefully filtered out
from the dataset. In the data cleaning phase, canceled
weightings, failed operations, and other anomalies
are identified using statistical filters and algorithms.
These data are labeled and stored in the database, so
that when analysis queries are performed, work is car-
ried out on a meaningful and clean dataset.
One of the biggest challenges encountered in the
data analysis process is the accurate interpretation of
the unique characteristics displayed in the weighing
operations of each chemical. Especially frequently
used chemicals like hydrogen peroxide, liquid caus-
tic, and acetic acid, when examined individually, can
give misleading results due to the complexity of the
weighing process. This is because the weighing
speed, amount of weight, type of chemical, environ-
mental factors (such as seasonal temperature, humid-
ity), and machine parameters depend on numerous
variables.
Therefore, to analyze the daily operations of the
business and enhance efficiency, it is need to exam-
ine the average values of all chemicals and weighings.
This approach aids in understanding the relationship
between the quantities of chemicals used daily and
the overall performance of the business. For instance,
it has been observed that there is a significant corre-
lation between the daily usage amounts of frequently
used chemicals (’SERAZ ZYME CKXE’, ’LAUCOL
SRD CONC’, ’EXAPON BHL-PLUS’) and the over-
all performance of the business. These correlations
have been determined to be 89.87%, 84.77%, and
84.54% respectively, which has proven to be a mean-
ingful method of measuring daily performance and
consistency.
Figure 6 provides a detailed representation of the
chemical weighings performed by the liquid chem-
ical weighing and distribution system. Our graph
shows the average flow rate in grams per second of
different chemicals based on date. The axes represent
time (Date) and flow rate (Average Grams/Second),
with different chemicals distinguished by color codes.
These data are collected for the purpose of continuous
monitoring and improvement of our devices’ perfor-
mance.
In the outlier detection process, the quantile
method, a statistical approach, has been used to iden-
tify outliers in the dataset. The primary purpose of
this method is to determine values representing a cer-
tain percentage of the dataset. In this context, the
0.1 quantile value has been chosen to detect outliers.
This choice implies that 10% of the observations in
the dataset will be considered outliers. Determining
this ratio is critical to measure and calibrate how well
the algorithm can detect outliers.
To express this in formulaic terms, let Q(p) be a
quantile function, then for p=0.1 the value Q(0,1) rep-
resents the top and bottom 10% of the observations in
the data set, and all other than this value observations
are considered anomalies. This outlier detection has
been fine-tuned to discern real issues and significant
patterns within the dataset.
4.2 Data Analysis and Machine
Learning
After outlier detection and cleaning processes on the
dataset, the data were prepared for machine learning
and advanced analysis techniques. At this stage, var-
ious algorithms for time series analysis were exam-
ined and tested. The Prophet algorithm developed
DATA 2024 - 13th International Conference on Data Science, Technology and Applications
248
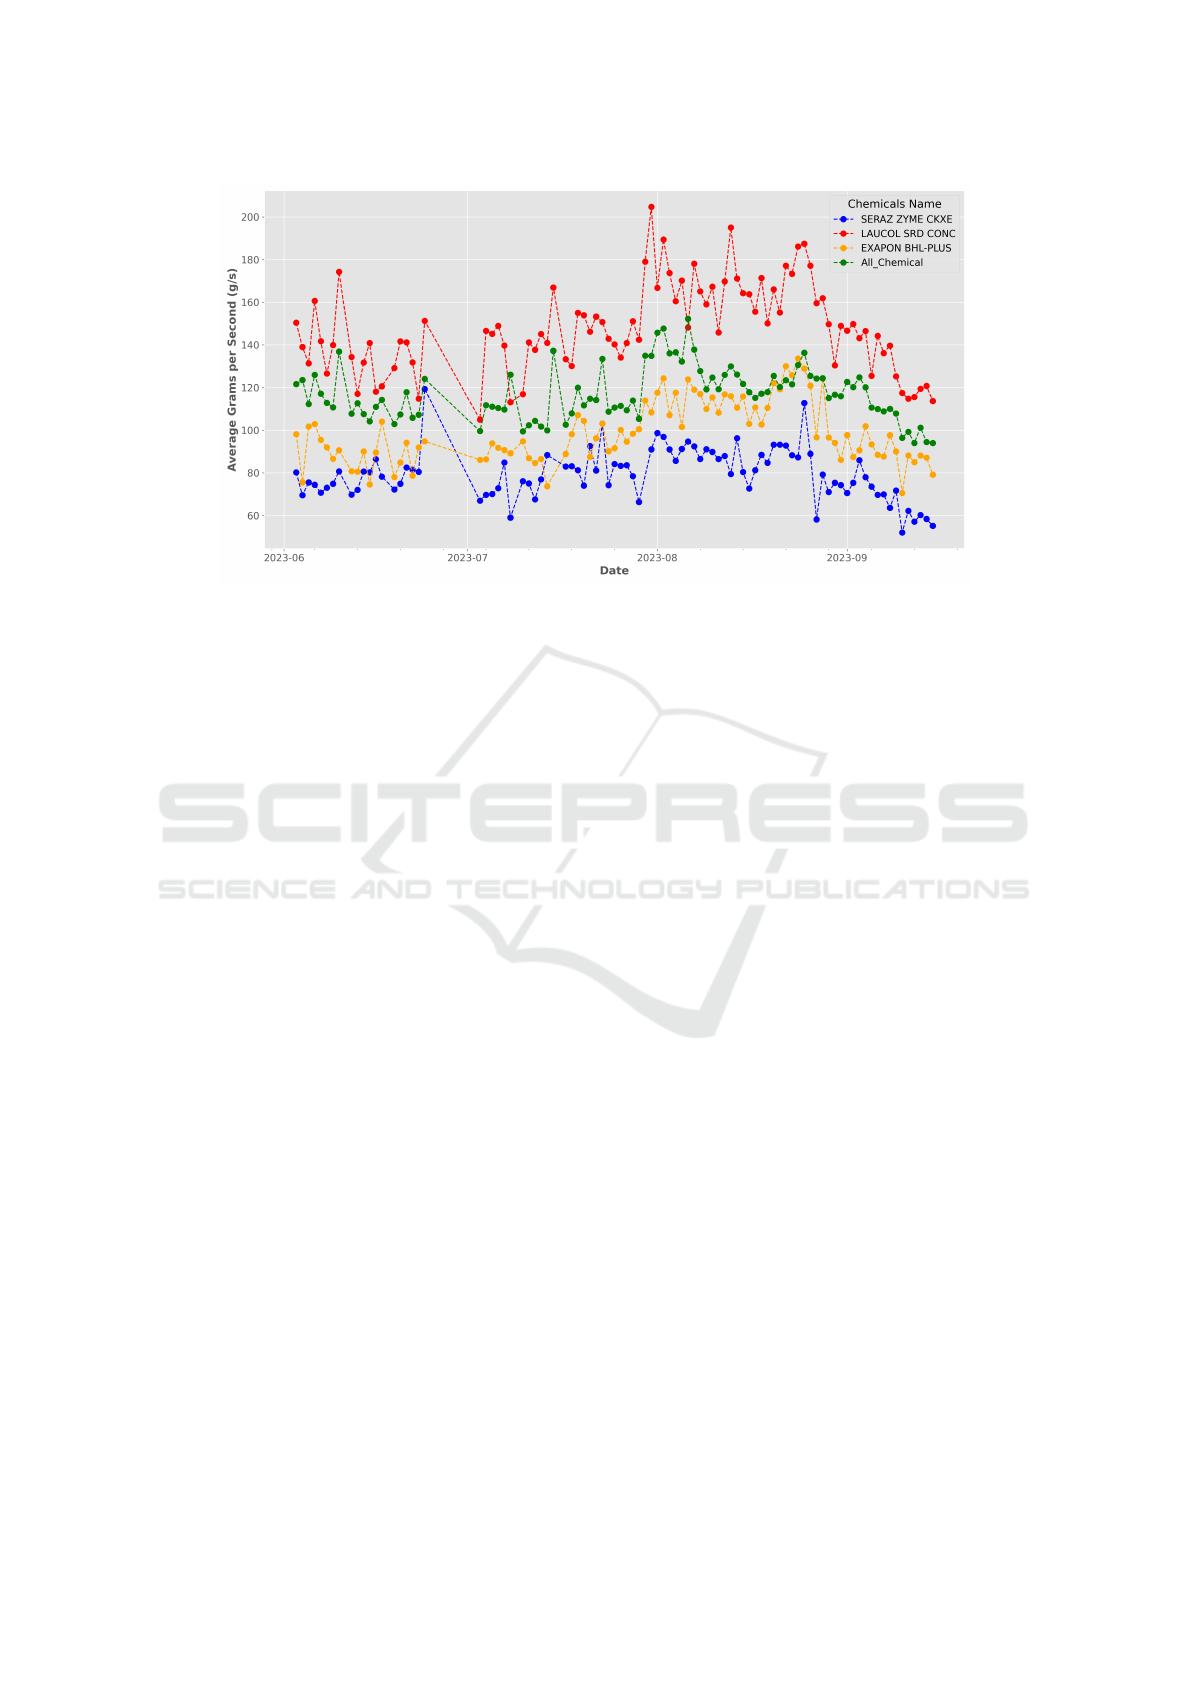
Figure 6: Daily average chemical usage of some chemicals.
by Facebook was selected for use. During time se-
ries analyses, it was observed that data points in the
dataset that spanned periods longer than six months
responded slowly to future predictions. Therefore, the
necessity of using more dynamic and current data for
analyses emerged. In order to capture trends and sea-
sonal effects more quickly, it was decided to use data
less than six months old in the analysis.
4.2.1 Enhancing Predictive Maintenance with
the Prophet Algorithm
The Prophet algorithm offers unique advantages when
working with datasets that include seasonal patterns,
holidays, and other periodic effects in time series
data. This algorithm contains flexible components de-
signed to adapt to the characteristics of time series
data. These components enable Prophet to explain
complexities in the dataset and make accurate future
predictions.
The prominent features of Prophet are:
• Adaptive Seasonality: It models complex season-
alities using Fourier series, adjusting to various
frequencies and magnitudes.
• Holiday Effects: Prophet effectively captures hol-
idays and events, a common shortcoming in tradi-
tional models.
• Robust Anomaly Detection: Prophet robustly
manages outliers and missing data, reducing their
adverse effects on prediction accuracy.
• Ease of Implementation and Adjustability: The
model’s hyperparameters are easily tunable, en-
suring flexibility and ease of use across various
datasets.
The basic mathematical model of Prophet is as fol-
lows:
y(t) = g(t) +s(t) + h(t)+ ε
t
(1)
• y(t): Time-dependent target variable.
• g(t): The trend component is usually modeled
with linear or logistic growth functions.
• s(t): The seasonal component is modeled using a
Fourier series
• h(t): The holiday effects component represents
the impacts of holidays or special days.
• ε
t
: The error term represents random effects not
explained by other factors.
The daily chemical weighing data obtained from the
database are analyzed using this model, and the poten-
tial failure times of the impeller pump are predicted.
Based on the learned data characteristics, our appli-
cation of the Prophet algorithm can predict potential
pump failures up to two weeks in advance and convey
this information to businesses. This predictive capa-
bility provides a significant contribution to factories
and businesses in maintaining uninterrupted produc-
tion processes and allows for the implementation of
an effective predictive maintenance program.
5 APPLICATION
This section details the pilot applications of the deter-
mined modeling and fault detection methodology in
various textile factories.
A Data-Driven Approach for Predictive Maintenance of Impellers in Flexible Impeller Pumps Using Prophet
249

5.1 Input and Data Collection
In the first step, historical data obtained from ma-
chines performing daily chemical weighing opera-
tions were collected to begin data preparation. The
machines used for data selection are those employed
as liquid chemical weighing and distribution systems
in factories. In total, 5400 manipulated and 1048000
raw data points were used per machine.
5.2 Outlier Detection, Setting Threshold
Values, Data Analysis, and
Performance Evaluation
After the dataset was formatted appropriately, two
new threshold values were calculated: Pump Main-
tanance Date (PMD), representing the average weigh-
ing amount at the last repair period of the pump,
reflecting the machine’s optimum performance; and
Predictive Maintanence Alarm Limit (PMAL), a
value used to detect the presence of any problem.
When calculating PMAL, the average of the dataset
from the last repair point PMD and the smallest value
in the dataset are determined. Then, 5% of the av-
erage value is calculated. This step performs a type
of fine-tuning by setting aside a ’safety margin’ from
the average value for determining the threshold value.
The PMAL is calculated by subtracting 5% of the av-
erage from the obtained minimum value. This process
not only ensures that the threshold value is more pro-
tective than just the minimum value but also takes into
account the overall data distribution. Thus, it shifts
the lower boundary of the dataset to a point that is
lower than the lowest value. Such an adjustment helps
prevent the model from overreacting while still offer-
ing a sensitive enough threshold to detect potential
problems. Especially, it reduces the impact of anoma-
lies such as noise or sudden changes in the dataset,
ensuring that the model is more stable and reliable.
Figure 7: Three-day windows.
After the process, the dataset was reversed in time
and divided into three-day windows, starting from the
most recent date. The average weighing amounts
and counts for the created three-day windows (for
example Figure 7, January 22, 21, and 20) were
found, summed up, and then divided by the number of
days. Thus, the average weighing amount and count
for each three-day window were calculated. Subse-
quently, for performance analysis, a comparison was
made with the next day (in our example Figure 7,
January 19), and two main control mechanisms were
used to determine whether the pump performance was
at an acceptable level:
1. Fixed Threshold Value (Pump Maintenance
Date Threshold): As a predetermined fixed
threshold value has been used a comparison point
in evaluating whether the pump performance is
sufficient. This threshold value represents the
lower limit of performance that is considered nor-
mal for the pump.
2. Data Set Time Range: When conducting perfor-
mance evaluations, it is important that the dataset
covers a minimum period of 14 days. We esti-
mate a 14-day period because studies conducted
on datasets shorter than our estimated period may
not yield accurate results.
When the established checks are met, the selected
date (for our example Figure 7, January 19) is con-
sidered as the last repair date of the pump, and the
average weighing from this date onwards is evaluated
as an indicator of the pump’s optimum performance.
Since variables such as the environmental conditions
of the machines in each factory, the usage styles of
the operators, and their changing work habits over
time are taken into account, the average weighing and
quantity obtained since the last repair, rather than a
general average, are used as a more meaningful per-
formance indicator. This method has been found to
provide a more consistent performance measurement
by reducing the impact of daily and environmental
variability.
5.3 Modeling and Forecasting
From the identified date, the dataset was reorga-
nized, and training was conducted with customized
hyperparameters for each machine using the Face-
book Prophet algorithm. The used hyperparameters
are as follows:
1. Changepoint Range (changepoint range): This
parameter specifies the portion of the dataset used
to detect trend changes. A value between 0 and 1
is set, where 1 means using the entire dataset. For
instance, a value of 0.95 indicates the model uses
95% of the data for detecting trend shifts, mak-
ing it sensitive to even minor changes, essential in
monitoring pump performance over time.
2. Changepoint Prior (changepoint
prior scale):
This controls how rapidly the model responds to
trend changes. A higher value means quicker
adaptation to trends, crucial for promptly identi-
fying potential issues in the dataset.
DATA 2024 - 13th International Conference on Data Science, Technology and Applications
250
3. Seasonality Mode (seasonality mode): Prophet
offers two modes: ’additive’, where seasonal ef-
fects are a fixed amount added to the forecast,
and ’multiplicative’, where seasonal effects vary
in proportion to the forecasted value. The ’mul-
tiplicative’ mode is chosen when seasonal varia-
tions are proportional to the time series level, as
seen in datasets where weighings increase on busy
days.
4. Additional Seasonalities (add seasonality): Be-
sides standard annual, weekly, and daily seasonal-
ity, extra patterns like monthly or quarterly can be
added. For instance, ’daily’ seasonality is added
with three sub-parameters:
• Name: Specifies the seasonality type, e.g.,
’daily’.
• Period: Defines the duration of the seasonality,
e.g., ’1’ for daily.
• Fourier Order: Determines the complexity of
the seasonal component, with higher values
capturing more complex patterns.
Table 2: Comparison of Default and Optimized Parameters.
Default Parameter Optimized Parameter
Changepoint Range = 0.8 Changepoint Range = 0.95,
SeasonalityMode= ’additive’ SeasonalityMode= ’Multiplicative’,
Sparse Prior = 10.0, Sparse Prior = 0.01,
Changepoint Prior = 0.05 Changepoint Prior = 0.1,
add seasonality(
name=annual,
period=365,
fourier order=5)
add seasonality(
name=’daily’,
period=1,
fourier order=15)
The model is prepared, trained, and tested in accor-
dance with the specified parameters. If the accuracy
rate of the model is found insufficient, this process is
repeated until the model makes predictions under the
desired conditions. When the model operates with the
desired level of accuracy, it is ready to make perfor-
mance predictions. Thus, the performance prediction
of the machine for the next fourteen days has been
made. If the predicted values fall below the ’PMAL’
threshold, it is concluded that the pump performance
is declining and needs to be replaced to prevent dis-
ruptions in the production process.
5.4 Reporting and Communication of
Results
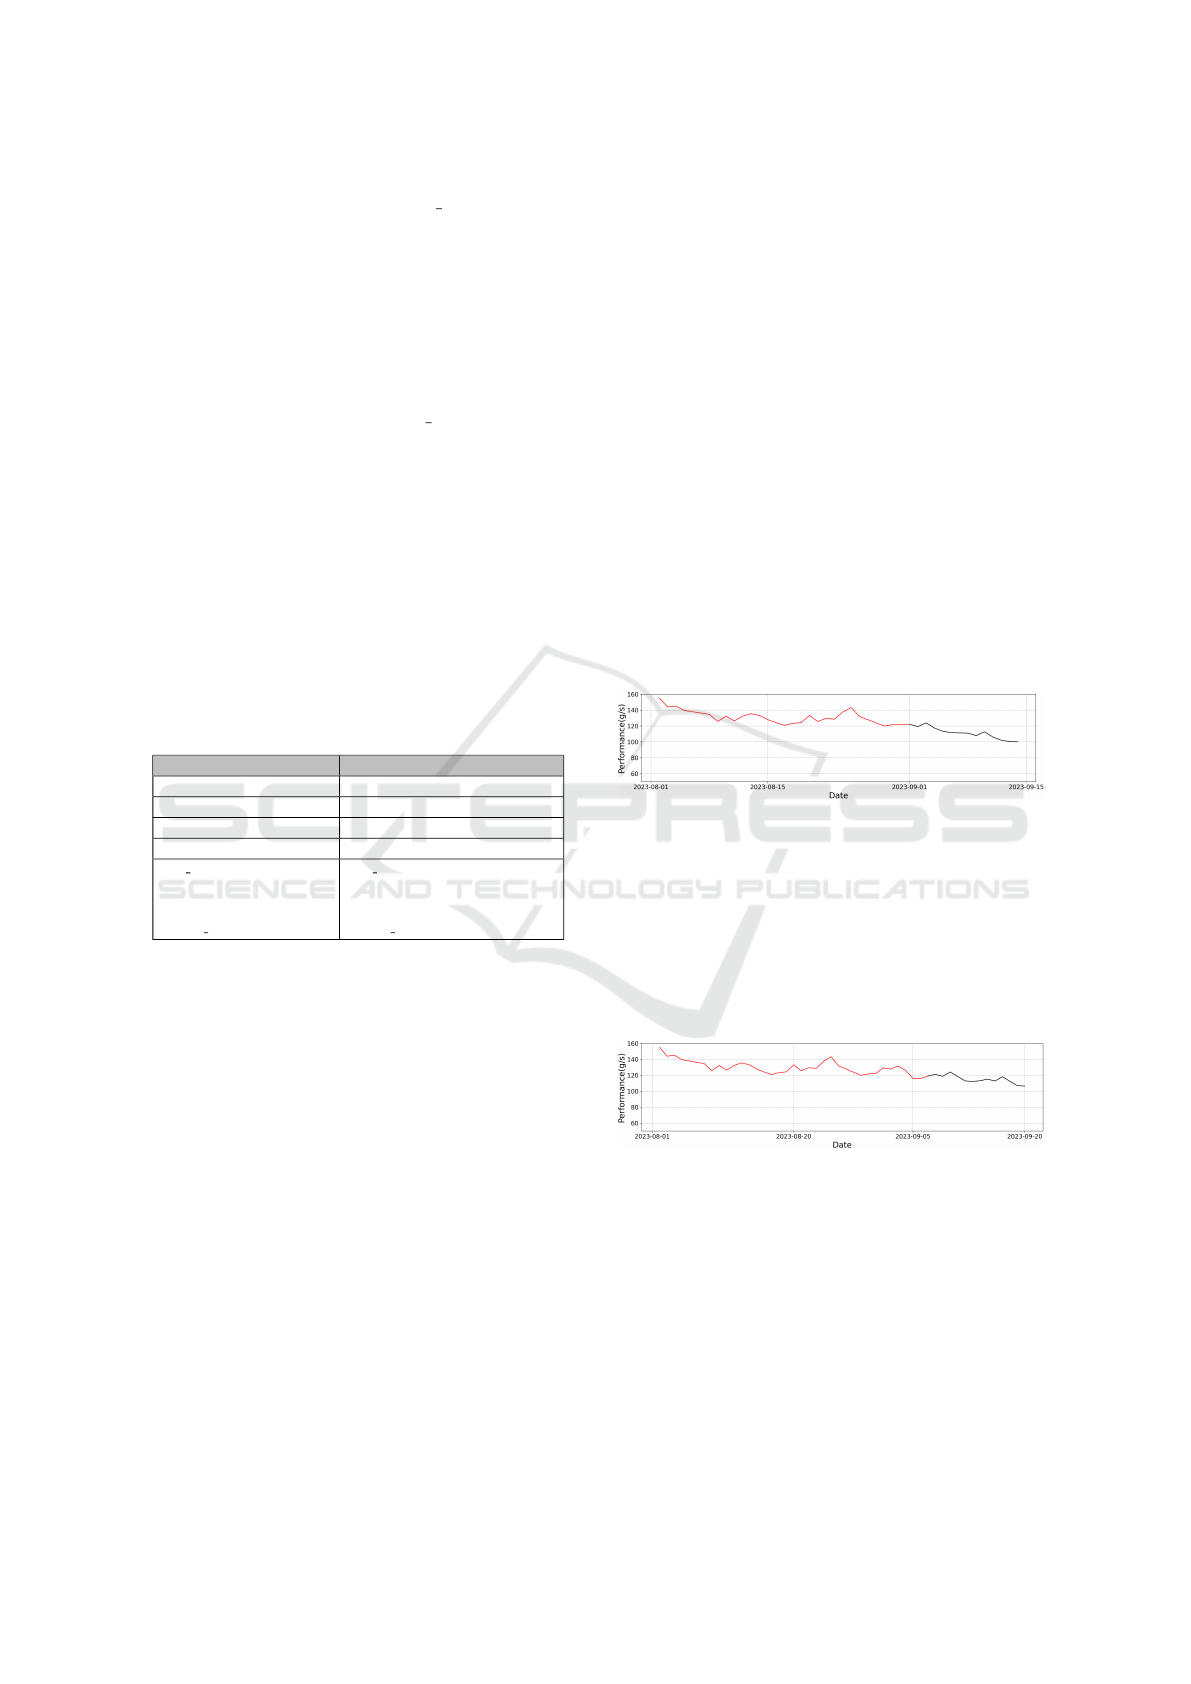
The examination of the prediction Figures 8, 9 and
10 generated by our model shows that the pump per-
formance displays a decreasing trend over time. Ini-
tially, it appears that the pump functions with normal
operating performance; however, as time progresses
and issues related to the FIP arise, a decrease in per-
formance is observed. These performance declines
have been successfully predicted by our model, and
these predictions indicate the need for early measures
to prevent potential problems.
The analysis conducted on the performance de-
cline has attempted to determine the underlying
causes of the decrease in pump efficiency, considering
various factors. The examination of the graph sug-
gests that the observed fluctuations in performance
during certain time intervals could be related to fac-
tors such as the pump’s operating conditions, mainte-
nance programs, usage intensity, and wear.
In detail, the time series data in Figures 8, 9
and 10 show the frequency and severity of perfor-
mance declines on specific dates. The red line rep-
resents the observed actual performance, while the
black line represents the predicted performance. The
alignment between these two lines reflects the accu-
racy of the prediction model and its early warning ca-
pability against potential performance issues.
Figure 8: Model prediction graph start 01-08-2023 - predic-
tion time 01-09-2023.
In Figure 8, the model covering the period from
August 1st to September 1st does not forecast a sig-
nificant decline in the pump’s performance. The per-
formance indicators show that the PMAL threshold is
calculated as 111.40 and the estimated value of FIP
is determined to be 113.32. Therefore, no warning or
intervention is deemed necessary.
Figure 9: Model prediction graph start 01-08-2023 - predic-
tion time 07-09-2023.
Figure 9 encompasses an extended version of the
same date range for the pump’s operation, showing no
significant changes in its performance. PMAL thresh-
old being set at 109.16, while the estimated value of
the impeller in the FIP is at 115.15, indicates that no
problematic issues have been detected, thus negating
the need for any intervention.
However, there is a noticeable change in Figure
10. The model predicts a critical decrease in pump
performance from September 7th onwards. Recent
A Data-Driven Approach for Predictive Maintenance of Impellers in Flexible Impeller Pumps Using Prophet
251

Figure 10: Model prediction graph start 01-08-2023 - pre-
diction time 17-09-2023.
calculations have determined the threshold for Pump
Maintenance Alert Level (PMAL) at 83.37. In light of
these findings, the estimated value of the impeller in
the FIP has been assessed at 80.02. This value, falling
below the established PMAL threshold, indicates the
necessity for maintenance intervention.
Consequently, our model’s predictions enable
maintenance and repair teams to plan effectively,
thereby increasing the efficiency and reliability of the
business. The identified situation is presented to the
relevant departments with reports containing visual
and statistical data from the trained model. This anal-
ysis process is conducted in accordance with a three-
day windowing logic. This method allows adaptation
to the dynamics of factory operations and enhances
the ability to respond quickly to changes in machine
performance.
6 CONCLUSIONS
In summary, we underscore the critical impact of
impeller wear in FIP on the textile dyeing process
and liquid chemical weighting systems through our
study. We emphasize the necessity for regular mon-
itoring and predictive maintenance of these pumps,
especially considering the wear patterns typically ob-
served within 4-6 months. Our use of the Facebook
Prophet model and time series data for early detection
of wear presents a proactive approach to maintaining
pump efficiency without installing new hardware and
high cost.
Our future research will involve applying the
Prophet model to time-series data we have already
collected from equipments in fabric dyeing machines
to develop predictive maintenance solutions.
ACKNOWLEDGEMENTS
This work is supported by The Scientific and Techno-
logical Research Council of Turkey (T
¨
UB
˙
ITAK) un-
der the project number №3200916.
REFERENCES
Almazrouei, S. M., Dweiri, F., Aydin, R., and Alnaqbi, A.
(2023). A review on the advancements and challenges
of artificial intelligence based models for predictive
maintenance of water injection pumps in the oil and
gas industry. SN Applied Sciences.
Chen, L., Wei, L., Wang, Y., Wang, J., and Li, W. (2022).
Monitoring and predictive maintenance of centrifugal
pumps based on smart sensors. Sensors, 22:2106.
Chhabria, S., Ghata, R., Mehta, V., Ghosekar, A., Araspure,
M., and Pakhide, N. (2022). Predictive maintenance
using machine learning on industrial water pumps. In-
ternational Journal of Innovations in Engineering and
Science, 7(9):76–81.
Daraz, A., Alabied, S., Gu, F., and Ball, A. D. (2019). Mod-
ulation signal bispectrum analysis of acoustic signals
for the impeller wear detection of centrifugal pumps.
In 2019 25th International Conference on Automation
and Computing (ICAC), pages 1–6.
Demirkiran, C. N.,
¨
Ust
¨
un, E., and Urhan, O. (2022).
Time series forecasting performance analysis of the
prophet method for predictive maintenance appli-
cations. ELECO 2022 Electrical-Electronics and
Biomedical Engineering Conference.
Emir
ˇ
Zuni
´
c, Kemal Korjeni
´
c, K. H., D. Ð. (2020). Ap-
plication of facebook’s probhet algorithm for success-
ful sales forecasting based on real-world data. Inter-
national Journal of Computer Science & Information
Technology (IJCSIT) Vol 12, No 2.
G
¨
org
¨
ul, A., C¸ om, M., and Sultano
˘
glu, S. (2023). Ker-
nel ridge regression based modelling and anomaly de-
tection for temperature control in textile dyeing pro-
cesses. In 27th International Conference on System
Theory, Control and Computing, pages 392–397.
Hooton, S. (2019). Flexible impeller pump
guide. https://www.northridgepumps.com/
article-141\_flexible-impeller-pump-guide.
Khoie, R., Gopaluni, B., Olson, J. A., and Stoeber, B.
(2015). A magnetic sensor to measure wear in cen-
trifugal pumps.
Qu, J., Miao, C., Hoseini, M., and Zuo, M. J. (2009).
Wear degree prognostics for slurry pumps using sup-
port vector machines. In 2009 8th International Con-
ference on Reliability, Maintainability and Safety.
Sanayha, M. and Vateekul, P. (2017). Fault detection for
circulating water pump using time series forecasting
and outlier detection.
Sarkar, A., Johnson, I., and Cohen, A. (2023). Jj piz-
zuto’s fabric science. https://books.google.com.
tr/books?id=5APXEAAAQBAJ.
Sugiyama, K., Nagasaka, H., Enomoto, T., and Hattori, S.
(2009). Prediction of wear depth distribution by slurry
on a pump impeller. International Journal of Fluid
Machinery and Systems, 2(1).
Taylor, S. J. and Letham, B. (2017). Forecasting at scale.
PeerJ Preprints.
Wang, C.-C. and Li, Y.-H. (2022). Machine-learning-based
system for the detection of entanglement in dyeing
and finishing processes. Sustainability 2022.
DATA 2024 - 13th International Conference on Data Science, Technology and Applications
252
