
Determining the Progress of a Business Object Based on Its Object
Instances: An Empirical Study
Lisa Arnold
a
, Marius Breitmayer
b
and Manfred Reichert
c
Institute of Databases and Information Systems, Ulm University, James-Franck-Ring, 89081 Ulm, Germany
fi
Keywords:
Object-Centric Business Process, Business Process Monitoring, Business Object, Process Progress.
Abstract:
A fundamental task of any business process monitoring component is to continuously determine the progress
of the running processes of an enterprise. This is particularly challenging when facing dynamic processes
undergoing changes during run-time, which most likely affect the progress of the respective processes as well.
This paper considers object-centric business processes, which consist of business objects and their relations.
During run-time, these business objects may be instantiated multiple times to form object instances. The run-
time behaviour of these object instances is manifested in terms of object lifecycles that interact with each other.
For monitoring a single business object five alternative methods are introduced, which allow determining the
progress based on average calculations, information about the semantic object relations (hierarchical order,
minimal and maximal cardinality), or event logs (if available). For all methods, the precalculated progress
of individual object instances is leveraged. To evaluate the different methods, an empirical study with 65
participants was conducted. As key observation, the majority of the participants that are experienced with
process modelling and monitoring tools, prefer deriving the progress of a business object from event logs. The
results of this paper are fundamental for determining the progress of a holistic object-centric business process.
1 INTRODUCTION
Monitoring the progress of running processes in real-
time (e.g. in terms of a monitoring dashboard) is
indispensable for agile enterprises. Monitoring al-
lows economising resources (e.g. human and ma-
terial consumption), efficiently planning the running
process(es), and saving costs and time. With the in-
sights gained through process monitoring future pro-
cess runs can be optimised. Process progress deter-
mination is a fundamental, but often neglected task
in business process monitoring. In this paper, the
progress determination of a business object in the con-
text of an object-centric business process is defined.
The latter consists of business objects and their re-
lations. During run-time, multiple interacting object
instances are instantiated from these business objects.
Furthermore, the run-time behaviour of these object
instances are defined by their object lifecycles.
Process progress determination is challenging due
to the multitude of object instances that may be cre-
a
https://orcid.org/0000-0002-2358-2571
b
https://orcid.org/0000-0003-1572-4573
c
https://orcid.org/0000-0003-2536-4153
ated (and eventually be deleted afterwards) during
the execution of an object-centric process. Conse-
quently, for a real-world entity, hundreds or thousands
of corresponding object instances and their interac-
tions with instances of other business objects may ex-
ist. In addition to this challenge, dynamic process
changes (e.g. in the context of a process model evolu-
tion) might become necessary affecting the progress
of running object instances as well (Andrews et al.,
2021). Furthermore, at build-time, the total number
of the object instances involved in an object-centric
business process is not fully known, but evolves dur-
ing run-time, varying across the object instance of an
object-centric process. Consequently, the behaviour
of the overall business process (i.e. the object-centric
process) may vary as well (Steinau et al., 2021).
To tackle the challenge of progress determination,
a bottom-up approach is pursued that starts with the
determination of a single object instance and leads to
the determination of the overall progress of a busi-
ness process. This paper deals with determining the
progress of one business object (e.g. object Applica-
tion of a recruitment process) based on the precalcu-
lated progress of its object instances (Arnold et al.,
2021) (e.g. Application1 and Application2) in the
Arnold, L., Breitmayer, M. and Reichert, M.
Determining the Progress of a Business Object Based on its Object Instances: An Empirical Study.
DOI: 10.5220/0012713200003753
Paper published under CC license (CC BY-NC-ND 4.0)
In Proceedings of the 19th International Conference on Software Technologies (ICSOFT 2024), pages 315-322
ISBN: 978-989-758-706-1; ISSN: 2184-2833
Proceedings Copyright © 2024 by SCITEPRESS – Science and Technology Publications, Lda.
315
context of an object-centric business process (i.e. a
collection of concurrently executed, but independent
object instances). To address this challenge five alter-
native methods are developed and compared. These
methods are based on the average progress of context-
related object instances, information about semantic
object relations (hierarchical order, minimal and max-
imal cardinality), or event log data (i.e. the process
history). The information (e.g. log data) on which
these methods are based is not always available.
Sec. 2 provides background information about
object-centric processes and sets out the research con-
text of determining the progress of an object-centric
business process. Sec. 3 then introduces five alter-
native methods for determining the progress of one
business object based on the progress of its context-
related object instances. Sec. 4 describes the research
design of the conducted evaluation study to assess the
five methods. Sec. 5 analyses and evaluates the re-
sults of this study. Sec. 6 addresses related work and
Sec. 7 concludes the paper.
2 BACKGROUNDS AND
RESEARCH CONTEXT
In the object-centric process management paradigm
a business process is described in terms of interact-
ing business objects that correspond to real-world en-
tities. An implementation of this paradigm is pro-
vided by the PHILharmonicFlows framework, which
enables dynamically evolving object-centric business
processes that allow for both build-in flexibility and
ad-hoc process changes during run-time (Andrews
et al., 2021). The relations between the business
objects, including their cardinalities and hierarchi-
cal structuring, are manifested by the Relational
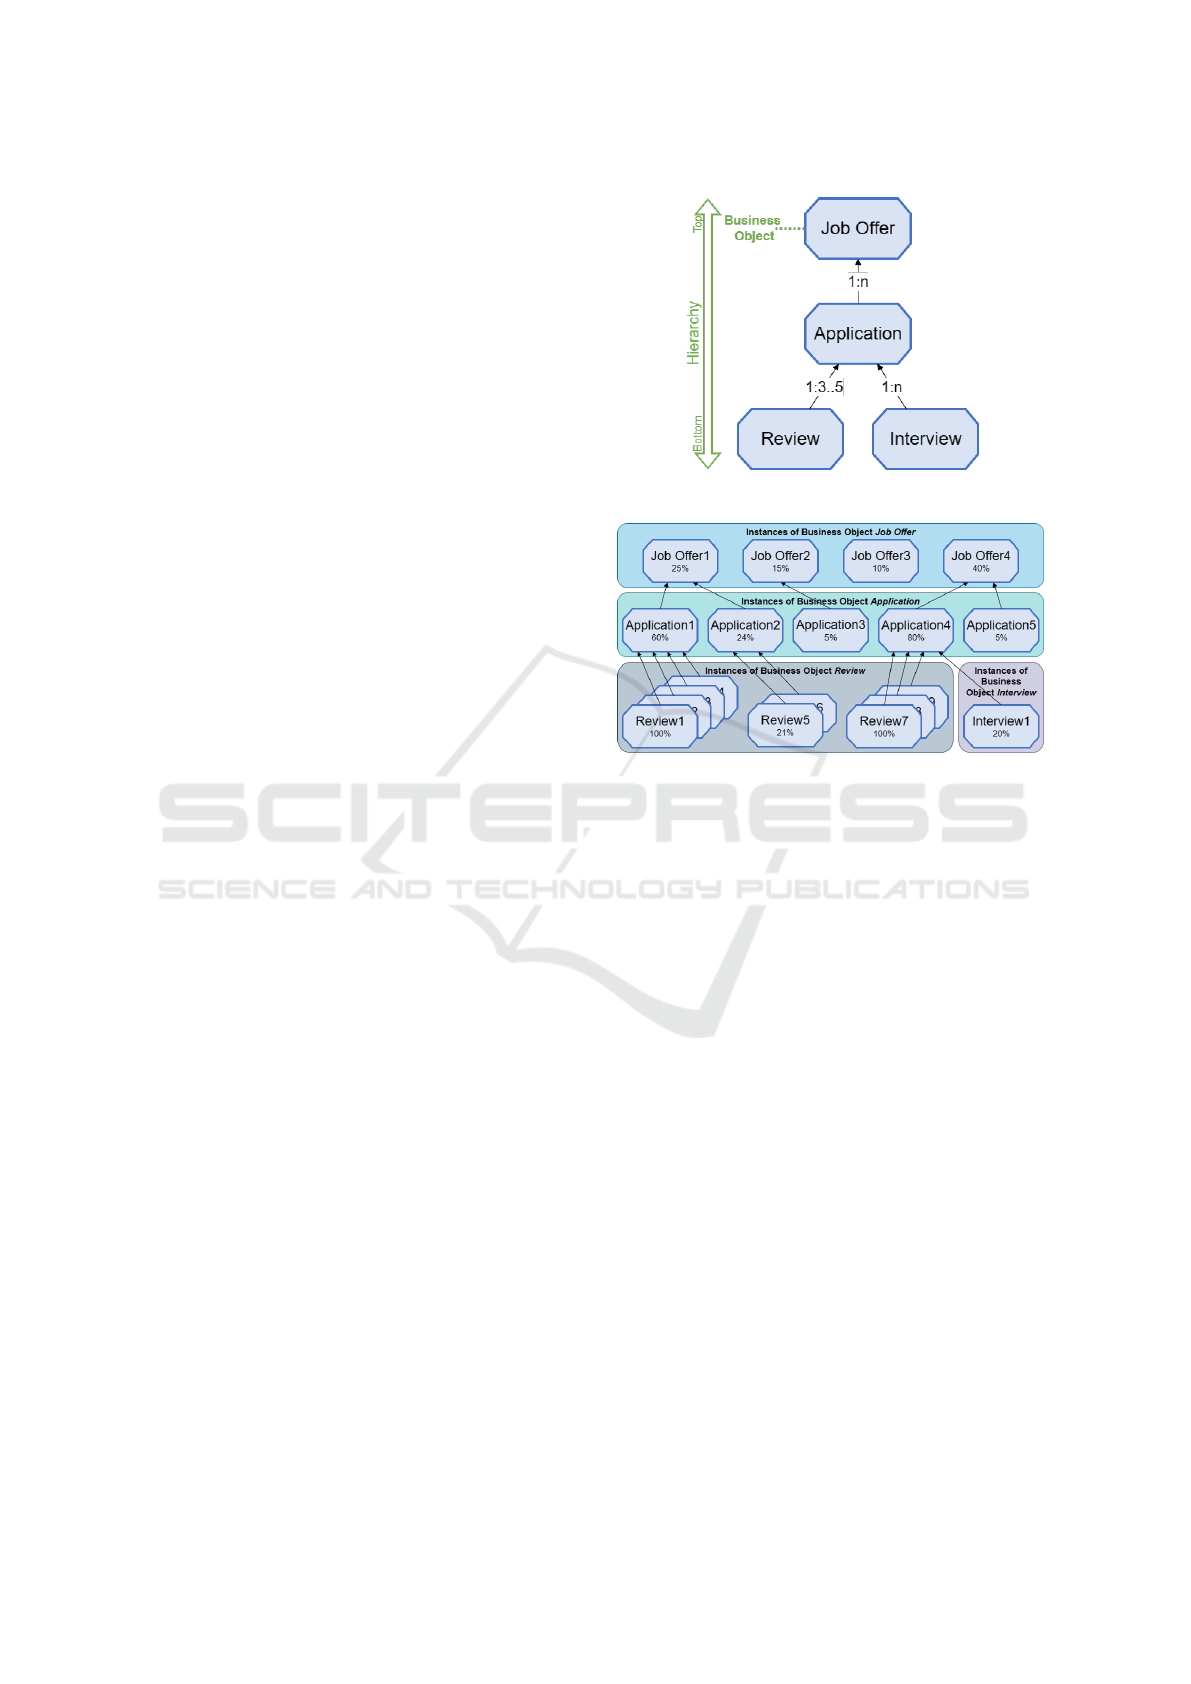
Process Structure (RPS) (Steinau et al., 2018).
The RPS corresponding to a recruitment business
process is shown in Fig. 1. At run-time, Object
Instances (e.g. Job Offer1 to Job Offer4) of a busi-
ness object (e.g. Job Offer) are created and organised
in a relational instance structure. An example of such
a relational instance structure is shown in Fig. 2.
2.1 Research Context and Research
Questions
Determining the progress of an object-centric busi-
ness process as depicted in Fig. 2 is a challenging
task. First of all, it should be possible to determine the
progress of a single object instance (e.g. Job Offer1)
based on its lifecycle process. This task has already
Figure 1: RPS at design-time with its Business Objects.
Figure 2: Relational instance structure at run-time.
been addressed by us in (Arnold et al., 2021). The
method we presented in this work is based on a one-
dimensional Kalman Filter which is used to determine
the progress of a single object instance. Fig. 2 shows
an example of an object-centric business process em-
phasising the progress of object instances depending
on the progress of their subordinated object instances.
The aim of this paper is to determine the progress of
one business object (e.g. object Review) based on the
precalculated progress (cf. (Arnold et al., 2021)) of its
object instance (e.g. Review1 to Review9). Note that
in object-centric processes, an arbitrary number of ob-
ject instances may be created or deleted during run-
time, which turns the task of determining the progress
of such processes into a challenging endeavour:
• For different business objects there may be a vary-
ing number of object instances and corresponding
object instance interactions.
• The total number of object instances is not com-
pletely known at build-time, but dynamically
evolves during run-time.
• Due to dynamic changes of an object-centric pro-
cess (e.g. to add or delete object attributes or to
change cardinalities of object relations) the be-
haviour of different object instances of an object-
centric process may vary significantly.
ICSOFT 2024 - 19th International Conference on Software Technologies
316

To tackle these challenges, the following research
question (RQ) is considered:
RQ: How can the progress of one business object
with multiple object instances be determined in
the context of an object-centric business pro-
cess?
First, different methods for determining the
progress of one business object based on the already
precalculated progress of its object instances are pre-
sented (cf. Sub-RQ 1). Second, the different methods
are investigated and compared in an empirical study
(cf. Sub-RQ 2). The study focuses on the suitability
of the progress determination methods and elaborates
on whether they match human intuition.
Sub-RQ 1: What alternative methods exist to deter-
mine the progress of one business ob-
ject based on the progress of its context-
related object instances?
Sub-RQ 2: Which of these methods is suited best
for users, i.e. matches human intuition
best?
3 PROGRESS DETERMINATION
METHODS
Determining the progress of a varying number of ob-
ject instances created in the context of one business
object can be accomplished in various ways. More
specifically, progress calculations may be based on
the given RPS (cf. Sec. 2), on average calcula-
tions, or on event log data (i.e. the process his-
tory). This section introduces five alternative methods
for determining the progress of one business object
(progress
method
) based on the precalculated progress
(cf. (Arnold et al., 2021)) of its object instances.
3.1 Method 1: Total Average
The most intuitive method to determine the progress
of one business object (e.g. Review) is to calculate
the average (AVG) progress of its object instances.
Therefore, the precalculated progress prog
i
of each
object instance i is added up and the resulting num-
ber is divided by the total number I of these object
instances. This calculation is formalised by Formula
(1).
progress
AVG
=
∑
I
i=1
prog
i
I
with prog
i
∈ {x | x ∈ R, 0 ≤ x ≤ 100}
and I ∈ N
+
(1)
3.2 Methods 2 and 3: Cardinalities
At design-time, each object is related to at least one
other object in the RPS. Corresponding relations are
equipped with a 1:n cardinality (n ∈ N). Thus, for a
particular parent object, many child objects may be
created at run-time. Moreover, the respective cardi-
nality may be restricted by a minimum and maximum.
For example, in Fig. 1 the cardinality between parent
object Application and its child object Review is given
by 1:3..5. This means that, only a maximum number
of five Review instances may be created in the con-
text of one given Application instance at run-time and
a minimum number of three object instances are re-
quired to terminate the respective business process.
Note that the m:n cardinality (n, m ∈ N) does not exist
in our modelling tool PHILharmonicFlows.
3.2.1 Method 2: Minimum Cardinality
When using the minimal cardinality (MIN), the
progress is determined most optimistically by expect-
ing the minimum number of possible object instances
to be executed, as defined by the minimum cardi-
nality. More specifically, the precalculated progress
prog
i
of all object instances i (with the total number of
instances I) are added up and divided by the result of
adding up the maximum max() of the minimum car-
dinality c
min
or the number of created object instances
I(p) for each parent object p (with the total number
of parent objects P). This calculation is formalised by
Formula (2).
progress
MIN
=
∑
I
i=1
prog
i
∑
P
p=1
max(c
min
, I(p))
with prog
i
∈ {x | x ∈ R, 0 ≤ x ≤ 100}
and I,P, c
min
, I(p) ∈ N
+
(2)
3.2.2 Method 3: Maximum Cardinality
When using the maximum cardinality (MAX), the
progress is determined most conservatively by expect-
ing the maximum number of possible object instances
to be executed, as defined by the maximum cardi-
nality. More specifically, the precalculated progress
prog
i
of all object instances i (with the total number of
instances I) are added up and divided by the product
of the maximum cardinality c
max
and the total num-
ber of parents P. This calculation is formalised by
Formula (3)
progress
MAX
=
∑
I
i=1
prog
i
c
max
∗ P
with prog
i
∈ {x | x ∈ R, 0 ≤ x ≤ 100}
and I,c
max
, P ∈ N
+
(3)
Determining the Progress of a Business Object Based on its Object Instances: An Empirical Study
317

3.3 Method 4: Event Logs
Event logs (LOG) can be used to predict the expected
number of object instances E that will be created for a
business object in the context of their common parent
object instance. For this purpose, all finished parent
object instances (of either terminated or running pro-
cesses) are continuously analysed and the expected
number of created object instances is determined (e.g.
based on average or machine learning). To calculate
the progress based on this estimation, the precalcu-
lated progress prog
i
of all object instances i (with the
total number of instances I) are added up and divided
by the result of adding up the maximum max() of the
expected number of object instances E or the number
of created object instances I(p) for each parent object
p (with the total number of parent objects P). Note
that this method may only be used if an event log ex-
ists and the accuracy of the prediction depends on the
quality of the log. This calculation is formalised by
Formula (4).
progress
LOG
=
∑
I
i=1
prog
i
∑
P
p=1
max(E, I(p))
with prog
i
∈ {x | x ∈ R, 0 ≤ x ≤ 100}
and E ∈ R and I, P, I(p) ∈ N
+
(4)
3.4 Method 5: Parent Object
The Parent Object method (PO) combines two con-
cepts:
1. Considering the object instances created for a
business object in the context of each parent ob-
ject instance individually (as in MIN, MAX, and
LOG).
2. The average calculation (as in AVG).
For this, first the average of the progress prog
i∈p
of all object instances I(p) created for a business ob-
ject in the context of each parent object instance p
(e.g. all reviews of the same application) is calcu-
lated individually. Second, the average of these re-
sults is calculated (with the total number of parent ob-
ject instances P) to determine the overall progress of
the business object (e.g. object Review). Note that
prog
i∈p
numbers the progress of the instances i for
each parent object instance individually. This calcu-
lation is formalised by Formula (5).
progress
PO
=
∑
P
p=1
∑
I(p)
i=1
prog
i∈p
I(p)
P
with prog
i∈p
∈ {x | x ∈ R, 0 ≤ x ≤ 100}
and I(p), P ∈ N
+
(5)
4 RESEARCH METHOD
This section summarises the research method under-
lying the empirical study we conducted to assess the
five progress determination methods from a human
perspective. In detail, this section focuses on the data
collection method, the study design and structure, and
the data analysis method.
4.1 Data Collection
How users perceive the progress of a business ob-
ject based on the five progress determination meth-
ods is investigated in an empirical study. For conduct-
ing this study and collecting data, the web-based tool
Unipark is leveraged. The study is performed based
on an anonymous online questionnaire
1
and is avail-
able in both English and German language. More-
over, both language options do not differ with respect
to content or structure. The questionnaire was avail-
able over a period of one month.
4.2 Study Execution
The empirical study is structured in five parts with a
total of 35 questions. For this purpose, dichotomous,
semi-open multiple choice questions, and open ques-
tions are used. Moreover, some of the questions are
identical, but refer to different backgrounds.
Demographics and Experience. In the first
part of the study, demographic data is queried from all
participants. This includes information like gender,
age, current profession, and professional field. More-
over, the experiences of the participants in respect to
process modelling and (business process) in general
are queried.
Training. The second part offers a training ses-
sion for about half of the participants. The other half
does not participants in any training session. For se-
lecting the participants a random function is used.
The training includes the explanation of the progress
determination methods as well as the study structure.
Perception of Progress. The main part of
the study aims to assess the perception of progress for
three different scenarios using the described progress
methods (cf. Sec. 3). For each scenario multiple
questions with a varying number of object instances
are given.
1
Questionnair and responses of the 65 participants are
available on Researchgate: https://www.researchgate.net/
publication/378140057 Determining the Progress
ICSOFT 2024 - 19th International Conference on Software Technologies
318

Details about the scenarios.
1.) Evaluation of research papers for a conference.
All papers shall be evaluated by 3 to 5 reviewers to
decide whether or not the paper can be accepted.
2.) Grade bonus for students. To receive the grade
bonus for a particular exam, students need to
achieve at least 80% of all exercise points from
the 12 to 15 exercise sheets.
3.) Recruitment process. A company has published a
large number of vacancies. Depending on the job
offer, there are many, few, or no applicants.
With 14 semi-open multiple choice questions (i.e.
seven for Scenario 1, three for Scenario 2, and four for
Scenario 3), the participants have to choose their most
appropriate progress calculated for each question of
the given scenario. Additionally, for each progress,
the calculated progress determination method is pro-
vided (i.e. ”a.) 85% (AVG)”). Moreover, if none of
the given methods match the participants intuition of
progress, the participants may indicate their percep-
tion of progress with a short explanation.
Cognitive Strain and Behaviour during
Participation. Each scenario is completed with
the following three questions to investigate the
behaviour of the study participants.
1.) Were you able to answer the previous questions
clearly? If not, why?
2.) Did you change answers from previous questions
when answering this form sheet? If yes, why and
where?
3.) Have you chosen different methods for different
scenarios? If yes, why?
Ranking the Methods: Additional to the
scenarios, the participants rated the progress deter-
mination methods in a ”drag-and-drop” like manner,
with ranking the method they consider being most
suitable at the top. As not all methods are always
applicable to determine progress, the following
three combinations are considered to cover the most
common real-world conditions.
Available methods:
Case 1: AVG, MIN, MAX, LOG, and PO
Case 2: AVG, MIN, MAX, and PO
Case 3: AVG, MIN, and LOG
First, all methods are available for the participants to
define a suitable ranking. Second, all methods except
LOG is given to find a suitable ranking if no event
log exists. Third, MAX and PO are not available, as
the maximum cardinality is often not defined for top-
level objects and the PO is not applicable to top-level
objects in general. Additionally, an optional text field
is given to describe a method or procedure that does
not corresponds to the five introduced progress deter-
mination methods.
Language: Finally, the participants are asked,
which language version they read to verify that no dif-
ferences exist in the translation and wording.
4.3 Data Analysis
The study structure and its data analysis and valida-
tion are generated on the checklist of the empirical
cycle described in (Wieringa, 2014). Furthermore,
all collected data of the questionnaire are analysed
and evaluated based on the methodology presented
in (Wieringa, 2014; Brace, 2018). The aim of the
evaluation is to find a representative answer that re-
flects the opinion of the participants. In detail, an ex-
ploratory analysis is applied that uses Cross Tabula-
tions to compare the quantitative results from differ-
ent participant groups. In addition, open-ended ques-
tions are extended to investigate the cognitive strain
and behaviour during participation. In the evalua-
tion, different participant groups are defined accord-
ing to their background and prior knowledge. The di-
vision into groups allows to investigate variations in
the perception of progress and the associated choice
of progress determination methods depending on the
background knowledge of the individual participants.
5 EVALUATION
Overall, 65 participants completed the questionnaire
of the empirical study. 5 of them were excluded as
they had problems understanding the tasks (answer-
ing the questions as ”not clear” at cognitive strain
part). The following evaluation is based on the an-
swers of the remaining 60 participants.
5.1 Demographics and Experience
In total, more male (39 | 65%) than female (19 |
31.7%) participants took part. The remaining partici-
pants define their gender as non-binary (2 | 3.3%). Al-
together, the participants are between 19 and 34 and
on average 25.13 years old.
Most participants have their profession field in the
MINT (Mathematics - Computer Science - Natural
Science - Technology) (51 | 85%). The remaining par-
ticipants have a background in economics (9 | 15%).
Thereby, most participants are students (43| 71.7%)
studying either in a MINT (34 | 79,1%) or an eco-
nomics program (9 | 20.9%). The second major share
Determining the Progress of a Business Object Based on its Object Instances: An Empirical Study
319

is given by academics (14 | 23,3%) in MINT. The re-
maining participants are working in industry with fo-
cus in MINT (3 | 5%). With this group of participants,
confounding variables (as e.g. general school educa-
tion or major age differences) could be avoided as far
as possible.
Exactly one quarter (15 | 25%) of the participants
have no experiences with process modelling, most of
them are students (14 | 93.3%). Half of the partic-
ipants (30 | 50%) are not familiar with monitoring
tools, 27 of them are students (27 | 90%). More than
one third (21 | 35%) of the participants have experi-
ences with business process monitoring tools. This
group is also familiar with process modelling and
monitoring tools and define the expert group. In this
expert group, the share of male (10 | 47,6%) and fe-
male (11 | 52.4%) is similar. On average they are 26.8
years. Most of them have their professional field in
MINT (18 | 85.7%) the remaining in economics (3 |
14.3%). Most of them are academics (11 | 52.4%).
The remaining participants are divided in students (9
| 42.8%) and others (1 | 4.8%). The non-experts are
composed of all participants except the experts. In the
following, the results of the experts (E) are compared
with the ones of the non-experts (NE) to enable a pro-
found analysis.
5.2 Perception of Progress
The perception of progress differs significantly be-
tween the experts and non-experts (cf. Tab. 1). The
biggest difference can be found in the number of par-
ticipants that chose the progress calculation based on
LOG. In each of the 14 perception progress questions,
at least 71.4% (up to 85.7%) of experts chose the
progress based on LOG. In contrast, the non-expert
selected this method only with at least 23.1% (up to
38.5% in the second scenario and up to 51.3% in the
third scenario). In 5 of 13 cases, where AVG and LOG
are used, the non-experts opted for AVG. In the other
8 cases, the majority favoured LOG. Consequently,
LOG has been mostly chosen, when object instances
are created from more than one parent object.
In the first scenario, the answers of the non-
experts are approximately evenly distributed between
the progress determination methods. The methods
AVG, MIN, and PO are chosen less and less over the
questionnaire (Scenarios 2 and 3). Considering the
non-experts for the first scenario at most 10.3% pre-
ferred the progress based on MAX. However, in the
second scenario this method was selected by up to
28.2% of the non-experts. This may be due to the
fact that in the first question of Scenarios 2 only 3 of
at least 12 (up to 15) exercise sheets have been com-
pleted and the progress is calculated far too high when
choosing AVG. Accordingly, AVG was chosen signif-
icantly (above 10%) less. As another observation that
emerged from the study responses, PO is not preferred
by experts. In comparison, up to 20.5% of the non-
experts chose PO. Furthermore, the number of partic-
ipants choosing the same method for all questions of
one scenario is increasing significantly from the first
to the third scenario (to threefold) by the non-experts.
In general, it can be observed that non-experts do not
have a clear preferred method. In contrast, LOG was
preferred by the experts in most cases (more than 80%
in Scenarios 1 and 2, more than 70% in Scenario 3).
The last question of scenario 3 addresses the issue of
how to define progress if no object instance is created.
In this case, both groups answer very similar. Above
70% voted for 0% and the remaining for 100%. Addi-
tionally, one expert remarked that no progress should
be assigned in this case and the progress of the parent
object should be used instead.
5.3 Ranking the Methods
In this part, the participants rank the progress determi-
nation methods considering their suitability. There-
fore, the position of each method is represented by a
number. For example, 1 is assigned to the top-rated
method.Tab. 2 shown, the average position for each
method for both groups separately.
PO is rejected by most participants in both groups.
For example, non-experts rated it with 4.2 out of 5
(whereas 5 is most unsuitable) and the experts rated it
with 4.6 out of 5 in the first case. The remaining rank-
ing has shown similar results. Note that the number
of available methods differs in Case 2 and 3. Further-
more, MIN is evaluated very similarly by both groups
and is rejected, next to PO, as the second most unsuit-
able method. Compared to MIN, MAX is more suit-
able. In general, most participants preferred a more
conservative progress calculation.
Both groups differ in their choice of the most suit-
able method. The non-experts selected AVG (1.6 to
2.1) as their favoured method in each case and the ex-
perts chose LOG (1.3). Note that AVG only consid-
ers existing object instances (snapshot) whereas LOG
also considers object instances that are expected to be
created in the future (big picture). This supports the
statement that the experts have the big picture of a
business process in mind and not only consider the
snapshot of the current process. In contrast, the non-
experts are more focused on the snapshot as on the
big picture. Due to this fact, the experts evaluated
MAX (1.9) as the best suitable option, that should be
used when LOG is not available. The non-expert’s
ICSOFT 2024 - 19th International Conference on Software Technologies
320

Table 1: Study results in percent for each question of the three scenarios. Table entries marked with ”-” were not part of the
response options in the study.
Scenario 1 Scenario 2 Scenario 3
Q1 Q2 Q3 Q4 Q5 Q6 Q7 Q1 Q2 Q3 Q1 Q2 Q3
AVG NE 33.3 48.7 35.9 20.5 28.2 20.5 35.9 20.5 25.6 17.9 56.4 48.7 46.2
E 9.5 4.8 9.5 4.8 4.8 4.8 4.8 4.8 9.5 9.5 23.8 28.6 28.6
MIN NE 30.8 17.9 23.1 28.2 15.4 17.9 7.7 12.8 17.9 20.5 - - -
E 4.8 9.5 0 4.8 4.8 4.8 4.8 4.8 4.8 0
MAX NE 7.7 10.3 10.3 10.3 7.7 7.7 7.7 28.2 25.6 20.5 - - -
E 4.8 4.8 9.5 0 0 0 0 9.5 4.8 4.8 - - -
LOG NE 28.2 23.1 30.8 25.6 33.3 33.3 33.3 38.5 30.8 33.3 41 51.3 48.7
E 81 81 81 85.7 81 85.7 85.7 81 81 85.7 71.4 71.4 71.4
PO NE - - - 15.4 15.4 20.5 12.8 - - 5.1 - - 5.1
E - - - 0 0 0 0 - - 0 - - 0
Table 2: Average position in the ranking for the three given cases. Results are coloured to visualise the better or worse rating
comparing both groups.
Case 1 Case 2 Case 3
AVG MIN MAX LOG PO AVG MIN MAX PO AVG MIN LOG
NE 2.1 3.4 3.0 2.2 4.2 1.8 2.8 2.2 3.3 1.6 2.6 1.8
E 3.0 3.5 2.7 1.3 4.6 2.1 2.5 1.9 3.5 2.2 2.5 1.3
choice of the most appropriate method (AVG) is al-
ways available. Considering the distribution of the av-
erage position, the range of the experts varies largely
(e.g. 1.3 to 4.6 for Case 1). Consequently, most par-
ticipants rank the methods in the same way. In con-
trast, the range of the non-experts is smaller (e.g. 2.1
to 4.2 for Case 1). This indicates that the selected
ranking of the methods differs among the non-experts,
which leads to similar results for different methods.
For example, in Case 1, AVG results in 2.1 and LOG
in 2.2 on average. In the following, the total ranking
for both experts and non-experts are given. Note that
this ranking is the same for all three cases indepen-
dent of non-available methods.
Non-expert: AV G > LOG > MAX > MIN > PO
Expert: LOG > MAX > AVG > MIN > PO
5.4 Training and Language
In total, 45 (69.2%) of the participants took part in
a previous training. In general, no differences could
be found between participants with and without train-
ing. Furthermore, only 14 (21.5%) participants read
the English questionnaire whereas about one quarter
are experts (4 | 28.6%). The distribution of experts
and non-experts regarding the language choice is al-
most identical to their distribution and no differences
could be found in the answers.
5.5 Limitation of the Study
In the first scenario, participants often chose different
methods for the individual questions. However, as the
study progressed, participants increasingly chose only
one or two methods. As the order of the scenarios was
the same for each participant it is unclear whether this
observation is based on a learning progress of the par-
ticipants or on the scenarios themselves. Furthermore,
the scenarios where rather simple to allow for a bet-
ter understanding. However, the transferability of the
results to complex scenarios was not investigated.
6 RELATED WORK
The current research in the field of OCEL (object-
centric event log) (Ghahfarokhi et al., 2021) allows an
event log to be related to multiple objects that means
each row is given by one object and includes, for ex-
ample, its identifier and type of object. Traditionally,
an event log is event-based that means each row in a
table has at least an identifier, an activity, a timestamp,
and related objects. The OCEL is similar to the event
log generated from our PHILharmonicFlows frame-
work. Our approach can be applied to OCEL if the
progress of the individual instances is given. This pre-
condition also exists for object-centric business pro-
Determining the Progress of a Business Object Based on its Object Instances: An Empirical Study
321

cesses, but was already addressed in (Arnold et al.,
2021). In (Gherissi et al., 2022), an approach for pre-
dictive process monitoring based on OCELs is dis-
cussed. In general, this approach improves the ac-
curacy in predicting the next activity and the MAE
(Mean Absolute Error) in time prediction compared
to the conventional event logs by utilising the interac-
tion between objects.
7 SUMMARY AND OUTLOOK
In this paper, two research questions were addressed
to determine the progress of a collection of object in-
stances created in the context of one business object.
Regarding Sub-RQ 1, five possible progress determi-
nation methods were introduced and formally defined.
To address Sub-RQ 2, an empirical study was con-
ducted that investigates the most suitable progress de-
termination method. In this context, progress deter-
mination was considered for three different scenarios.
In addition, a method ranking was created. This rank-
ing helps to decide which progress method will be ex-
ecuted first, and if this method is not an option due to
non-existing conditions (e.g. the event log for LOG)
which is the next favoured. For the evaluation, an ex-
pert group, which comprises the participants with ex-
periences in process modelling and business process
modelling tools, and a non-expert group, consisting
of the remaining participants, are defined. In general,
non-experts have no clearly preferred method as they
prefer both AVG and LOG. The experts agree in all
cases (with more than 70%) and consider LOG to be
the most appropriate. Considering this result, LOG
should be used to determine the progress method.
When the information required by this method is not
available progress determination should be based on
MAX. Finally, if the maximum cardinality is not im-
plemented, AVG should be used.
Future research is needed to provide fully func-
tional progress calculation in a monitoring tool for
object-centric business processes. In addition, the
usability and accuracy of their resulting outcomes
will be tested directly at the monitoring tool by end-
users. For example, a Delphie study with focus on
experts more complex scenarios might provide addi-
tional insight into the usability and human intuition of
progress determination. The run-time behaviour (e.g.
response times) of the individual methods is exam-
ined in order to check their suitability directly in our
monitoring tool. The combination of methods is also
being investigated in order to achieve more precise
progress.
ACKNOWLEDGEMENTS
This work is part of the ProcMape project, funded
by the KMU Innovativ Program of the Federal Min-
istry of Education and Research, Germany (F.No.
01IS23045B).
REFERENCES
Andrews, K., Steinau, S., and Reichert, M. (2021). En-
abling runtime flexibility in data-centric and data-
driven process execution engines. Information Sys-
tems.
Arnold, L., Breitmayer, M., and Reichert, M. (2021). A
one-dimensional kalman filter for real-time progress
prediction in object lifecycle processes. In 2021
IEEE 25th International Enterprise Distributed Ob-
ject Computing Workshop (EDOCW), pages 176–185.
IEEE.
Brace, I. (2018). Questionnaire design: How to plan, struc-
ture and write survey material for effective market re-
search. Kogan Page Publishers.
Ghahfarokhi, A. F., Park, G., Berti, A., and van der Aalst,
W. M. (2021). Ocel: A standard for object-centric
event logs. In European Conference on Advances in
Databases and Information Systems, pages 169–175.
Springer.
Gherissi, W., El Haddad, J., and Grigori, D. (2022). Object-
centric predictive process monitoring. In International
Conference on Service-Oriented Computing, pages
27–39. Springer.
Steinau, S., Andrews, K., and Reichert, M. (2018). The
relational process structure. In Int. Conf. on Ad-
vanced Information Systems Engineering, pages 53–
67. Springer.
Steinau, S., Andrews, K., and Reichert, M. (2021). Coor-
dinating large distributed relational process structures.
Software and Systems Modeling, 20(5):1403–1435.
Wieringa, R. (2014). Design science methodology for infor-
mation systems and software engineering. Springer.
ICSOFT 2024 - 19th International Conference on Software Technologies
322
