
Optimizing Service Placement in Edge-to-Cloud AR/VR Systems Using a
Multi-Objective Genetic Algorithm
Mohammadsadeq G. Herabad
1 a
, Javid Taheri
1,2 b
, Bestoun S. Ahmed
1,3 c
and Calin Curescu
4 d
1
Department of Mathematics and Computer Science, Karlstad University, Karlstad, Sweden
2
School of Electronics, Electrical Engineering and Computer Science, Queen’s University Belfast, Belfast, U.K.
3
Department of Computer Science, Faculty of Electrical Engineering, Czech Technical University, Prague, Czech Republic
4
Ericsson AB, Stockholm, Sweden
Keywords:
Edge-to-Cloud Computing, Service Placement, Multi-Objective Genetic Algorithm, Augmented Reality,
Virtual Reality.
Abstract:
Augmented Reality (AR) and Virtual Reality (VR) systems involve computationally intensive image process-
ing algorithms that can burden end-devices with limited resources, leading to poor performance in provid-
ing low latency services. Edge-to-cloud computing overcomes the limitations of end-devices by offloading
their computations to nearby edge devices or remote cloud servers. Although this proves to be sufficient for
many applications, optimal placement of latency sensitive AR/VR services in edge-to-cloud infrastructures
(to provide desirable service response times and reliability) remain a formidable challenging. To address
this challenge, this paper develops a Multi-Objective Genetic Algorithm (MOGA) to optimize the placement
of AR/VR-based services in multi-tier edge-to-cloud environments. The primary objective of the proposed
MOGA is to minimize the response time of all running services, while maximizing the reliability of the under-
lying system from both software and hardware perspectives. To evaluate its performance, we mathematically
modeled all components and developed a tailor-made simulator to assess its effectiveness on various scales.
MOGA was compared with several heuristics to prove that intuitive solutions, which are usually assumed suf-
ficient, are not efficient enough for the stated problem. The experimental results indicated that MOGA can
significantly reduce the response time of deployed services by an average of 67% on different scales, com-
pared to other heuristic methods. MOGA also ensures reliability of the 97% infrastructure (hardware) and
95% services (software).
1 INTRODUCTION
Augmented Reality (AR) and Virtual Reality (VR)
technologies revolutionise our interaction with the
digital and physical world. Integration of edge and
cloud computing has led to significant progress in
AR and VR systems, allowing low latency data pro-
cessing, which is a crucial consideration in almost all
AR/VR systems (Elawady and Sarhan, 2020).
Edge computing pushes data processing closer
to its source, typically at the network edge, rather
than relying on a centralized cloud server. On the
network’s edge, necessary computational tasks can
a
https://orcid.org/0000-0002-2336-2077
b
https://orcid.org/0000-0001-9194-010X
c
https://orcid.org/0000-0001-9051-7609
d
https://orcid.org/0000-0001-5129-2718
be executed on edge devices and/or nearby edge
servers. While edge computing handles tasks re-
quiring low latency, cloud computing can manage
resource-intensive operations through powerful com-
putational servers in data centers (Ji et al., 2023).
Due to their complementary nature, integrating edge
and cloud computing with AR/VR systems can ad-
dress critical latency requirements, while enhancing
AR/VR experiences by providing robust computa-
tional resources at both layers.
The complexities of real-time multimedia within
AR/VR systems demand more careful consideration
of how computational tasks should be distributed
for execution to achieve minimum latency. This is
an important concern to prevent disruption or de-
lay in visual or interactive elements (Siriwardhana
et al., 2021). Furthermore, infrastructure and service-
related reliability play an important role in providing
Herabad, M., Taheri, J., Ahmed, B. and Curescu, C.
Optimizing Service Placement in Edge-to-Cloud AR/VR Systems Using a Multi-Objective Genetic Algorithm.
DOI: 10.5220/0012715200003711
Paper published under CC license (CC BY-NC-ND 4.0)
In Proceedings of the 14th International Conference on Cloud Computing and Services Science (CLOSER 2024), pages 77-91
ISBN: 978-989-758-701-6; ISSN: 2184-5042
Proceedings Copyright © 2024 by SCITEPRESS – Science and Technology Publications, Lda.
77

a seamless and effective user experience (Dong et al.,
2019; Khaleel, 2022). The hardware components of
the edge-to-cloud infrastructure, from the input de-
vices to the computing nodes and the output devices,
must operate uninterruptedly to provide a smooth ex-
perience. Software running AR/VR services must
also be highly reliable to prevent errors and corrup-
tions that could disrupt the user experience. The sys-
tem becomes even more complex due to heteroge-
neous devices and computing servers coupled with
various communication capacities (Liu et al., 2023a).
To address the above challenges, adopting an op-
timization approach becomes essential to make opti-
mal policies for placing AR/VR services on hetero-
geneous resources throughout the system. The op-
timization approach must determine decisions con-
sidering various factors including, but not limited to,
memory and computing capacity of the nodes, com-
munication characteristics between the nodes, as well
as diverse service/resource (e.g., CPU, memory, disk,
and network) requirements and characteristics related
to required/running services. Therefore, making opti-
mal decisions about the placement of services across
available resources in the edge-to-cloud continuum
can be extremely challenging and, therefore, iden-
tified (proved to be) as an NP-Hard problem (Raju
and Mothku, 2023; Liu et al., 2023b; Huangpeng and
Yahya, 2024).
Although the complexity of edge-to-cloud AR/VR
systems can be studied for various applications and
use cases, this paper, specifically, focuses on an
AR/VR-assisted remote repair/maintenance use case
in industrial sectors, such as those studied in (Fang
et al., 2020). In our use case, developed as part of
a collaborative project with Ericsson, when a mal-
functioning device, within an industrial application,
requires repair and no expert is available on-site, a
nearby technician uses an AR/VR application on their
device to connect with a remote expert. The tech-
nician shares enhanced videos of the malfunctioning
device with the remote expert to solicit their help for
identifying/troubleshooting the instrument, and/or de-
veloping a repair plan accordingly. In this specific use
case, the latency of the AR/VR application plays a vi-
tal role in its functionality as a repairing tool, and thus
the optimal placement of AR/VR services for efficient
offloading of the computations over the network to
meet service requirements (e.g., service level agree-
ments) is essential.
This paper models the problem from a system de-
sign perspective and develops a Multi-Objective Ge-
netic Algorithm (MOGA) to simultaneously address
latency- and reliability-related concerns. The paper
also demonstrates that heuristic algorithms are insuffi-
cient for addressing the complexities of service place-
ment in edge-to-cloud AR/VR systems, thus justify-
ing the use of meta-heuristic methods to achieve op-
timal or near-optimal solutions. We use MOGA be-
cause GA-based algorithms have been proven to be
highly adaptable meta-heuristic algorithms that have
been successfully applied to solve a diverse range of
optimization problems. The capability of GA to han-
dle large-scale problems and its inherent structure for
parallelism also makes it a preferable choice for ad-
dressing the stated problem in this paper. Our contri-
butions in this paper can be highlighted as follows:
• We modelled a multi-tier edge-to-cloud infras-
tructure with the focus on AR/VR systems that
need to support service components with multiple
versions (e.g., different codecs).
• We proposed a multi-objective GA-based service
placement approach to simultaneously minimize
both service response time and maximize infras-
tructure/service reliability.
• We proposed a grid-based fine-tuning procedure
to identify optimal configurations (population
size, crossover rate, etc.) for our MOGA, aim-
ing to achieve a balance between the fitness and
runtime of MOGA.
• We developed a tailor-made simulator to evalu-
ate the performance of MOGA as compared with
other heuristic algorithms. We use multiple met-
rics and explain how/why MOGA provides an op-
timal service placement solution in edge-to-cloud
AR/VR systems.
The remainder of this paper is structured as follows.
Section 2 provides the related work. Section 3 formu-
lates the infrastructure and the service model. Sec-
tion 4 defines the objective function. In Section 5,
our solution is introduced. Section 6 outlines the ex-
perimental setup for simulations and evaluations, pro-
viding an analysis of the results obtained through the
simulations. Finally, Section 7 presents the paper con-
clusion.
2 RELATED WORK
Over the past few years, many approaches were de-
signed to use different techniques for offloading video
streams from end-devices to the near edge devices or
clouds to reduce service delays and service response
time in edge-to-cloud environments (Ren et al., 2021;
Acheampong et al., 2023; Chen et al., 2022; Huang
and Friderikos, 2021). Specifically, the authors of
(Cozzolino et al., 2022) proposed an approach called
CLOSER 2024 - 14th International Conference on Cloud Computing and Services Science
78

Nimbus, which is a multi-objective solution for task
allocation in edge-to-cloud environments. The pri-
mary goal of Nimbus is to minimize the latency of
AR applications by offloading computational tasks
to edge or cloud servers. This work, however, fo-
cuses on simple AR tasks without paying sufficient
attention to the complications associated with multi-
version AR tasks and procedures. Additionally, au-
thors of (Yeganeh et al., 2023) devised an approach
that uses Q-learning to reduce task execution time and
mitigate energy consumption on end-devices by of-
floading computational tasks to edge-nodes. Through
a series of experiments, the authors claimed that their
approach provides a better solution, as compared with
similar algorithms that were implemented in the ar-
ticle in 90% of the cases. The paper addresses the
problem from a general perspective, without explic-
itly focusing on the complexity of video streaming.
Authors of (Mahjoubi et al., 2022b) formulated
service placement as a Mixed-Integer Linear Pro-
gramming (MILP) problem in edge-to-cloud comput-
ing. Subsequently, a single-objective genetic algo-
rithm (Mahjoubi et al., 2022b) and a simulated an-
nealing algorithm (Mahjoubi et al., 2022a) were used
to solve the problem. These works focused on single-
objective algorithms, aiming to minimize the runtime
of the system without addressing other metrics, such
as system reliability, in terms of software and hard-
ware aspects. The authors of (De Souza et al., 2023)
also introduced an approach based on Bee Colony op-
timization to reduce the execution time of the appli-
cation for computational tasks by offloading them to
the edge. The extensive experiments described in the
paper supported the claim that their technique can re-
duce the execution time by 56% when compared with
other heuristics. This work neglected to take into ac-
count the computational capacity of the cloud, par-
ticularly in scenarios with substantial computational
demands. This is because the algorithm primarily fo-
cuses on the resource conditions of end devices and
edge servers to make offloading decisions. The au-
thors of (Fan et al., 2022) presented a collaborative
approach based on the Lyapunov optimization tech-
nique for the placement of services within edge-to-
cloud systems. Although this work demonstrated the
effectiveness of the proposed algorithm in various
scenarios to minimize overall task processing delay
and ensure long-term task queue stability, it focused
on single-objective scenarios where the main objec-
tive is to reduce the system delay. Similarly, the au-
thors of (Wang et al., 2023) formulated service place-
ment as a linear integer programming problem and
proposed a polynomial-time method to make deci-
sions collaboratively among edge nodes and handle
service heterogeneity in the system. This research
focuses on service placement in small-scale scenar-
ios, neglecting to explicitly consider aspects related
to software and hardware reliability.
Besides approaches for single-objective problems,
there were also several works focusing on multi-
objective ones, such as (Abedi et al., 2022; Li
et al., 2022; Lavanya et al., 2020; Madni et al.,
2019). Despite the significant body of research in-
vestigating service placement and offloading strate-
gies within edge-to-cloud computing environments, a
limited portion of these studies consider the complex-
ities of edge-to-cloud AR/VR systems. In fact, many
studies adopted a broad perspective, failing to con-
sider the unique challenges and requirements posed
by the nature of AR/VR workloads. As a result, there
is a notable gap in the literature on approaches that
address the specific characteristics of AR/VR systems
in terms of service response time, hardware reliabil-
ity, and service reliability, specifically in cases where
multiple versions of AR/VR service components (co-
)exits in a platform. This gap deserves further investi-
gation and exploration in this domain, and motivated
us to design algorithms in this article.
3 SYSTEM MODEL
This section presents mathematical models for a
multi-tier infrastructure that hosts AR/VR-based ser-
vices.
3.1 User and Helper Model
We consider a use case where ‘users’ can connect
with remote ‘helpers’ using AR/VR applications.
This connection allows users to consult with remote
helpers (called user-helper pairs) to perform repair or
maintenance tasks on industrial sites.
Both users and helpers have their own devices,
denoted by U = {u
1
, u
2
, ..., u
n
, ..., u
N
} and H =
{h
1
, h
2
, ..., h
m
, ..., h
M
}, respectively. Resources for
users and helpers are modeled as nodes with com-
putation capacity (CC), memory capacity (MM) and
disk capacity (DC), as well as other characteris-
tics such as an Operating System (OS) and a re-
liability score (RS). These characteristics are indi-
cated by u
n
= hCC
n
, MC
n
, DC
n
, OS
n
, RS
n
i and h
m
=
hCC
m
, MC
m
, DC
m
, OS
m
, RS
m
i; we define U
ch
and H
ch
(Equations (1) and (2)) to represent the characteris-
tics of all users and helpers, respectively. We also de-
fine P = {p
1
, p
2
, ..., p
i
, ...p
I
} to show the set of pairs,
where p
i
= hu
n
, h
m
i represents the i
th
pair. Table 1
describes the notation related to the user and helper
Optimizing Service Placement in Edge-to-Cloud AR/VR Systems Using a Multi-Objective Genetic Algorithm
79
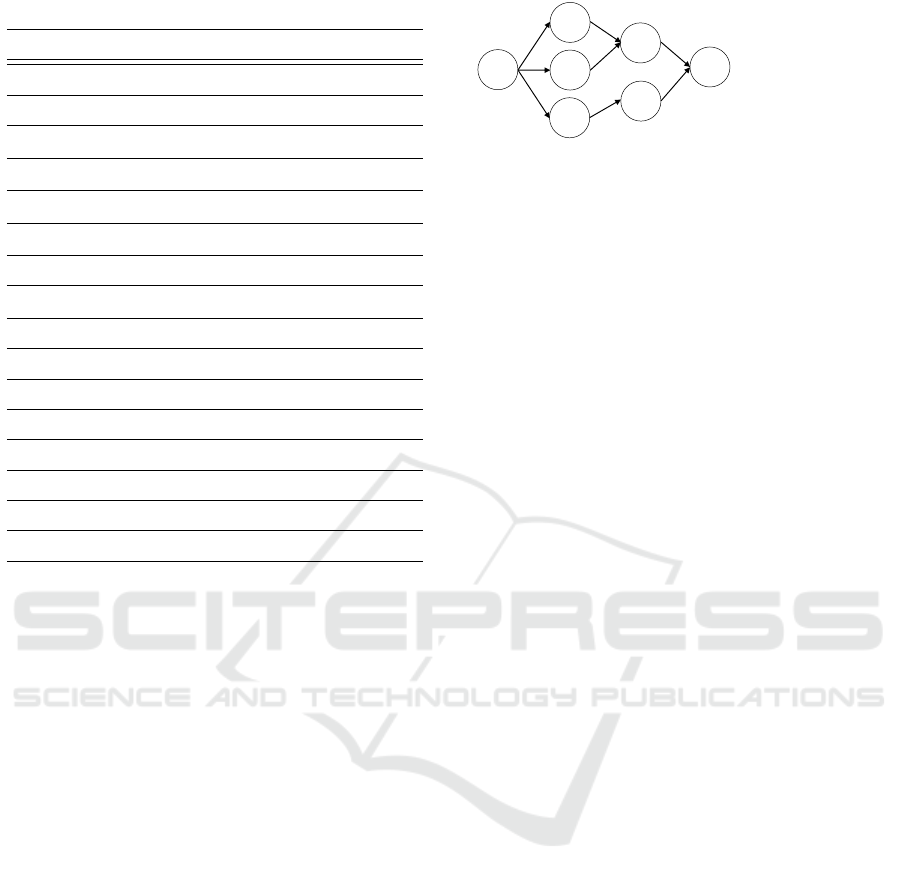
Table 1: Notations related to the user and helper nodes.
Notation Description
U The set of user nodes
H The set of helper nodes
u
n
The n
th
user node
h
m
The m
th
helper node
U
ch
The characteristics of all user nodes
H
ch
The characteristics of all helper nodes
P The set of pairs
p
i
The i
th
pair
N The total number of user nodes
M The total number of helper nodes
I The total number of pairs
CC Computation capacity (MIPS)
MC Memory capacity (GB)
DC Disk capacity (GB)
RS Reliability score
OS Operating system
nodes.
U
ch
=
CC
1
MC
1
DC
1
OS
1
RS
1
CC
2
MC
2
DC
2
OS
2
RS
2
.
.
.
.
.
.
.
.
.
.
.
.
.
.
.
CC
N
MC
N
DC
N
OS
N
RS
N
(1)
H
ch
=
CC
1
MC
1
DC
1
OS
1
RS
1
CC
2
MC
2
DC
2
OS
2
RS
2
.
.
.
.
.
.
.
.
.
.
.
.
.
.
.
CC
M
MC
M
DC
M
OS
M
RS
M
(2)
3.2 Service Model
The system hosts multiple AR/VR services, S =
{S
1
, S
2
, ..., S
x
, ..., S
X
}, where S
x
denotes the service
running through the x
th
user-helper pair. Each ser-
vice, consists of Y service components, where SC
x
y
represents service component y of x
th
user-helper
pair, S
x
= {SC
x
1
, SC
x
2
, ..., SC
x
y
, ..., SC
x
Y
}. Similarly, ev-
ery service component (in a service) has V ver-
sions, where SC
x
y,v
represents version v of the ser-
vice component y of the service belonging to pair
x, SC
x
y
= {SC
x
y,1
, SC
x
y,2
, ..., SC
x
y,v
, ..., SC
x
y,V
}. Each ver-
sion of a service component has specific requirements
(demands) regarding computational power, memory
capacity, and disk space to ensure successful exe-
cution; it also produces/transfers data (with specific
A
B
C
D
E
F
G
Service components
A: Vision capture
B: Object recognition
C: Feature extraction
D: Tracking
E: Data processing
F: Rendering
G: Displaying output
Figure 1: An example DAG for an AR/VR application.
size) to other dependent service components. Fur-
thermore, each version is associated with various
providers, including external providers such as AWS
and Azure, and internal providers such as hosted Ku-
bernetes clusters. There are also attributes for service
components, such as Transcode, Codec Type, and a
reliability score to indicate how they work and how
often they fail. We define SC
x
y
ch
to represent all the re-
source requirements and characteristics of all versions
of a service component (Table 2 shows the notation of
the service model.)
SC
x
y
ch
=
CR
1
MR
1
DR
1
DS
1
PR
1
TC
1
CT
1
RS
1
CR
2
MR
2
DR
2
DS
2
PR
2
TC
2
CT
2
RS
2
.
.
.
.
.
.
.
.
.
.
.
.
.
.
.
.
.
.
.
.
.
.
.
.
CR
V
MR
V
DR
V
DS
V
PR
V
TC
K
CT
V
RS
V
(3)
Where S
x
ch
denotes the resource requirements and
characteristics of all service components belonging to
the x
th
user-helper pair.
S
x
ch
=
h
SC
x
1
ch
SC
x
2
ch
... SC
x
y
ch
... SC
x
Y
ch
i
(4)
The service components of each service are in-
terdependent. Therefore, each service can be repre-
sented by a Directed Acyclic Graph (DAG), where the
vertices in the DAG represent the service components,
and the links between the vertices represent the de-
pendencies between the service components. Figure
1 shows an example of a DAG that represents relation-
ships between the service components of an AR/VR
application. In this paper, an upper binary triangu-
lar matrix is used to model the DAG, where a value
of ‘1’ in the matrix implies a connection between the
corresponding service components.
3.3 Infrastructure and Network Model
We employ a three-tier infrastructure, including ac-
cess points (AP), edge, and cloud tiers. Tier-1 is
defined as a group of APs with specific comput-
ing capabilities. These APs establish direct wire-
less connections with users, acting as network entry
points. Tier-2 comprises a collection of computing
nodes positioned close to (in terms of network acces-
sibility and speed) backbone routers in proximity to
CLOSER 2024 - 14th International Conference on Cloud Computing and Services Science
80
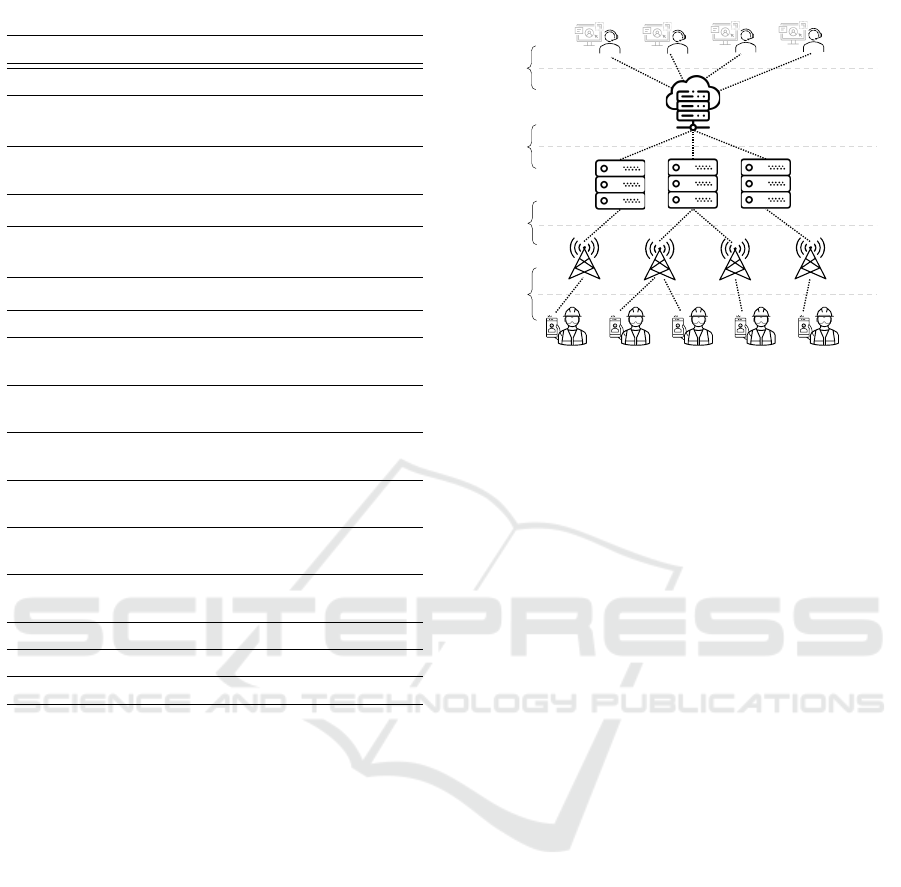
Table 2: Notations related to service model.
Notation Description
S
The set of services
S
x
The service belongs to the x
th
user-helper
pair
S
x
ch
The characteristics of all service compo-
nents of S
x
SC
x
y
The y
th
service component of S
x
SC
x
y,v
The v
th
version of the y
th
service compo-
nent of S
x
SC
x
y
ch
The characteristics of all versions of SC
x
y
X
The total number of services (X = I)
Y
The total number of service components of
each service
V
The total number of service component ver-
sions
CR
Computation requirement of a service com-
ponent (MIPS)
MR
Memory requirement of a service compo-
nent (GB)
DR
Disk requirement of a service component
(GB)
DS
The data size that is required to transfer
(Mb)
PR
Service component provider
TC
Service component transcode
CT
Service component codec type
Tier-1. Nodes within Tier-2 have enhanced compu-
tational and storage capacities. Tier-3 contains the
cloud in our system, providing the highest compu-
tational power and storage capacity among all tiers.
The increase in computing capability in the upper
tiers comes with a rise in data transmission latency.
We assume that the helpers are connected (accessible)
through the cloud (because they are located in remote
places). Figure 2 illustrates the entities in our system.
The computing nodes in the different tiers
have their own device characteristics, denoted as
CN = {CN
1
,CN
2
, ...,CN
k
, ...,CN
K
}, where CN
k
=
hCC
k
, MC
k
, DC
k
, OS
k
, RS
k
i. Moving to the upper tiers,
the memory and computational capacity of comput-
ing nodes increase with respect to CPUs, GPUs,
and RAM, while their network accessibility decreases
(i.e., communicating with them incurs more delay).
We define CN
ch
to represent the characteristics of the
computing nodes within the infrastructure.
User A
User B
User C
User n
…
User nodes
Access points
(Tier 1)
Edge nodes
(Tier 2)
Cloud
(Tier 3)
Helper nodes
Wireless
communications
Wired
communications
Wired
communications
Wired or wireless
communications
Figure 2: Multi-tier edge-to-cloud infrastructure.
CN
ch
=
CC
1
MC
1
DC
1
OS
1
RS
1
CC
2
MC
2
DC
2
OS
2
RS
2
.
.
.
.
.
.
.
.
.
.
.
.
.
.
.
CC
K
MC
K
DC
K
OS
K
RS
K
(5)
To model the network communications among
computing nodes within the infrastructure and be-
tween users, helpers, and computing nodes, we de-
fine CN
L
(Equation 6) to represent the available band-
width (BW) and transmission delays (LD) on each
communication link. For example, BW
2,1
shows the
available bandwidth between computing nodes 2 and
1, similarly, LD
2,1
shows observed delay between
computing nodes 2 and 1. In Equation 6 that repre-
sents CN
L
, we assume that rows and columns from 1
to K are related to computing nodes, columns from
K + 1 to K + N are associated with user nodes, and
columns from K + N + 1 to K + N + M are related
to helper nodes. Here, each element represents avail-
able bandwidth and observed delay (e.g., half of the
ICMP round-trip time between two entities) among
users, helpers, and computing nodes. We use ICMP
round-trip time to consider all potential delays be-
tween two nodes, including those resulting from rout-
ing processes. Since the users are not connected to
each other and the helpers also are not connected to
each other, the number of rows in the matrix is equal
to K. Table 3 describes the notation related to the in-
frastructure and the network model.
CN
L
=
h0, 0i ··· hBW
1,K+N+M
, LD
1,K+N+M
i
hBW
2,1
, LD
2,1
i ··· hBW
2,K+N+M
, LD
2,K+N+M
i
.
.
.
.
.
.
.
.
.
hBW
K,1
, LD
K,1
i ··· hBW
K,K+N+M
, LD
K,K+N+M
i
(6)
Optimizing Service Placement in Edge-to-Cloud AR/VR Systems Using a Multi-Objective Genetic Algorithm
81

Table 3: Notations of the infrastructure and network model.
Notation Description
CN
The set of computing nodes in the infras-
tructure
CN
ch
The resource characteristics of the comput-
ing nodes
CN
L
The characteristics of communication links
among users, helpers, and computing nodes
BW
K,1
The available bandwidth between node K
and node 1 (Mbps)
LD
K,1
The link delay between node K and node 1
(ms)
K The number of total computing nodes
4 OPTIMIZATION MODEL
We adopt a centralized service placement approach,
where service placement algorithms operate in the
cloud to decide on the placement of AR/VR services
across the entire infrastructure. We assume that data
related to services and infrastructure characteristics
are available before making service placement deci-
sions. To formulate an objective function for opti-
mal decision-making and service placement, various
factors are considered, and discussed in the following
subsections.
4.1 Data Transmission Delay Model
The data transmission delay depends on both the net-
work bandwidth and the data size of the service com-
ponents. In addition, other factors, such as jitter, can
affect the transmission time of data. Therefore, we
consider the links’ bandwidth, the data size of the ser-
vice components, and the Round Trip Time (RTT),
which can be measures proactively using ICMP mes-
sages, of the links to calculate transmission delays
(Cozzolino et al., 2022). Equation (7) calculates the
delay of data transmission, where DS
v
shows the re-
quired data size transferred by version v of the service
component and BW shows the bandwidth of the trans-
mission link. Also, we divide the RTT by 2 to account
for the one-way delay of the link.
T D(SC
x
y,v
) =
DS
v
BW
+
RT T
2
(7)
If a service component needs to transfer data to
multiple service components in different places, equa-
tion (7) is calculated separately for each. The nota-
tions related to the transmission delay model are pre-
sented in Table 4.
Table 4: Notations of the transmission delay model.
Notation Description
DS
v
The data size transferred by v
th
version of
the service component
T D(SC
x
y,v
) The transmission delay of SC
x
y,v
BW The link bandwidth
RT T Round trip time of the link
Table 5: Notations related to the execution time model.
Notation Description
CC
k
The computation capacity of computing
node k
CR
v
The required computation of the v
th
version
of SC
x
y
W
v
The waiting time of the v
th
version of SC
x
y
ET (SC
x
y,v
) The execution time of SC
x
y,v
4.2 Execution Time Model
The execution time of a service component is closely
related to the computational capacity of the comput-
ing node and the computational requirements of the
service component. Consequently, the execution time
of a service component is calculated using Equation
(8). CR
v
reflects the total number of instructions re-
quired to execute a version v of the service compo-
nent, and CC
k
reflects the computational capacity of
the computing node k. We assume the computing
nodes support multi-threading and can execute the
service components concurrently. However, a waiting
time is considered in execution time, denoted as W
v
.
This waiting time occurs when a service component
has been placed on the computing node but has not
started its execution on the node yet. The notations
related to the execution time model are described in
Table 5.
ET (SC
x
y,v
) =
CR
v
CC
k
+W
v
(8)
4.3 Response Time Model
To calculate the response time of a service compo-
nent, various delays are considered: provider de-
lays and coding delays, denoted as PD(SC
x
y,v
) and
CD(SC
x
y,v
), respectively. Provider delays are assumed
to have (almost) constant values and can be estimated
through passive measurements on the network. Cod-
ing delays reflect the execution time of specific ver-
sions of encoding and decoding algorithms; they also
CLOSER 2024 - 14th International Conference on Cloud Computing and Services Science
82

Table 6: Notations related to the response time model.
Notation Description
RT (SC
x
y,v
) The response time of SC
x
y,v
RT (S
x
) The response time of S
x
RT (S) The response time of S
PD(SC
x
y,v
) The provider delay of SC
x
y,v
CD(SC
x
y,v
) The encoding and decoding delay of SC
x
y,v
assumed constant and can be obtained from the al-
gorithm providers and/or through multiple runs on a
sample video feed.
The response time for a service component is cal-
culated using Equation (9). Similarly, the total re-
sponse time for a service and all services are obtained
by (10) and (11), respectively. Table 6 describes no-
tations of the response time model.
RT (SC
x
y,v
) = T D(SC
x
y,v
) + ET (SC
x
y,v
)
+ PD(SC
x
y,v
) +CD(SC
x
y,v
) (9)
RT (S
x
) =
Y
∑
y=0,v∈V
RT (SC
x
y,v
) (10)
RT (S) =
X
∑
x=0
RT (S
x
) (11)
4.4 Reliability Model
The reliability of both the nodes and the service com-
ponents is measured by their historical performance.
In particular, researchers of (Moghaddas et al., 2016;
Amini Motlagh et al., 2022; Liu et al., 2015) have in-
troduced methods to measure their reliability scores.
Taking into account the interdependent relationships
between the components of the service, the overall
reliability of the service (software) is calculated us-
ing Equation (12) (Maciel et al., 2021) to determine
the probability of successfully completing a service.
RS(S
x
) =
Y
∏
y=0,v∈V
RS
SC
x
y,v
(12)
The average reliability of all services is calculated
using Equation (13).
RS(S) =
∑
X
x=0
RS(S
x
)
X
(13)
Taking into account the independent relationship
among the computing nodes in the infrastructure, the
total reliability of the computing nodes is represented
Table 7: Notations related to the reliability model.
Notation Description
RS
SC
x
y,v
The reliability score of SC
x
y,v
RS
k
The reliability score of a computing node k
RS(S
x
) The reliability score of S
x
RS(S) The average reliability of all services
RS(CN) The reliability of computing nodes
RS(U) The average reliability score of the users
RS(H) The average reliability score of helpers
RS(P) The total hardware reliability of the pairs
by Equation (14) (Maciel et al., 2021), where RS
k
measures the reliability score of a computing node k.
RS(CN) = 1 − (1 − RS
1
) × · · · ×
(1 − RS
k
) × · · · × (1 − RS
K
) (14)
In a user-helper pair, because the failure of one
part (i.e., user node, helper node or computing nodes)
can adversely affect other parts, the overall hardware
reliability of the pairs is determined using Equation
(15) (Maciel et al., 2021). Table 7 describes the nota-
tions of the reliability model.
RS(P) = RS(CN) · RS(U ) · RS(H) (15)
4.5 Objective Function
Our main objective is to minimize the total response
time of all services, while maximizing both hardware
and software reliability. Therefore, our primary func-
tion is to map service components to heterogeneous
computing nodes, as formulated in Equation (16).
Ob jective f unction :
min RT (S)
max RS(S)
max RS(P)
(16)
subjected to:
∑
y,v∈Y,V
SC
x
y,v
= 1, ∀y (17)
∑
x,y,v∈X,Y,V
res(SC
x
y,v
) < res(CN
k
), ∀k (18)
SC
x
y,v
= u
x
, ∀x (19)
SC
x
y,v
= h
x
, ∀x (20)
The constraint (17) shows that a service com-
ponent within the system must be exclusively as-
signed to a single computing node (no additional
copies of a service component are allowed). The con-
straint (18) reflects that the total resources required
Optimizing Service Placement in Edge-to-Cloud AR/VR Systems Using a Multi-Objective Genetic Algorithm
83

Table 8: Notations related to MOGA parameters.
Notation Description
ps Populations size
cr Crossover rate
mr Mutation rate
ss Tournament selection size
it Number of iterations
f (i)
Fitness of i
th
chromosome
w
1
, w
2
, w
3
A value between 0 and 1 where w
1
+
w
2
+ w
3
= 1
for all service components running on the computing
node (
∑
res(SC
x
y,v
)) must not exceed the available re-
sources of the computing node (res(CN
k
)). The con-
straint (19) shows that each user device is restricted
to execute only service components that are directly
associated with that user. Similarly, the constraint
(20) explicitly requires helper devices to run service
components that belong to that helper node and its
user. Because the formalized objective function be-
longs to the class of problems (NP-Complete) that
cannot be solved in polynomial time, we developed
our approach (MOGA) to efficiently solve this prob-
lem.
5 PROPOSED SOLUTION
(MOGA)
Our solution begins the optimization process by defin-
ing the objective function and generating the initial
population. Each individual in the population is as-
sessed by a fitness function. Genetic operators, in-
cluding crossover and mutation, generate offspring
solutions. The population is then updated by replac-
ing individuals with new offspring using a selection
operator. MOGA also applies a healing operator to
individuals to heal (rather than discard) chromosomes
that partially violate constraints. The algorithm con-
tinues to iterate via these steps until a termination cri-
terion is fulfilled. Table 8 describes MOGA parame-
ters.
5.1 Chromosome Encoding
Each chromosome is represented using an array of
X × Y elements. Each element is considered as a
gene, consisting of a tuple with two values: the first
value indicates the versions of the service components
and the second value is associated with the computing
node running the version of the service component.
Figure 3 represents an example chromosome, where
the element x ×Y
th
shows the Y
th
service component
of service x is using the version 3 and runs on the
computing node 8.
To generate the initial population of chromo-
somes, random versions of service components are
arbitrarily assigned to computing nodes. By introduc-
ing randomness in both the assignment of the versions
and computing nodes, the initial population covers a
broad search space, leading to the exploration of a di-
verse solution space.
5.2 Fitness Function
For each chromosome, three values are calculated: re-
sponse time, infrastructure reliability, and service reli-
ability (discussed in section 4). A lower response time
and higher values for both infrastructure and service
reliabilities indicate a superior chromosome. To this
end, we transform the reliabilities’ values to create a
minimization fitness function. It is important to note
that the reliabilities are constrained within the range
of 0 to 1 (1 ≥ RS(P) > 0, 1 ≥ RS(S) > 0).
After calculating the values, normalization is per-
formed to ensure consistent scaling. Subsequently, a
fitness function is defined using the weighted sum ap-
proach, denoted in Equation (21), where i reflects the
i
th
chromosome and f (i) is a combined fitness func-
tion of the chromosome. Given the importance of
both response time and system reliability in improv-
ing overall service quality, we consider equal weights
for RT (S), RS(P), and RS(S), where w
1
= 0.33, w
2
=
0.33 and w
3
= 0.33 (although other weights can be set
to match other use cases). Because the fitness func-
tion is a minimization function, MOGA operates to
minimize its value, and thus lower fitness values indi-
cate better chromosomes.
f (i) = w
1
· RT (S) + w
2
· (1 − RS(P)) + w
3
· (1 − RS(S))
(21)
5.3 Selection Operator
A tournament strategy is empirically chosen as the
selection operator; Other selection procedures, such
as the roulette wheel, led to the generation of more
populations for convergence. In tournament selection,
a number of chromosomes (ss) are randomly chosen
and then ranked based on their fitness values. The
one with the best fitness value is selected to be part
of the next-generation population. These steps are re-
peated iteratively until the target population size (ps)
is achieved for the next generation.
CLOSER 2024 - 14th International Conference on Cloud Computing and Services Science
84

1×1
…
1×y
…
1×Y
…
x×1
…
x×Y X×1 X×Y
…
…
…
…
…
…
𝑆𝐶
1,5
1
, 𝐶𝑁
2
𝑆𝐶
𝑦,2
1
, 𝐶𝑁
8
𝑆𝐶
𝑌,4
1
, 𝐶𝑁
6
𝑆𝐶
1,5
𝑥
, 𝐶𝑁
9
𝑆𝐶
𝑌,3
𝑥
, 𝐶𝑁
8
𝑆𝐶
1,1
𝑋
, 𝐶𝑁
7
𝑆𝐶
𝑌,2
𝑋
, 𝐶𝑁
5
Figure 3: Chromosome encoding.
5.4 Crossover and Mutation Operators
Crossover operator can be accomplished using vari-
ous techniques such as single-point crossover, multi-
point crossover, and uniform crossover. In this paper,
we empirically employed the single-point crossover
technique, where two chromosomes (called parent
pair) among the population with a crossover rate
(cr) are selected for the crossover operation. The
crossover point is randomly generated for the par-
ent chromosomes. Genes located after the crossover
point on one parent chromosome are exchanged with
genes located before the crossover point in the other
parent chromosome to generate two offspring. Then,
the parent pair is replaced with the offspring in the
population. We use the single-point crossover be-
cause it can make a trade-off between exploitation
and the operator’s run-time, particularly when dealing
with substantial population sizes and extensive search
spaces, making it a preferable choice over other
crossover techniques. Other methods such as multi-
point and uniform crossover also led to more compli-
cated healing processes and consequently more con-
vergence time.
The mutation operator randomly modifies the val-
ues of a gene, allowing the algorithm to explore a
broader search space and preventing premature con-
vergence to local optimum points. In MOGA, each
gene on a chromosome is subjected to mutation with
a mutation rate (mr). We utilize an insertion mutation
technique that involves assigning random valid values
to the selected gene.
5.5 Healing Operator
After crossover and mutation operators, it is in-
evitable that some of the offspring may not satisfy all
the constraints of the objective function. Therefore, in
this paper, a healing operator is designed to guarantee
the satisfaction of all constraints by modifying some
genes on such chromosomes. Since the constraints
(17) are met during the chromosome encoding pro-
cess, the healing operator is designed to satisfy the
constraints (18), (19), and (20). Specifically, the heal-
ing operator examines the chromosome after applying
the crossover and mutation operators. If constraint
(18) is not met for a specific user/helper/computing
node, service components of the node is reassigned
to other nodes with available computing capabilities
until constraint (18) is satisfied. Then it updates the
chromosome based on the new assignment. Simi-
larly, if a service component does not belong to a user-
helper pair but is running on the user or helper node, it
is assigned to other nodes to satisfy the constraints 19
and 20. After the healing operator, the new generation
of chromosomes is determined through the selection
operator.
6 EXPERIMENTAL SETUP
For the evaluation, we implemented a tailor-made
simulator in Node.js to simulate the entire infrastruc-
ture and services. The simulator was implemented to
precisely match our problem, reflecting the desired
scenarios and objectives. The simulator accepts in-
puts in the form of JSON objects/files where the in-
frastructure, the AR/VR service, and the users/helpers
are defined. We designed a client-server architecture
for the simulator, where the client-side sends all in-
formation of a problem instance (the infrastructure,
service characteristics, etc.) to the server-side in the
JSON format. Subsequently, the server employs var-
ious solvers, including MOGA, to determine the op-
timal solution. The results are then sent back to the
client side. The simulator is containerized and, along
with all problem instances in this paper, are made
available for access from a GitHub (Herabad, 2024)
address. WiKis and YAML files are also provided
to facilitate deploying the prepared docker-images on
Kubernetes platforms.
6.1 Other Scheduling Algorithms
To gauge the efficiency of MOGA and compare its re-
sults, we also designed and implemented other heuris-
tic solvers; namely, (1) Task Continuation Affinity
(TCA), (2) Least Required CPU (LRC), (3) Most
Data Size (MDS), (4) Most Reliability (MR), (5)
Most Powerful (MP), and (6) Least Powerful (LP).
TCA executes the first version of the service compo-
nent on the user nodes if sufficient resources are avail-
able. In the cases of inadequate resources, it attempts
with subsequent versions. If there are still insufficient
resources after checking all versions, the service com-
ponent is placed to the upper tier. Similarly, if the
computing nodes in each tier do not have sufficient
resources after checking all versions, the remaining
Optimizing Service Placement in Edge-to-Cloud AR/VR Systems Using a Multi-Objective Genetic Algorithm
85

Table 9: Evaluation scenarios and implementation setup.
Specifications Small-scale Medium-scale Large-scale xLarge-scale
N/M 15/8 50/25 100/50 250/125
No. of CN in Tier-1/2/3 10/8/2 30/18/4 75/60/8 150/100/15
X/Y 15/5 50/5 200/5 250/5
V 5 6 7 8
CR of SC [800 - 3000] (MIPS)
MR of SC [1.5 - 3.3] (GB)
DR of SC [1 - 3] (GB)
CC of U/H [500 - 2200]/[1500 - 2500] (MIPS)
MC of U/H [2 - 4]/[2 - 4] (GB)
DC of U/H [4 - 8]/[4 - 8] (GB)
CC of CN in Tier-1/2/3 [1500 - 2000]/[5000 - 15000]/[15000 - 30000] (MIPS)
MC of CN in Tier-1/2/3 [4 - 8]/[8 - 16]/[32 - 64] (GB)
DC of CN in Tier-1/2/3 [8 - 32]/[32 - 128]/[128 - 256] (GB)
DS of SC [500 - 800] (Mb)
RS of CN/SC [0.7 - 0.9]/[0.9 - 0.99]
Link BW [100 - 500] (Mbps)
Link RTT [500 - 1200] (ms)
service components are placed to the upper tier. LRC
operates similarly to TCA, but only selects the version
of service components that demand the least CPU for
completion. MDS also operates similarly to TCA,
but prioritizes running service components with the
largest data size on user nodes or closer tiers to the
users as long as resources are available. MR runs the
version of the service components with the highest
reliability on the computing node that has the high-
est reliability in the infrastructure. MP runs the least
computationally demanding version on the most pow-
erful node in terms of computational capacity. LP is
the opposite of MP, where the most computationally
demanding version is executed on the least powerful
node.
6.2 Evaluation Scenarios
To evaluate the performance of MOGA, we consider
four evaluation scenarios (i.e., problem instances):
small-scale, medium-scale, large-scale, and xLarge-
scale scenarios. Table 9 shows the specifications of
all scenarios along with the characteristics of their
assumes infrastructure and services. The values for
the infrastructure reflect the scale (properties of all
nodes and networking links), and thus selected care-
fully (based on our discussion with our industry part-
ners) to reflect realistic infrastructures. To pressure all
algorithms and push them to their limits (in terms of
the quality of the solutions and the convergence time),
our simulator then generates the service components
and their requirements so that the total resource ca-
pacity of the service components constitutes 60-70%
of the total resource capacity of the infrastructure.
Additionally, we assume that each helper can provide
assistance to more than one user; that is; a helper can
be part of several user-helper pairs.
6.3 Configuration Setup of MOGA
The configuration of MOGA significantly affects its
performance. We designed a grid-based tuning strat-
egy to find the best configuration for our MOGA. To
this end, we first ran the grid-based tuning for all sce-
narios and investigated the impacts of the parameters
on the performance of MOGA in each scenario.
In MOGA, similar to any other GA-based solver,
the fitness value tends to improve as the popula-
tion size increases, and larger population sizes (al-
most) always yield better solutions. However, run-
ning MOGA for large and extra-large (xLarge) sce-
narios with large population sizes led to unacceptable
(more than 24 hours) convergence times. Our grid-
based tuning procedure is to strike a balance between
MOGA’s quality of solutions and its convergence
time. This is because some solutions (fitness points)
CLOSER 2024 - 14th International Conference on Cloud Computing and Services Science
86
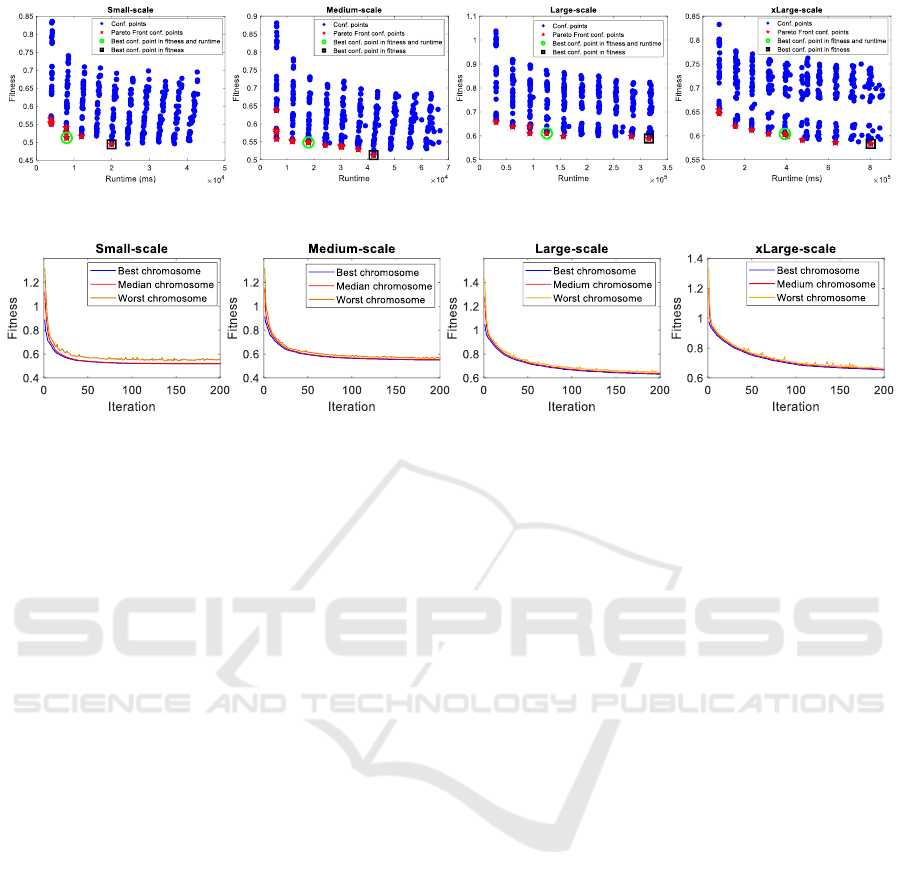
Figure 4: Selecting the best configuration for MOGA in different scales by the Pareto Front-based method.
Figure 5: Convergence process of MOGA in different scales.
produced through smaller population sizes may not
differ much from better solutions found through larger
population sizes at the cost of much higher conver-
gence time. This implies that acceptable (not so op-
timal solutions) can be achieved with smaller pop-
ulation sizes, leading to a significant decrease in
MOGA’s runtime. To this end, we implemented an
algorithm based on the Pareto Front method to select
the configuration that strikes a balance between the
‘fitness value of the best solution’ and the ‘MOGA’s
runtime’.
To start the algorithm, MOGA is run for ev-
ery combination of ‘population-size’, ‘elitism-rate’,
‘cross-over rate’, and ‘mutation rate’ for a very lim-
ited number of scenarios. After each run, (1) the fit-
ness value of the best solution and (2) MOGA’s run-
time are recorded for further processing. Figure 4
shows sample records after collecting all points for
different sizes of problem instances. Using these
points, we aim to find several formulas to relate each
MOGA’s parameter to the characteristics of a prob-
lem instance; for example, finding a formula to select
a reasonable population size for MOGA based on the
number of user-helpers and total number of comput-
ing nodes in an infrastructure. Using such formulas
to set MOGA’s input parameters, we can then ensure
that MOGA will (most likely) find the best solution
(or one very close to it) within a reasonable amount
of time.
To find a point that strikes a balance between the
solution quality and MOGA’s runtime, we first find
the Pareto Front (curve) of these points. To that end,
a configuration (out of all available points, shown in
blue in Figure 4) is randomly selected, and all other
configurations whose fitness and runtime are worse
than the selected point are deleted. This process is re-
peated until no further points can be removed from
the list. The calculated Pareto-front that represent
‘best configurations’ (because no point is strictly bet-
ter than any other point on the same Pareto front) are
then sorted based on their population size, and their
median is identified as the optimal population size
for that scenario. Similarly, the same ‘best configura-
tions’ are then re-sorted based on their crossover rate,
and their median is identified as the optimal crossover
rate for that scenario. The same procedure (re-sorting)
is repeated to select the best elitism and mutation
rates.
Figure 4 illustrates how our Pareto Front-based
approach selects the best configuration to balance fit-
ness and run-time on various scales. Based on the re-
sults in Figure 4, we observe that although the fitness
value of the best configuration points in terms of fit-
ness are relatively superior compared to the best con-
figuration points selected by the Pareto Front-based
method, these superiorities are negligible compared
to the variations in runtime. Specifically, the opti-
mal configuration point selected by the Pareto Front-
based method shows 63%, 57%, 60%, and 53% bet-
ter runtime in small-scale, medium-scale, large-scale
and xLarge-scale scenarios, respectively. On the con-
trary, the best fitness configuration points only show
improvements of 6%, 4%, 3%, and 7% compared to
Pareto Front-based configuration points on all scales,
respectively.
The optimal configurations considered by our
Pareto Front-based method for all scenarios are indi-
cated in Table 10. As shown in Table 10, the optimal
Optimizing Service Placement in Edge-to-Cloud AR/VR Systems Using a Multi-Objective Genetic Algorithm
87

Table 10: Optimal values for MOGA parameters.
Parameter
Small-
scale
Medium-
scale
Large-
scale
xLarge-
scale
ps 200 300 400 500
cr 60% 70% 70% 80%
mr 1% 1% 1% 1%
ss 20 30 40 50
it 50 100 150 200
population size increases slightly with the problem
size. On the contrary, the optimal value of the mu-
tation rate and the selection size are considered 1%
and 10% for all scenarios, respectively. Furthermore,
the crossover rate falls within the range 60% to 80%,
which means that a larger problem size requires a rel-
atively higher crossover rate. Using the information
in Table 10, we can provide an equation to estimate
the optimal value for population size. Equation (22)
estimates the optimal population size in various prob-
lem sizes, where (X × Y ) is the chromosome length,
where N, M, and K represent the total number of user
nodes, helper nodes, and computing nodes, respec-
tively. α, β, and γ are fixed values that we calculated
(using the curve fitting algorithm) α = 0.9, β = 0.16
and γ = 0.16 to estimate the optimal population size.
ps ≈ 100
α
· (X ×Y )
β
· (N + M + K)
γ
(22)
Similarly, the crossover rate (cr) can be estimated
using Equation (23), where c is calculated using
Equation (24) where δ = 0.0003 and ε = 0.04. Since
we identified an optimal crossover rate 60% to 80%
through our fine-tuning process for MOGA, in Equa-
tion (23), we consider specific conditions to set the
crossover rate within the range 60% to 80%.
cr ≈
(
c c 6 0.8
0.8 c > 0.8
(23)
c = 0.6 + (X ×Y ) · δ + (N + M + K)
ε
(24)
Figure 5 shows the MOGA convergence process
in terms of the best, median, and worst chromosomes
of the population in the different scenarios. It is evi-
dent that MOGA converges rapidly on the small and
medium scale, particularly within the first 100 iter-
ations. Therefore, we set the number of MOGA it-
erations to 50 and 100 for small and medium scales
to achieve better run-time efficiency. We also set the
number of MOGA iterations at 150 and 200 for the
large and xLarge scales, respectively, because no no-
table improvements in the fitness value were observed
across these scenarios after 150 and 200 iterations.
As a result, as the problem size increases, MOGA
requires more iterations. We also developed Equa-
tion (25) to estimate sufficient number of iterations
for MOGA, where ζ = 0.9, η = 0.69, and θ = 0.1.
it ≈ 50
ζ
+ (X ×Y )
η
· (N + M + K)
θ
(25)
Figure 5 provides more information on the over-
all performance of the MOGA. We investigated the
median and worst chromosomes to assess the per-
formance of MOGA in terms of exploration and ex-
ploitation. The results show that the median chromo-
somes consistently follow the best chromosomes, in-
dicating that MOGA effectively exploits good solu-
tions. The worst chromosomes also show an improve-
ment over time, indicating that the algorithm main-
tains diversity, while still exploring different regions
of the solution space.
6.4 Response Time Evaluation
Figure 6 (a) compares the total response time
achieved by MOGA with the heuristic algorithms
in our four scenarios. More specifically, MOGA
leads to an average improvement of 71%, 67%, 65%,
and 66% in total response time across small-scale,
medium-scale, large-scale, and xLarge-scale, respec-
tively. Furthermore, Figure 6 (b) compares the av-
erage response time of the algorithms for each ser-
vice component. As depicted in Figure 6 (b), the
average response time of MOGA for a service com-
ponent is approximately 2 seconds on the different
scales, while the heuristic algorithms indicate aver-
age response times above 5 seconds. The obtained
results related to response time show the superior per-
formance of our MOGA compared to the heuristic al-
gorithms and indicate MOGA’s capability (as a meta-
heuristic algorithm) to identify and implement effi-
cient solutions with minimal response times.
6.5 Infrastructure and Service
Reliability Evaluation
Figure 6 (c) illustrates a comparison of the infras-
tructure reliability achieved by both MOGA and the
heuristic algorithms. On average, MOGA shows an
infrastructure reliability close to 98%, whereas the re-
liability achieved by other heuristic algorithms falls
below 91%. Furthermore, Figure 6 (d) compares the
service reliability between MOGA and the heuristic
algorithms. The results in Figure 6 (d) indicate that
MOGA consistently maintains a high level of service
reliability in all scenarios, with an average of 96%. In
addition, a high level of service reliability is observed
for MR in all scenarios, with an average of 97%. As
CLOSER 2024 - 14th International Conference on Cloud Computing and Services Science
88
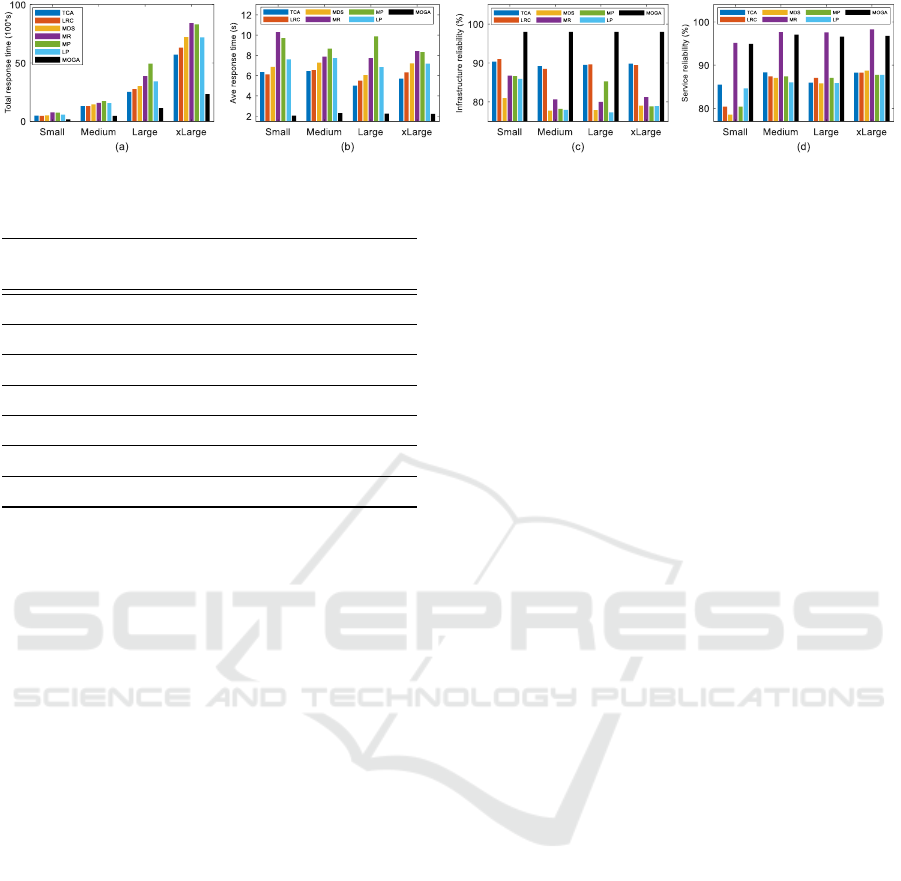
Figure 6: Evaluations based on response time and system reliability.
Table 11: Runtime of algorithms (s).
Algorithm
Small-
scale
Medium-
scale
Large-
scale
xLarge-
scale
TCA 0.0026 0.0109 0.0411 0.0499
LRC 0.0014 0.0026 0.0087 0.0239
MDS 0.0021 0.0317 0.0464 0.0622
MR 0.0015 0.0328 0.0299 0.0899
MP 0.0024 0.0058 0.0301 0.0951
LP 0.0013 0.0351 0.084 0.1075
MOGA 8.73 79.74 530.78 2678.25
mentioned above, MR prioritizes the placement of
service components with higher reliability scores, re-
sulting in high service reliability results. However,
MR faces limitations in providing desirable infras-
tructure reliability and response time. Regarding the
other heuristic algorithms, they provide a service reli-
ability ranging from 75% to 88%.
Based on the findings presented in this subsection,
MOGA provides a high degree of infrastructure reli-
ability and an excellent degree of service reliability.
This maximization in reliability, both in hardware and
software aspects, is vital in minimizing interruptions
arising from reliability-related issues within edge-to-
cloud environments, mainly when it involves the de-
manding requirements of AR/VR applications. The
results clearly illustrate the scalability of MOGA that
consistently maintains a high degree of infrastructure
and service reliability on various scales of the system.
It indicates its adaptability and effectiveness regard-
less of the scale of the system.
6.6 Algorithm Runtime Evaluation
Table 11 presents the runtime of both MOGA and the
heuristic algorithms. As expected, the run-time of
MOGA is higher compared to the heuristic algorithms
due to the nature of its operators. However, we made
a significant reduction in MOGA runtime by optimiz-
ing its configurations.
6.7 Distribution of Service Components
over the Infrastructure
Figure 7 depicts the percentage of distribution of ser-
vice components using the algorithms and provides
detailed information on the operation of the algo-
rithms.
Based on the results of Figure 7, it is clear that
MOGA never assigns service components for execu-
tion on helper nodes. The reason is that the helper
nodes communicate with the users through the cloud
layer. Therefore, it is rational to place service com-
ponents on superior nodes in proximity to user nodes
rather than helper nodes. Additionally, MOGA places
only a minor portion of the service components to
user nodes. In fact, MOGA minimizes the usage
of user nodes due to their constrained computational
and storage capacities. Instead, MOGA prefers to
employ more robust computing nodes in Tier-1 and
Tier-2, which are located near user nodes, to im-
prove performance. Therefore, we can conclude that
MOGA minimizes response time by decreasing the
placement of service components in Tier-3 and the
rare usage of helper and user nodes. This not only
leads to a decrease in the overall transmission time but
also reduces execution time with respect to leverag-
ing more powerful computing nodes at the network’s
edge. However, it is essential to note that MOGA also
optimally selects the appropriate version of the ser-
vice component on the appropriate computing nodes
in each tier, leading to significant improvements both
in response time and system reliability. Although the
selection of nodes in Tiers 2 and 3 seems trivial, and
thus may falsely give the belief that the cost of run-
ning MOGA (or other meta-heuristics for that matter)
is not worth, it is essential to note that other heuris-
tics that mentioned in this paper and roughly deploy
such simplistic procedures could not lead to MOGA’s
high quality answers. This is mainly due to the fact
that simultaneously selecting both computing nodes
and software versions adds extra layers of complexity
that simple heuristics cannot tolerate.
Optimizing Service Placement in Edge-to-Cloud AR/VR Systems Using a Multi-Objective Genetic Algorithm
89
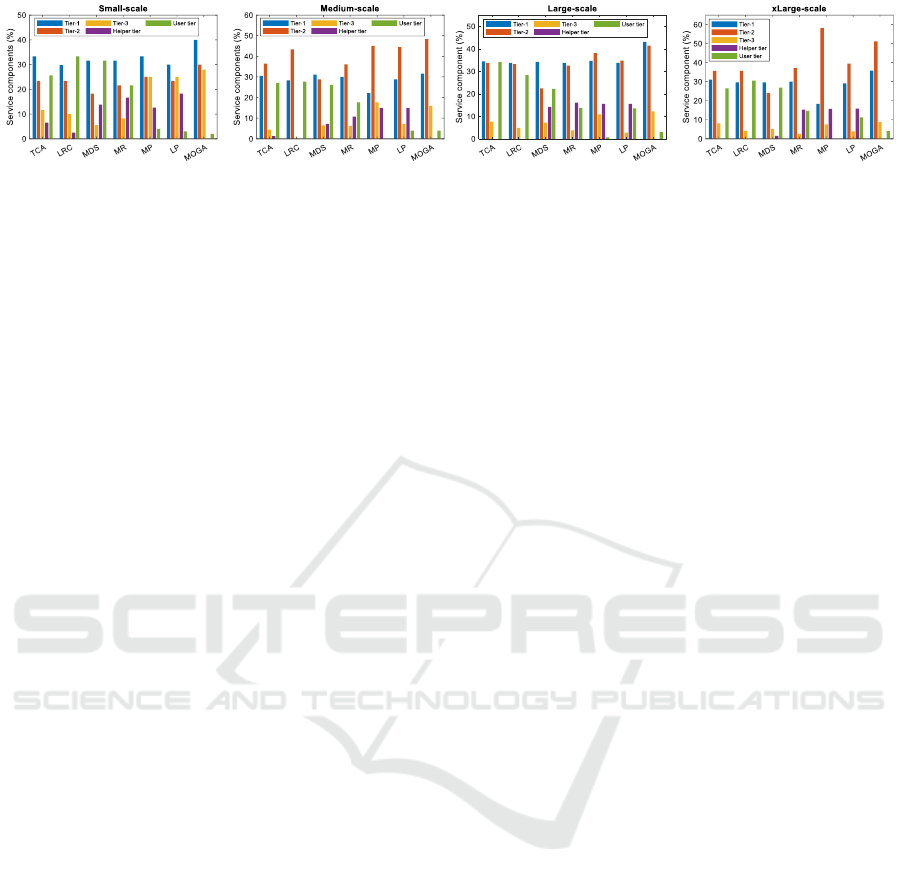
Figure 7: Distribution of service components over the infrastructure in different scales.
7 CONCLUSION
In this paper, we introduce a MOGA for optimal
service placement in edge-to-cloud AR/VR systems.
The primary objectives were to minimize service re-
sponse time, maximize infrastructure reliability, and
achieve the highest service reliability by optimally
placing service components on computing nodes, user
nodes, and helper nodes in the edge-to-cloud infras-
tructure. We devised a robust fine-tuning strategy to
attain optimal configurations for our MOGA in order
to strike a balance between the MOGA’s runtime and
the quality of its solutions. We also implemented a
simulator to validate the proposed MOGA’s effective-
ness. Through extensive simulations and measure-
ments on various scales, we showed the importance
of designing MOGA (as well as other meta-heuristic)
to simultaneously optimize for response time and in-
frastructure and service reliability. We also assessed
the performance of MOGA in terms of the distribution
of service components over the infrastructure, illus-
trating how our MOGA provides an optimal solution
for the placement of AR/VR services compared to the
other rather simple heuristic algorithms.
ACKNOWLEDGEMENTS
Parts of this work have been supported by the Knowl-
edge Foundation of Sweden (KKS).
REFERENCES
Abedi, S., Ghobaei-Arani, M., Khorami, E., and Mo-
jarad, M. (2022). Dynamic resource allocation
using improved firefly optimization algorithm in
cloud environment. Applied Artificial Intelligence,
36(1):2055394.
Acheampong, A., Zhang, Y., and Xu, X. (2023). A paral-
lel computing based model for online binary computa-
tion offloading in mobile edge computing. Computer
Communications, 203:248–261.
Amini Motlagh, A., Movaghar, A., and Rahmani, A. M.
(2022). A new reliability-based task scheduling algo-
rithm in cloud computing. International Journal of
Communication Systems, 35(3):e5022.
Chen, X., Xu, H., Zhang, G., Chen, Y., and Li, R. (2022).
Unsupervised deep learning for binary offloading in
mobile edge computation network. Wireless Personal
Communications, 124(2):1841–1860.
Cozzolino, V., Tonetto, L., Mohan, N., Ding, A. Y., and Ott,
J. (2022). Nimbus: Towards latency-energy efficient
task offloading for ar services. IEEE Transactions on
Cloud Computing.
De Souza, A. B., Rego, P. A. L., Chamola, V., Carneiro, T.,
Rocha, P. H. G., and de Souza, J. N. (2023). A bee
colony-based algorithm for task offloading in vehicu-
lar edge computing. IEEE Systems Journal.
Dong, L., Wu, W., Guo, Q., Satpute, M. N., Znati, T., and
Du, D. Z. (2019). Reliability-aware offloading and
allocation in multilevel edge computing system. IEEE
Transactions on Reliability, 70(1):200–211.
Elawady, M. and Sarhan, A. (2020). Mixed reality applica-
tions powered by ioe and edge computing: A survey.
In Internet of Things—Applications and Future: Pro-
ceedings of ITAF 2019, pages 125–138. Springer.
Fan, W., Zhao, L., Liu, X., Su, Y., Li, S., Wu, F., and
Liu, Y. (2022). Collaborative service placement, task
scheduling, and resource allocation for task offload-
ing with edge-cloud cooperation. IEEE Transactions
on Mobile Computing.
Fang, D., Xu, H., Yang, X., and Bian, M. (2020). An aug-
mented reality-based method for remote collaborative
real-time assistance: from a system perspective. Mo-
bile Networks and Applications, 25:412–425.
Herabad, M. G. (2024). service-placement-simulator.
https://github.com/ms-garshasbi/service-placement-
simulator.
Huang, Z. and Friderikos, V. (2021). Proactive edge cloud
optimization for mobile augmented reality applica-
tions. In 2021 IEEE Wireless Communications and
Networking Conference (WCNC), pages 1–6. IEEE.
Huangpeng, Q. and Yahya, R. O. (2024). Distributed
iot services placement in fog environment using
optimization-based evolutionary approaches. Expert
Systems with Applications, 237:121501.
Ji, T., Wan, X., Guan, X., Zhu, A., and Ye, F. (2023). To-
wards optimal application offloading in heterogeneous
edge-cloud computing. IEEE Transactions on Com-
puters.
Khaleel, M. I. (2022). Multi-objective optimization for sci-
entific workflow scheduling based on performance-to-
CLOSER 2024 - 14th International Conference on Cloud Computing and Services Science
90

power ratio in fog–cloud environments. Simulation
Modelling Practice and Theory, 119:102589.
Lavanya, M., Shanthi, B., and Saravanan, S. (2020). Multi
objective task scheduling algorithm based on sla and
processing time suitable for cloud environment. Com-
puter Communications, 151:183–195.
Li, J., Shang, Y., Qin, M., Yang, Q., Cheng, N., Gao, W.,
and Kwak, K. S. (2022). Multiobjective oriented task
scheduling in heterogeneous mobile edge computing
networks. IEEE Transactions on Vehicular Technol-
ogy, 71(8):8955–8966.
Liu, G., Zeng, Y., Li, D., and Chen, Y. (2015). Sched-
ule length and reliability-oriented multi-objective
scheduling for distributed computing. Soft Comput-
ing, 19:1727–1737.
Liu, J., Yang, P., and Chen, C. (2023a). Intelligent energy-
efficient scheduling with ant colony techniques for
heterogeneous edge computing. Journal of Parallel
and Distributed Computing, 172:84–96.
Liu, Y., Mao, Y., Liu, Z., Ye, F., and Yang, Y. (2023b).
Joint task offloading and resource allocation in het-
erogeneous edge environments. IEEE Transactions on
Mobile Computing.
Maciel, P., Dantas, J., Melo, C., Pereira, P., Oliveira, F.,
Araujo, J., and Matos, R. (2021). A survey on reliabil-
ity and availability modeling of edge, fog, and cloud
computing. Journal of Reliable Intelligent Environ-
ments, pages 1–19.
Madni, S. H. H., Latiff, M. S. A., Ali, J., and Abdulhamid,
S. M. (2019). Multi-objective-oriented cuckoo search
optimization-based resource scheduling algorithm for
clouds. Arabian Journal for Science and Engineering,
44:3585–3602.
Mahjoubi, A., Grinnemo, K.-J., and Taheri, J. (2022a).
An efficient simulated annealing-based task schedul-
ing technique for task offloading in a mobile edge
architecture. In 2022 IEEE 11th International Con-
ference on Cloud Networking (CloudNet), pages 159–
167. IEEE.
Mahjoubi, A., Grinnemo, K.-J., and Taheri, J. (2022b).
Ehga: A genetic algorithm based approach for
scheduling tasks on distributed edge-cloud infrastruc-
tures. In 2022 13th International Conference on Net-
work of the Future (NoF), pages 1–5. IEEE.
Moghaddas, V., Fazeli, M., and Patooghy, A. (2016).
Reliability-oriented scheduling for static-priority real-
time tasks in standby-sparing systems. Microproces-
sors and Microsystems, 45:208–215.
Raju, M. R. and Mothku, S. K. (2023). Delay and energy
aware task scheduling mechanism for fog-enabled
iot applications: A reinforcement learning approach.
Computer Networks, 224:109603.
Ren, J., Gao, L., Wang, X., Ma, M., Qiu, G., Wang, H.,
Zheng, J., and Wang, Z. (2021). Adaptive compu-
tation offloading for mobile augmented reality. Pro-
ceedings of the ACM on Interactive, Mobile, Wearable
and Ubiquitous Technologies, 5(4):1–30.
Siriwardhana, Y., Porambage, P., Liyanage, M., and Yliant-
tila, M. (2021). A survey on mobile augmented reality
with 5g mobile edge computing: Architectures, appli-
cations, and technical aspects. IEEE Communications
Surveys & Tutorials, 23(2):1160–1192.
Wang, L., Deng, X., Gui, J., Chen, X., and Wan, S. (2023).
Microservice-oriented service placement for mobile
edge computing in sustainable internet of vehicles.
IEEE Transactions on Intelligent Transportation Sys-
tems.
Yeganeh, S., Sangar, A. B., and Azizi, S. (2023). A novel
q-learning-based hybrid algorithm for the optimal of-
floading and scheduling in mobile edge computing en-
vironments. Journal of Network and Computer Appli-
cations, 214:103617.
Optimizing Service Placement in Edge-to-Cloud AR/VR Systems Using a Multi-Objective Genetic Algorithm
91
