
Detecting the Impact of Changes in Platelet Demand following the
Implementation of PRT Platelets in Canada
Linden Smith
1
and John Blake
1,2
1
Department of Industrial Engineering, Dalhousie University, Halifax, NS, Canada
2
Centre of Innovation, Canadian Blood Services, Ottawa, ON, Canada
Keywords: Change Point Detection, Synthetic Data, Forecasting.
Abstract: This paper describes tools to detect and estimate demand shifts for platelet products, through inventory
monitoring, following the implementation of pathogen reduction (PR) technology at a pilot site in the
Canadian Blood Services (CBS) network. A Statistical Process Control (SPC) framework was constructed to
detect change points in inventory signals. A discrete event simulation is used to generate synthetic data for
the inventory monitoring process. Both traditional forecasting and machine learning techniques were used to
increase sensitivity to change detection and reduce time to detection by supplying the SPC algorithm with
projected data. Experiments were run on data representative of changes in demand experienced at the pilot
production site. It was found that larger shifts in demand had a higher probability of detection and a lower
time to detection. Changes in demand, with an effect on the system larger than 10%, were almost always
detected. Detection time varies greatly depending on the level of the demand shift. Typically, shifts greater
than 25% have an average detection time of just over a week while shifts of less than 5% have an average
detection time of up to 25 weeks.
1 INTRODUCTION
In all Canadian provinces, excepting Quebec,
Canadian Blood Services is the sole agency
responsible for managing the blood supply chain.
CBS collects, produces, and distributes blood
products to over 400 hospitals. Before being released
for transfusion, products must be tested for the
presence of transmissible diseases and/or bacterial
contamination.
In this paper we consider two blood products,
pooled and apheresis platelets, following the
introduction of technology to reduce bacterial
contamination. In Canada, a unit of pooled platelets
is a combination of buffy coat platelets derived from
five different donors, all of whom have the same
blood type. Apheresis platelets are collected from a
single donor. A single component is removed, while
the remaining components are returned to the donor.
Because platelets must be held at 37
o
C for maximum
clinical efficacy, bacterial contamination, though
rare, is possible. Thus, all platelet products, in
Canada and elsewhere, have a regulated shelf-life. At
the start of this study, platelets had a maximum shelf-
life of 7 days.
At that time, platelet units in Canada were tested
for bacterial contamination, using the BAC-T Alert®
system, a non-destructive testing system that rapidly
incubates an aliquot from production units. The risk
of transfusing a bacterial contaminated unit was
estimated at less than 1 in 1,000 with this technology.
However, CBS introduced Pathogen Reduction
Technology (PRT) for pooled platelet processing to
reduce further the chance of transfusion related
infections. PRT functions by combining a blood
product with a light sensitive compound and exposing
the mixture to ultraviolet light. The process causes
mis-links in the DNA of pathogens in the blood
product, preventing the organism from reproducing
and effectively sterilizing the product (Estcourt et al.,
2018).
While there are significant benefits to PRT
treatment, it is known that treated units have a lower
platelet count than untreated units (Estcourt, et al.,
2017). Thus, there was potential that an increased
number of units used would be required to achieve the
same dose-response in patients who might have
otherwise been transfused with non-PRT platelets.
Additionally, there was uncertainty regarding the
Smith, L. and Blake, J.
Detecting the Impact of Changes in Platelet Demand following the Implementation of PRT Platelets in Canada.
DOI: 10.5220/0012718300003758
Paper published under CC license (CC BY-NC-ND 4.0)
In Proceedings of the 14th International Conference on Simulation and Modeling Methodologies, Technologies and Applications (SIMULTECH 2024), pages 229-236
ISBN: 978-989-758-708-5; ISSN: 2184-2841
Proceedings Copyright © 2024 by SCITEPRESS – Science and Technology Publications, Lda.
229

preference for a pathogen reduced platelet product
amongst prescribing physicians.
1.1 Objective
This study provides a method for evaluating tools to
detect and estimate demand shifts for platelet
products following the implementation of PR
technology at a pilot site in the CBS network.
2 LITERATURE REVIEW
Research on platelet management typically focuses
on reducing waste and shortage. Often, this involves
the selection of an appropriate platelet ordering policy
and/or managing demand. Research in demand
analysis can be categorized by method, including
forecasting, simulation, and integrated Operations
Research (OR) methods.
2.1 Forecasting Research
Forecasting methods improve inventory metrics by
predicting demand. Forecasting methods have been
used throughout the history of research on blood
product inventory management, but recently there has
been interest in forecasting as an application for
machine learning methods.
Silva Filho (2012) used an ARIMA model to
forecast demand across regional supply chain. A tool
was created that could be used by managers in
different regional blood centres. Lestari (Lestari,
Anwar, Nugraha, & Azwar, 2017) used
autoregressive methods to predict demand for
different blood products, but found that a simple
moving average performed best.
Khaldi (2017) applied Artificial Neural Networks
(ANN) to forecast demand for products at a regional
blood centre level. ARIMA models were used as a
benchmark. The performance of the ANN models
was found to far exceed that of the ARIMA models.
However, ARIMA models produced results that were
more interpretable for managers.
Shih (2019) compared time-series methods to
machine learning. ARIMA, Exponential Smoothing
Models, and Holt-Winters were compared with
ANNs and Multiple Regression. Shih found that the
time-series methods performed similarly, while
Multiple Regression outperformed the Artificial
Neural Network. When the time-series methods were
compared to machine learning, the results were
inconclusive, with different time series models and
regressions performing better on some data sets.
2.2 Simulation Methods
Simulation is amongst the most popular technique for
modelling and evaluating blood product inventory.
Atkinson (2012) used a hospital simulation to
determine trade offs between cost and transfusion
efficacy when demand is close to, or greater than,
supply.
Asllani (2014) designed a decision support system
which simulated the collections and demand for
apheresis platelets in a regional blood centre. It was
found that collecting fewer A+ apheresis platelets,
and not collecting on weekends reduced waste by 7%.
Blake (2017) examined the inventory impact of
increasing the shelf-life of platelets. Different
ordering polices were required to reduce waste for
each of the values of shelf-life, but significant
improvements were found for all cases.
2.3 OR Methods
In addition to forecasting and simulation, several
works related to platelet inventory management using
techniques such as stochastic dynamic programming
(SDP), approximate dynamic programming (ADP),
and integer stochastic programming (ISP) can be
found in the literature.
Haijema (2007) created a Markov decision
process formulation for platelet ordering policies at
the regional level. A simulation approach was used to
search for the single best ordering policy. It was
found that the simulation provided near optimal
results in both the downsized and full-scale problems.
Civelek (2015) follows much the same structure as
Haijema (2007) and Van Dijk (2009) with the
addition of a critical level protection policy.
Abdulwahab (2014) used both linear
programming and approximate dynamic
programming to develop a model of a single hospital
and blood bank. The approach was able to find an
optimal solution without downsizing. Similarly,
Gunpinar (2015) used a stochastic integer
programming model to model hospital level
inventory to find an optimal solution.
Guan (2017) analyzed factors in platelet usage at
the hospital level to determine factors influencing
demand. These included units transfused in the
previous days/weeks, census data, and complete
blood count for inpatients.
2.4 Research Summary
Previous work on blood product inventory
management has focussed on decision support with
SIMULTECH 2024 - 14th International Conference on Simulation and Modeling Methodologies, Technologies and Applications
230
the goal of reducing waste and shortage. Inventory
monitoring is an important component of these
models. However, it is performed with the
assumption that the properties of demand do not have
change points. Thus, there is a significant gap in the
research on inventory monitoring itself, and the
transient component of changes in the blood supply
chain.
3
METHOD
In this study we employ Statistical Process Control
(SPC) to monitor inventory at a CBS production
centre following a change in product. A discrete event
simulation is used to generate synthetic data for the
inventory monitoring process, since data
representative of possible demand changes did not
exist. Forecasting methods, using both traditional and
machine learning techniques, are employed to
increase sensitivity to change detection and reduce
time to detection by supplying expected future data
points.
3.1 Control Charts
Standard control charting, was used to compare the
values of points in a series, ordered by time, against
established process properties.
In the problem case, both pooled and apheresis
platelets are available to satisfy patient requirements.
Apheresis units, which are more expensive than
pooled platelets, are reserved for
immunocompromised patients. Apheresis platelets
may be substituted for pooled platelets, but pooled
platelets are not substituted for apheresis demand.
This complicates the problem, since pooled and
apheresis platelets may be affected differently by
changes in demand, and some changes will present
more in one product than the other. To account for
this, both the pooled and apheresis inventory streams
were monitored in this project.
3.2 Data Generation
Since PRT platelets are a new product, no suitable
data existed to evaluate change point detection
methods. Thus, a discrete-event simulation was built
to create inventory data representative of changes in
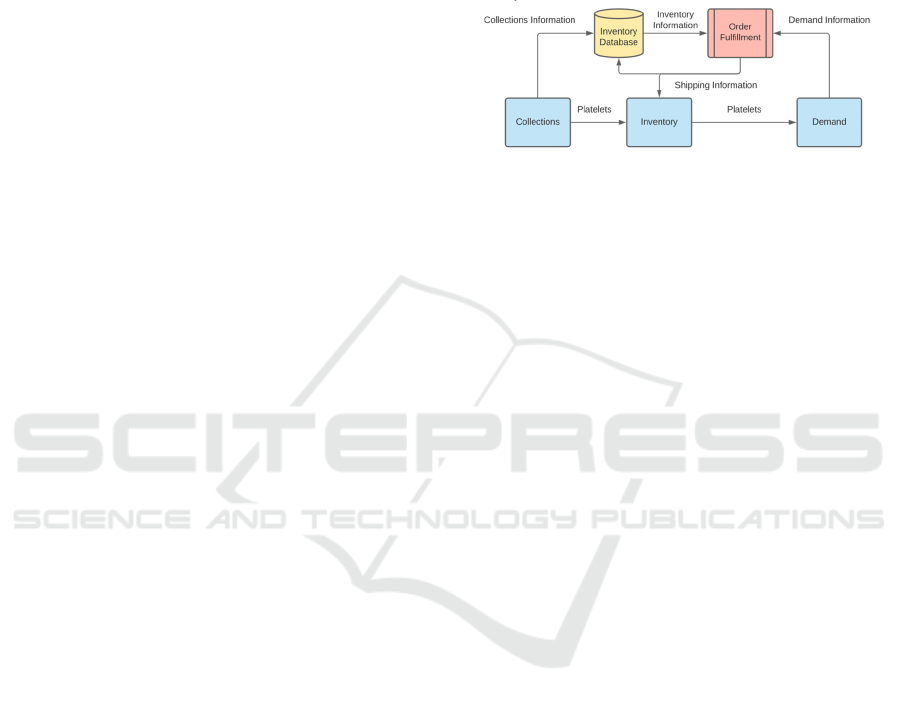
demand. The simulation is comprised of three top-
level components: collections, inventory, and
demand. The relationships between the system
elements are illustrated in Figure 1. Collections are
created daily, according to a Poisson distribution, and
placed in inventory. The shelf-life of collected units
on arrival to inventory is decreased by some number
of days to simulate the time required for production
and testing processes. Demand is created daily, and
inventory is allocated to fill it. Remaining inventory
is aged one day or, if it has no remaining shelf-life,
outdated. The process then repeats for some number
of days.
Figure 1: Inventory simulation framework. The simulation
generates artificial data for the change point detection
algorithm.
The simulation allocates inventory to fill demand
using a matching heuristic based on the steps taken by
CBS decision-makers when filling orders:
1. Exactly match apheresis inventory with
apheresis demand, with priority given to units
with lowest remaining shelf-life.
2. If there is unsatisfied demand for a specific
apheresis unit, substitute a compatible apheresis
unit, with priority given to units with the lowest
remaining shelf-life.
3. Check the shelf-life of apheresis inventory. If
there are any with a remaining shelf-life of 0
days, use them to fill compatible orders for
pooled platelets.
4. Exactly match pooled inventory with pooled
demand, with priority given to units with lowest
remaining shelf-life.
5. If there is unsatisfied demand for pooled
platelets which cannot be exactly matched,
substitute a compatible pooled unit with priority
given to units with the least remaining shelf-life.
Inventory is monitored continuously in the simulation
and a feedback controller is included to maintain a
stable inventory level. The controller reviews recent
collections, including those in inventory, but not
released for shipment, and determines the probability
they will meet demand over a short planning horizon.
If the probability is sufficiently low, collections are
increased in the following weeks. There is, however,
a limit to the effort the controller can exert,
representing the level of adaptability of the system.
Detecting the Impact of Changes in Platelet Demand following the Implementation of PRT Platelets in Canada
231
3.3 Enhancing Change Point Detection
with Local Forecasting
The time required to detect changes in a time series is
constrained by the rate of acquisition of new data. In
this study, data is collected daily, but analyzed
weekly to reduce noise due to day-to-day variation.
To increase the speed and quality of detection,
forecasting was used to supply the change point
detection algorithm with additional (anticipated) data
points. Linear Regression, ARIMA, Local
Regression, Generalized Additive Models (GAM),
and Random Forest methods were all evaluated.
4 DATA
The data used to populate the simulation comes from
a sample from a CBS production site for the 2019
calendar year. Summary statistics for platelet
inventory are shown below in Table 1.
Table 1: Daily inventory summary for the study region.
Blood
Type
Product
Type
Mean Daily
Inventory,
units
Daily
Inventory
Stand. Dev,
units
A+ Poole
d
56.99 16.02
A- Poole
d
4.98 3.28
B+ Poole
d
11.14 4.80
B- Poole
d
0.28 0.55
AB+ Poole
d
0.64 1.37
AB- Poole
d
0.00 0.00
O+ Poole
d
60.63 20.10
O- Poole
d
13.11 7.19
A+ Apheresis 13.00 5.51
A- Apheresis 2.88 2.31
B+ Apheresis 3.64 2.57
B- Apheresis 0.189 0.56
AB+ Apheresis 1.82 1.67
AB- Apheresis 0.14 0.49
O+ Apheresis 15.00 6.32
O- Apheresis 1.03 1.08
Table 2 below displays the inventory summary for
pooled and apheresis platelets.
Table 2: Daily inventory distribution.
Property Pooled
Inventory
Apheresis
Inventory
Mean 147.8 37.7
Standard Deviation
28.4 9.2
5 EXPERIMENTS
5.1 Validation
The simulation model was validated by comparing
simulation output to the parameters of the input data.
The daily inventory was extracted from the input data.
Daily inventory data was collected from the
simulation by using a long-term run of 10,000 days.
Results suggested that the simulation was able to
represent, adequately, the system under study.
(Results excluded for brevity.)
5.2 Synthetic Data
Two sets of data are generated by the simulation in
this study. The first evaluates the false positive
component of the detection accuracy metric, by
creating data with the same statistical properties as
the 2019 data.
The second set of evaluation data assesses the
false negative component of the detection accuracy
metric and the time to detection metric.
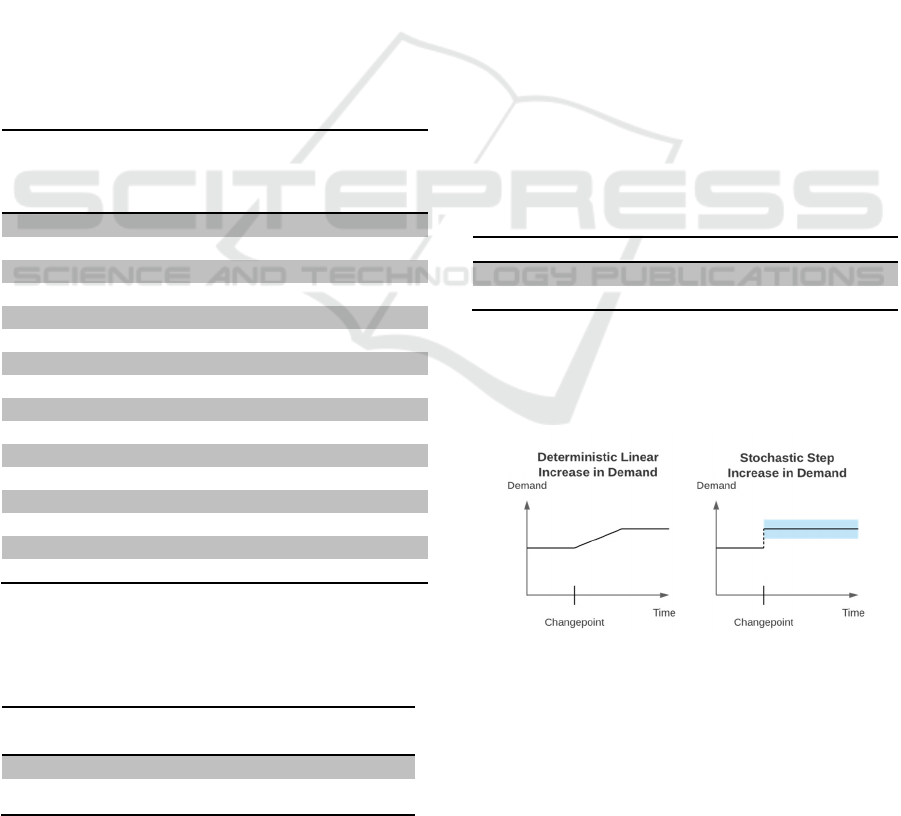
Changes in demand can be described by level,
type of function, and the probability they will assume
a value at a given time. See Table 3.
Table 3: Demand shift parameters.
F(t) Magnitude
step deterministic
linear stochastic
Example changes in demand are depicted below
in Figure 2. Note that linear changes in demand are
implemented as a regular increase across a time
period of four weeks.
Figure 2: Examples of different possible changes in
demand.
There are several ways in which demand may be
affected by the introduction of PRT platelets, and
while not all of them are necessarily equally likely,
access to simulation makes testing worthwhile. As a
SIMULTECH 2024 - 14th International Conference on Simulation and Modeling Methodologies, Technologies and Applications
232

result of PRT platelets replacing BAC-T bacterial
contamination detection there may be:
• An increase in pooled demand
• An increase in apheresis demand
• A transition of demand from pooled to
apheresis
5.3 Evaluation of Forecasting Methods
As noted, local forecasting was used to improve the
time to detection of a change by supplying the
detection algorithm with assumed future data points.
Forecasting methods, listed below, were tested on the
base model data to determine their effect of the
change point detection.
Table 4: Forecasting method performance and impact on
false detection rate.
Method
Base Case
MAPE, %
RMSE, units
of platelets
Base Case
False
Detection
Rate, %
No Forecasting -- -- 3.20
ARIMA 13.14 16.85 3.50
Linear Regressio
n
15.45 20.00 6.50
GAM – Local
Regression
16.64 21.90 31.50
GAM - Splines 14.35 18.57 4.90
Two forecasting accuracy metrics were used to
evaluate forecasting accuracy, along with false
detection rate: Mean Absolute Percentage Error
(MAPE) and Root Mean Squared Error (RMSE).
As can be seen in Table 4 the ARIMA model was
found to perform best according to the forecasting
accuracy metrics. Accordingly, for the case study,
ARIMA methods were used to supply the change
detection algorithm with additional data points.
5.4 Changes in Shelf-Life
After the implementation of PRT platelets, the
regulatory shelf-life of pooled platelets was reduced
from 7 days to 5 days for the period of time
considered in the case study. To account for the
change in approved shelf-life of PRT platelets the
shelf-life of pooled platelets was decreased by two
days in the simulation; apheresis platelets, which
were not pathogen reduced, continued to have a 7-day
shelf-life. Readers should note that subsequent to this
study, the regulatory shelf-life of PRT platelets in
Canada was extended to 7 days.
5.5 Overview of Experiments
Change point detection experiments in this study
were divided into 3 categories: single factor, two
factor, and 2
k
factorial. The first category, single
factor experiments, were used to investigate the effect
of a single type of demand change on inventory. Two
factor experiments follow the same structure but with
two types of demand change present. Finally, the 2
k
factorial experiments examine interaction among
demand change factors.
6 RESULTS
6.1 Single Factor Experiments
To evaluate the performance of detection methods
experiments were conducted on data with only a
single factor change. An example is shown below in
Figure 3 and Figure 4.
Figure 3: Change in demand and its effect on likelihood of
detection.
Figure 3 depicts the percentage of detections
when the level of increase in pooled demand is
changed in a deterministic step. These results indicate
that the chance of signal detection converges to 100%
when demand increases exceed 10%. The grey
shadow in the figure represents the confidence
interval for detection.
Figure 4 shows the mean time to detection for the
same single factor experiment. The mean time to
detection decreases as the level of increase in pooled
demand increases. The mean time to detection for a
2% increase is 23 weeks, while the mean time to
detection for a 20% increase is 6 weeks.
Detecting the Impact of Changes in Platelet Demand following the Implementation of PRT Platelets in Canada
233
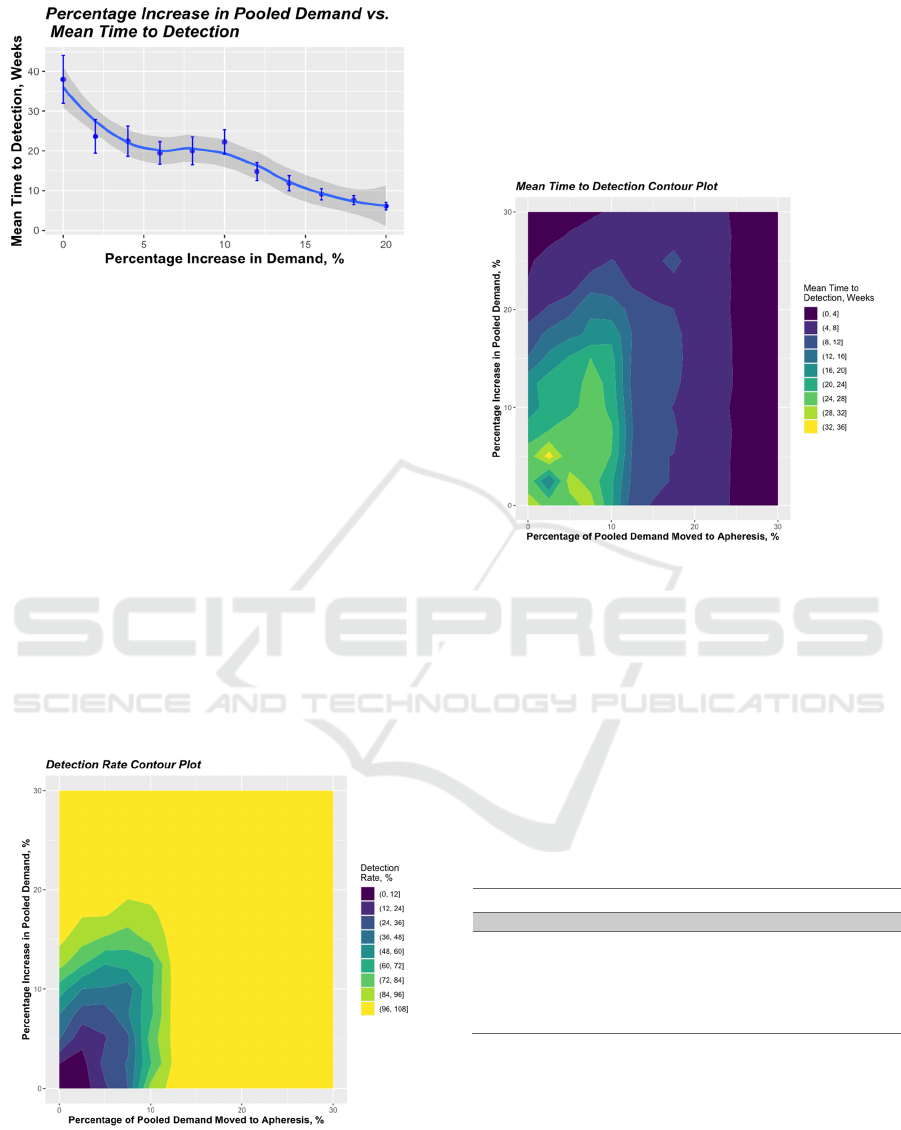
Figure 4: Change in demand and its effect on the time
required to detect the change.
Two Factor Experiments:
A concern for the blood supplier was that an increase
in the demand for pathogen-reduced pooled platelets,
to make up for the lower per unit yield, might be
accompanied by a migration of demand to apheresis
platelets. Thus, a set of experiments was performed to
examine the performance of detection methods to
demand changes exhibiting these patterns.
The detection rates for these experiments are
found in Figure 5. These results represent a step
change in both pooled demand and shift to apheresis
units. The contours indicate that the detection rate
converges to 100% for demand shifts between 10%
and 15%. It can also be observed that the effect of a
migration from pooled to apheresis is detected, at
lower levels, more often than the effect of an increase
in demand for pooled platelets is detected.
Figure 5: Contour plot of detection rate for change in pooled
demand accompanied by a shift from pooled to apheresis
units.
The mean time to detection for the multiple
demand shift experiment is displayed in Figure 6.
While there are anomalies, the mean time to detection
generally decreases as the magnitude of the demand
shift increases. These results are similar to, but less
favourable than, those detected during the single
factor experiments.
Figure 6: Contour plot of detection time for Contour plot of
detection rate for change in pooled demand accompanied
by a shift from pooled to apheresis units.
6.2 Multifactor Experiments
To ascertain the effect of different demand shift
parameters on performance, and the interaction of
factors, the change point detection algorithm was
applied to data with multiple demand factors under
the assumption of a 2
5
-factorial experiment. See
Table 5.
Table 5: Factor descriptions for 2
k
experiments.
Factor
1 2 3 4 5
An
increase
in
pooled
demand
An
increase
in
apheresis
demand
Transfer
of pooled
demand
to
apheresis
Step
increase
or linear
increase
Deterministic
or stochastic
The results of these experiments are displayed in
Figure 7 and Figure 8. Patterns are evident when
evaluating interactions of Factors 1-3 with Factors 4
(step vs. linear increase) and 5 (deterministic vs.
stochastic step). In Figure 7, the red line indicates the
mean percentage detections across experiments in
that group. The chart shows that a linear change, as
opposed to a step change, has a small negative effect
SIMULTECH 2024 - 14th International Conference on Simulation and Modeling Methodologies, Technologies and Applications
234
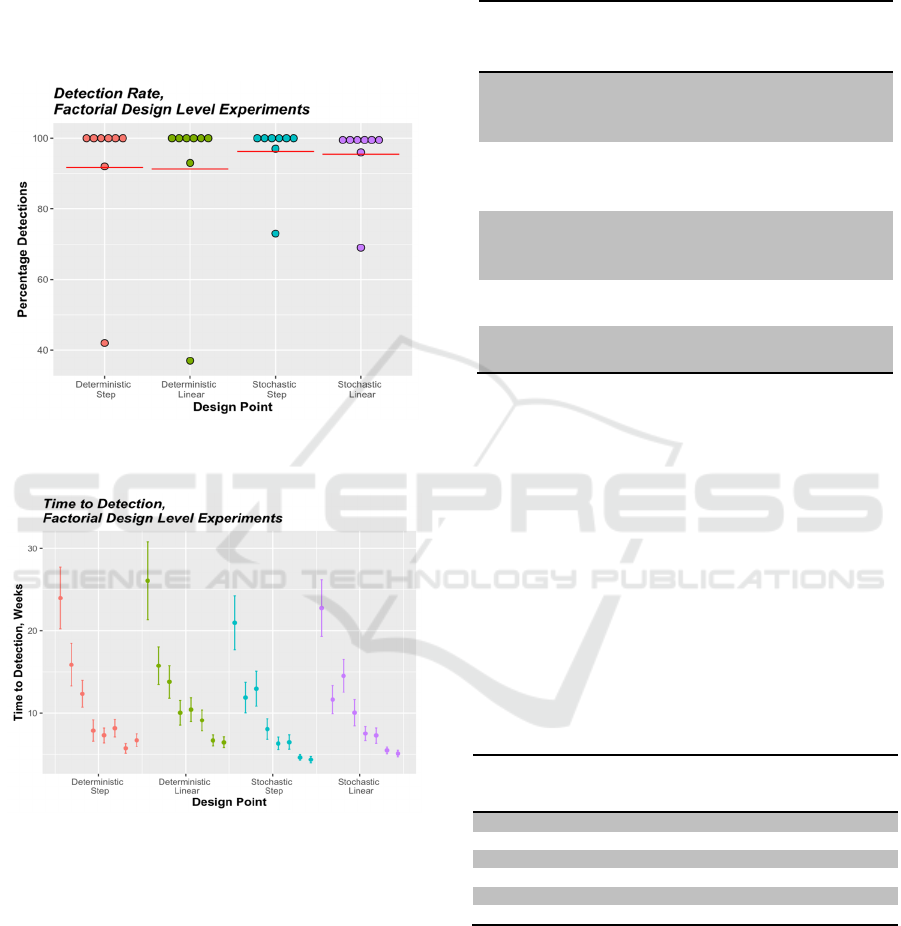
on both the probability of detection and time to
detection. Interestingly, a stochastic change in
demand is both more likely to be detected and is
detected more quickly than a deterministic change.
This may be because variance in an increasing
demand trend leads to more extreme values in
inventory that trigger detection rules in the SPC
method.
Figure 7: Detection rate for experiments factors 4 & 5: Step
vs. linear change and stochastic vs. deterministic change.
Figure 8: Mean time to detection for factorial level
experiments grouped using factors 4 & 5 Step vs. linear
change and stochastic vs. deterministic change.
The effect of a change in each factor on the results
of the 2
5
factorial experiments are shown in Table 6.
These indicate that the presence of all factors, except
a linear change in demand (Factor 4), increase the
detection rate and decrease time to detection. Factor
3, a shift of pooled demand to apheresis, has a
significantly larger effect on detection time than the
other factors. Since apheresis platelets make up only
32% of inventory, a small shift of demand from
pooled has a large effect on apheresis inventory.
Table 6: The effect of 2k experiment factors on detection
rate and time to detection.
Factor Effect on
Detection
Rate, %
Effect on
Detection
Time, Weeks
1 - Pooled
demand
increase
10.25 -3.54
2 – Apheresis
demand
increase
12.13 -4.80
3 – Pooled
demand to
apheresis
12.625 -8.19
4 – Step vs.
linear chan
g
e
-0.625 1.19
5 – Stochastic
vs. deterministic
4.375 -1.64
Evaluation of interaction effects proved that
presence of more than one type of increase generally
increases detection metrics. However, the presence of
a transfer of demand from pooled platelets to
apheresis platelets was found to have a small negative
impact on detection performance. Interaction terms
above 2
nd
order were found to be insignificant.
6.3 Summary
Simulation results, shown in Table 7 give an
overview of estimated performance at different
demand shift levels.
Table 7: Summary of detection performance.
Change to
System, %
Mean
Detection
Rate, %
Mean
Detection
Time, Weeks
Detection
Time CI,
Weeks
1 to 5 72.8 25.12 14.43, 35.81
6 to 10 91.3 15.20 9.86, 20.54
11 to 15 98.4 8.83 5.19, 12.47
16 to 20 100.0 4.25 3.34, 5.16
21 to 25 100.0 1.38 1.26, 1.50
26 to 30 100.0 1.05 1.00, 1.10
Changes up to 5% change have a mean time to
detection of 25 weeks, while changes above 25%
have a mean time to detection of just over 1 week.
The overall detection rate converges to 100% when
the magnitude of change exceeds 10%.
Detecting the Impact of Changes in Platelet Demand following the Implementation of PRT Platelets in Canada
235

7 CONCLUSION
Standard SPC is effective in detecting shifts in
platelet demand. Results show that the key
performance metrics of detection rate and detection
time improve as the magnitude of the shift increases.
Forecast models were developed from established
families of forecasting methods to supplement the
SPC method. The models were evaluated using
historical data, base case runs of the inventory
simulation, as well as data representative of demand
shifts. The best performing method, ARIMA, was
incorporated into the SPC analysis to increase the
speed of data acquisition by providing additional data
points for the algorithm. Our model did not suggest
better performance using machine learning for
forecasting.
Changes in demand, with an effect on the system
larger than 10%, were always detected in our study.
Detection time varies greatly depending on the level
of the demand shift. Typically, shifts greater than
25% have an average detection time of just over a
week while shifts of less than 5% have an average
detection time of 25 weeks.
The results of this paper were used by the blood
agency to set parameters for monitoring the roll out
of PRT platelets in Canada, supplementing their
existing SPC methods.
REFERENCES
Abdulwahab, U., & Wahab, M. I. (2014). Approximate
dynamic programming modeling for a typical blood
platelet bank. Comput. Ind. Eng, 78, 259–270,.
doi:10.1016/j.cie.2014.07.017.
Asllani, A., Culler, E., & Ettkin, L. (2014). A simulation-
based apheresis platelet inventory management model.
Transfusion, 54, 2730–2735,. doi:10.1111/trf.12570.
Atkinson, M. P., Fontaine, M. J., Goodnough, L. T., &
Wein, L. M. (2012). A novel allocation strategy for
blood transfusions: Investigating the tradeoff between
the age and availability of transfused blood.
Transfusion, 52, 108–117,. doi:10.1111/j.1537-
2995.2011.03239.x.
Blake, J. T. (2017). Determining the inventory impact of
extended-shelf-life platelets with a network simulation
model. Transfusion, 57, 3001–3008,.
doi:10.1111/trf.14305.
Civelek, I., Karaesmen, I., & Scheller-Wolf, A. (2015).
Blood platelet inventory management with protection
levels. Eur. J. Oper. Res, 243, 826–838,.
doi:10.1016/j.ejor.2015.01.023.
Estcourt, L., Malouf, R., Hopewell, S., Trivella, M., Doree,
C., Stanworth, S., & Murphy, M. (2017). Platelet
transfusions treated to reduce transfusion-transmitted
infections for the prevention of bleeding in people with
low platelet counts. Cochrane Database of Systematic
Reviews(7).
Guan, L. (2017). Big data modeling to predict platelet usage
and minimize wastage in a tertiary care system. Proc.
Natl. Acad. Sci. U. S. A, 114, 11368–11373,.
doi:10.1073/pnas.1714097114.
Gunpinar, S., & Centeno, G. (2015). Stochastic integer
programming models for reducing wastages and
shortages of blood products at hospitals. Comput. Oper.
Res, 54, 129–141,. doi:10.1016/j.cor.2014.08.017.
Haijema, R., Wal, J., & Dijk, N. M. (2007). Blood platelet
production: Optimization by dynamic programming
and simulation. Comput. Oper. Res, 34, 760–779,.
doi:10.1016/j.cor.2005.03.023.
Khaldi, R., Afia, A. E., Chiheb, R., & Faizi, R. (2017).
Artificial neural network based approach for blood
demand forecasting: Fez transfusion blood center case
study. ACM Int. Conf. Proceeding Ser, Part F1294, 3–
8,. doi:10.1145/3090354.3090415.
Lestari, F., Anwar, U., Nugraha, N., & Azwar, B. (2017).
Forecasting demand in blood supply chain (case study
on blood transfusion unit. Lect. Notes Eng. Comput.
Sci, 2230, 764–767,.
Shih, H., & Rajendran, S. (2019). Comparison of Time
Series Methods and Machine Learning Algorithms for
Forecasting Taiwan Blood Services Foundation’s
Blood Supply. J. Healthc. Eng, 2019.
doi:10.1155/2019/6123745.
Silva Filho, O. C., & Saviano, G. (2012). A decision-
making tool for demand forecasting of blood
components. IFAC Proceedings Volumes, 45(6), 1499-
1504.
Van Dijk, N., Haijema, R., Wal, J., & Sibinga, C. S. (2009).
Blood platelet production: A novel approach for
practical optimization. Transfusion, 49, 411–420,.
doi:10.1111/j.1537-2995.2008.01996.x.
SIMULTECH 2024 - 14th International Conference on Simulation and Modeling Methodologies, Technologies and Applications
236
