
Regression Equations for Preliminary Dimensioning of Axial
Compressor Discs
O. V. Baturin
a
, E. D. Gataullina
b
, E. S. Goryachkin
c
, S. A. Melnikov
d
and Liu Xin
e
Department of Aircraft Engine Theory, Samara National Research University, 34 Moskovskoe Highway,
Samara, Russian Federation
Keywords: Axial Compressor, Compressor Discs, Dimensions, Statistical Analysis, Conceptual Design.
Abstract: In compressor design today, the process of obtaining disc parameters at the first steps is poorly formalised.
This process is often determined by the experience of the designer and is not very predictable. As a result, it
is possible to estimate compressor efficiency during design calculation, but determination of compressor
mass and strength factors is often difficult or is performed using approximate formulas. The authors of the
paper proposed to use regression formulae derived from statistical processing of a database of dimensionless
parameters of more than 20 different gas turbine engines from different countries. Relying on the obtained
regularities, it is possible to get a sketch of the disc in the meridional plane and to estimate its mass and
strength using a semi ring model by means of the design gas-dynamic calculation model. As a result, even at
the first steps of compressor design the engineer has an opportunity to screen out obviously unacceptable
variants and choose the best option not only by efficiency criteria. The selected option will require fewer
refinements in the future, which will reduce the number of iterations in the design process and minimise
design time and costs.
a
https://orcid.org/0000-0002-7674-6496
b
https://orcid.org/0009-0008-0431-6471
c
https://orcid.org/0000-0002-3877-9764
d
https://orcid.org/0000-0002-0170-3846
e
https://orcid.org/0000-0002-3137-8247
1 INTRODUCTION
In all methods for designing axial compressors of
gas turbine engines (GTE) known to the authors the
criterion for optimizing the design at the 1D
calculation stage is their gas-dynamic efficiency
(efficiency). [Belousov A. (2006), Cumpsty A.
(2004), Falck N. (2008), Gallimore S. J. (1999)]
However, as is known, when designing compressors,
they are subject to not only efficiency requirements,
but also weight, strength, design, manufacturability,
etc. [Inozemtsev A. (2022), Mattingly, J. D. (2002)].
Existing 1D compressor design methods take into
account other criteria, usually at the level of size
limitations and statistical dependencies, which is not
enough for a reliable assessment of these criteria.
For this reason, a proposal was made to generate
sketches of the discs in the first (rough)
approximation for the compressor flow path variants
obtained in the design calculation. The known shape
of discs will allow not only to estimate their mass
more accurately, but also to carry out a simplified
assessment of strength criteria using a semi ring
model. Thus, during the initial design steps, the
designer will receive not only the gas-dynamic
properties of the compressor together with the flow
path shape, but will also be able to estimate their
masses and strength factors quite accurately (more
accurately than existing regression dependencies).
As a result, it is possible to perform multi-criteria
optimisation of compressors at the design step and to
screen out high mass and low reliability (high stress)
options at an early step. This will result in a high
quality variant that will be an excellent starting point
for further 3D calculations, reducing the number of
necessary calculations performed with high-level
models that require a large amount of computation
time and computational resources.
Baturin, O., Gataullina, E., Goryachkin, E., Melnikov, S. and Xin, L.
Regression Equations for Preliminary Dimensioning of Axial Compressor Discs.
DOI: 10.5220/0012718800003758
Paper published under CC license (CC BY-NC-ND 4.0)
In Proceedings of the 14th International Conference on Simulation and Modeling Methodologies, Technologies and Applications (SIMULTECH 2024), pages 237-241
ISBN: 978-989-758-708-5; ISSN: 2184-2841
Proceedings Copyright © 2024 by SCITEPRESS – Science and Technology Publications, Lda.
237
2 A DATABASE OF EXISTING
COMPRESSOR DISCS
Information search in available technical
publications did not reveal any formal
recommendations on forming the compressor disc
geometry in the first approximation. For this reason,
it was decided, relying on the existing designs of
high-pressure compressors of gas turbine engine, to
obtain regression dependences, with the help of
which it is possible to obtain the expected shape of
the disc in the first approximation. In the following
steps, this shape will be refined to reduce mass and
stresses. However, even the first approximation
discs (based on statistical data) will help to screen
out obviously unacceptable compressor designs.
To obtain regression dependencies for disc shape
calculation, a database of GTEs of different
generations, design firms, types and purposes was
formed. The database was created by measuring
quality drawings - meridional cross-sections of
GTEs, obtained from reliable sources (usually
directly from partner engine-building enterprises,
reference books and operational literature), the
quality of which is not questionable. A total of 27
gas turbine engines from various countries designed
over the last 40 years were reviewed (including
recent models such as PW1100, Leap GE NX, etc.).
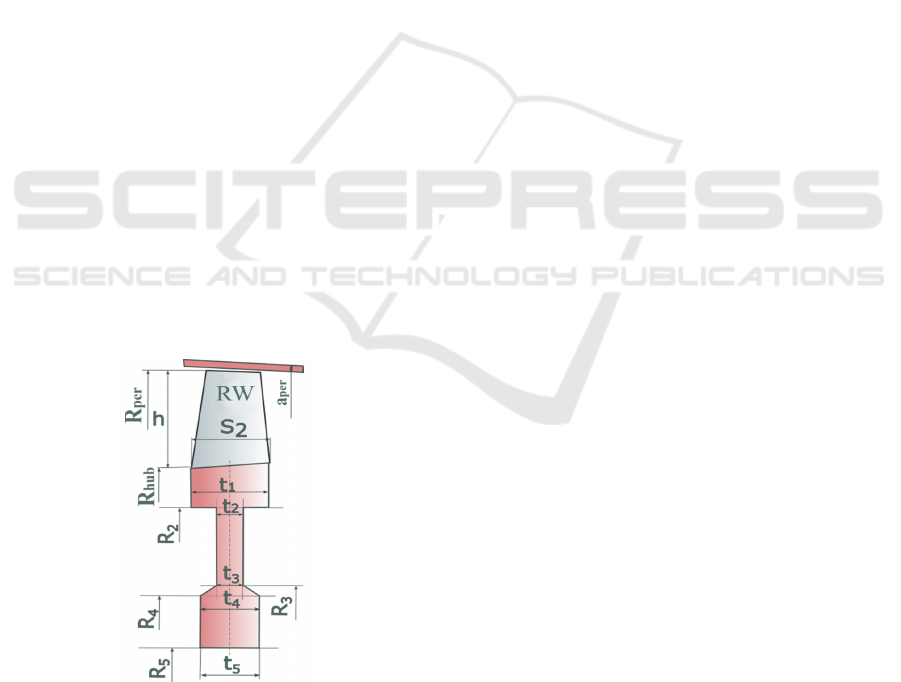
Based on the analysis of available GTE
compressor drawings, a generalized disc shape was
determined (Figure 1) and the dimensions whose
statistical information was to be collected were
outlined.
Figure 1: Principal generalized diagram of an axial
compressor disc with main dimensions.
The disc dimensions shown in Figure 1 were
measured and then disproportioned. The axial and
diametral dimensions of the discs were related to the
axial chord of the RW blades (S
2
), characteristic
diameters (hub diameter R
hub
, middle R
mid,
peripheral
diameter
R
per
) and blade heights h. (a total of 11
dimensional and 20 dimensionless parameters).
In the future it is planned to expand this database
and to refine the obtained regression equations.
3 DISC SHAPE DEPENDENCIES
The regression dependencies for determining the
main dimensions of discs (indicated in Figure 1)
were searched in the following sequence:
1. All parameters (mostly dimensionless) that can
influence the value of the size of interest were
collected in a single table. This included both
universal parameters that are likely to influence
any size (stage number, relative hub diameter
(R
hub
/R
к
) etc.) and size-specific parameters
(e.g., dimensions of neighboring elements) in
all possible combinations.
This creates a table of possible dimensionless
parameters with probable influencing factors.
2. For the generated table the preliminary data
cleaning from the values falling out of the
general array is carried out. Their occurrence
can be caused by errors in the measurement of
the prototype, data input into the database, as
well as by the unusual design of the measured
sample. To screen out the "uncharacteristic"
values, the mathematical expectation of the
parameter (arithmetic mean) X and its standard
deviation σ, Walpole, R., Montgomery, D.
(2012), were determined for each data column
in the table formed in step 1. All points whose
values were outside the range (X±2σ) were
excluded from consideration. On average, no
more than 5% of the points in each column
were rejected. Often a point was out of the
sample range for several parameters.
3. Correlation analysis was performed for the pre-
cleaned data set. Using the Excel data analysis
package, pairwise calculation of statistical
correlation of all parameters of the array is
carried out, Montgomery, D. (2012).
Correlation shows to what extent one value
systematically changes when another or several
others differ. If the compared pair of
parameters is statistically interrelated, the
correlation coefficient tends to 1. If two
quantities are independent, the correlation
coefficient approaches 0.
SIMULTECH 2024 - 14th International Conference on Simulation and Modeling Methodologies, Technologies and Applications
238
4. Using the Excel data analysis package, a
linear regression equation was found for the
parameters pre-selected in step 3:
𝑦=𝑎
+𝑏
∙𝑥
+𝑏
∙𝑥
+⋯+𝑏
∙𝑥
For some parameters we also considered non-
linear regression equations such as:
𝑦=𝑎
+𝑏
∙𝑥
+⋯+𝑏
∙𝑥
+𝑏
∙𝑥
∙𝑥
+
𝑏
∙𝑥
∙𝑥
+⋯+𝑏
∙𝑥
∙𝑥
The values of the coefficients were found using
the Excel data analysis package and the parameters
characterizing the ‘quality’ of the equation were
calculated there. Special attention was paid to the
following parameters, Montgomery, D. (2012):
R
2
- coefficient of determination, which shows to
what extent the calculated model explains the
dependence and changes of the studied parameter - Y
on the studied factors - X. If this parameter tends to 1,
then the obtained equation fully (maximally)
describes the available data array. If R
2
tends to zero,
it means that the equation poorly describes the data
set. Values above 0.6...0.7 are considered acceptable.
P-value - the probability that allows to determine
the significance of the found regression coefficient.
In cases where P>0.05, the coefficient can be
considered zero, which means that the corresponding
independent variable does not affect the dependent
variable. In other words, this parameter should be
less than 0.05 and tends to zero. This coefficient was
determined for each coefficient.
F is the observed (empirical) value of the F-
statistic, by which the hypothesis of equality of all
model coefficients to zero simultaneously is tested.
F significance is a theoretical probability that under
the hypothesis that all model coefficients are equal
to zero simultaneously, the F-statistic is greater than
the empirical value of F. This parameter should tend
to zero.
Regression coefficients and values of the above
regression parameters were found for the variables
pre-selected in step 3. If the value of parameter P
was 0.05, it was excluded from consideration. At
first, the variables with the highest P value were
excluded, then the search for coefficients and
parameters was repeated. The variables with the
largest P value were removed again and the process
was repeated until P was reduced to the required
level. At the same time, special attention was paid to
the value of R
2
. It had to be maximized. Thus, by
varying all possible combinations of Y and
influencing variables, the equations that had the
maximum value of R
2
and minimum P for all
coefficients were found. If the values of regression
coefficients with acceptable statistical parameters
were not found for the linear regression equation, the
values of coefficients of nonlinear regression
equations were searched using a similar algorithm.
Using the equations found, the values of the
parameters of interest were calculated from the
database values and the calculated values were
compared with the real database parameters. As a
result of the comparison, the mean and maximum
error values of the available data set were estimated.
These values also helped in the selection of
equations. Obviously, the calculation errors using
the equations found should be as small as possible.
4 RESULTS AND DISCUSSION
When deriving the formulae, the following
assumptions were made for simplification: t
1
=S
2
;
t
2
-=t
3
; t
4
=t
5
(Figure 1). These assumptions are made
to reduce the number of variables. It should also be
noted that such a simplification is justified due to the
fact that the article deals with the initial stages of
design, and it is important to obtain a disk shape
close to reality with a minimum number of initial
data available at this stage. The obtained regression
equations for calculating axial dimensions of axial
compressor flow path and their statistical parameters
are given in Table 1.
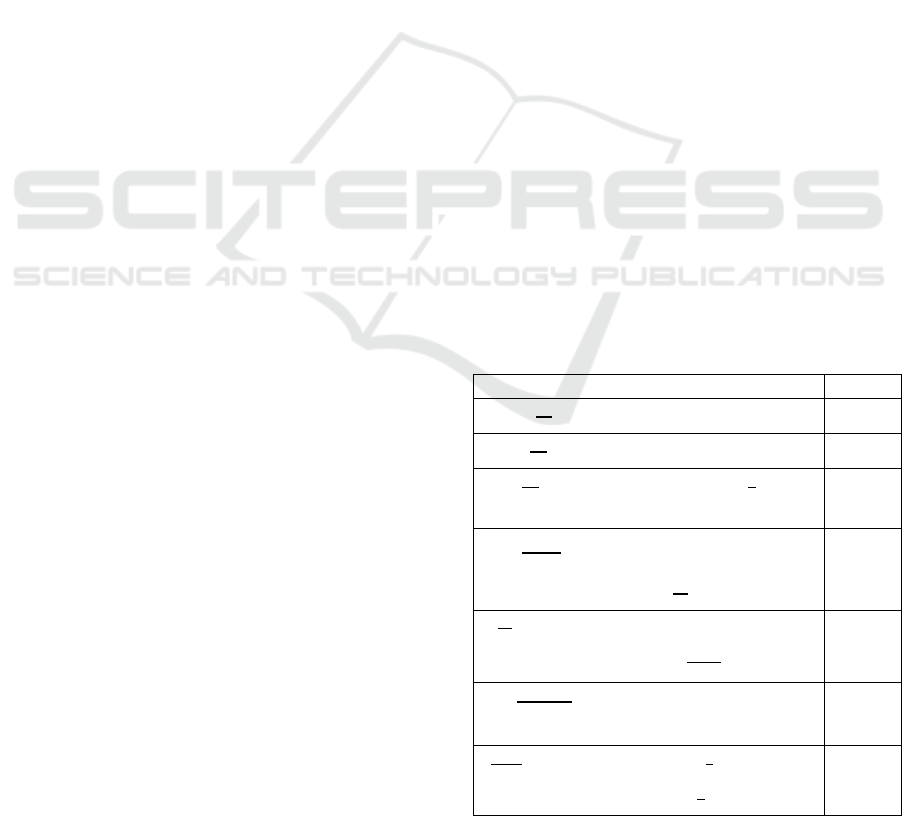
Table 1: Obtained regression formulas for calculating
axial compressor disc sizes.
Formula R
2
= −4.9428 + 8.8525 ∙ 𝑑
̅
0.4873
= −7.0514 + 12.0374 · 𝑑
̅
0.6319
= −14.1513 + 4,8883 ·
+
21.1433 · 𝑑
̅
0.8732
𝑡
𝑅
= 0.0976 − 0.1089 · 𝑑
̅
+
0.027 ·
0.5346
= −2.015 + 0.0854 · 𝑖 + 2.3505 ·
𝑑
̅
+ 4.1073 ·
0.5325
= 0.5579 − 0.0141 · 𝑖 −
0.2887 · 𝑑
̅
0.4619
= 0.0308 − 0.1831 ·
− 0.0096 ·
𝑑
̅
· 𝑖 + 0.4103 ·
·𝑑
̅
0.7186
Regression Equations for Preliminary Dimensioning of Axial Compressor Discs
239
To check the adequacy of the found regression
equations, they were used to calculate the
dimensions of high-pressure compressor discs of
some engines from the database. From engine
drawings the dimensions of flow paths were taken
and then using the found formulas the disc sizes are
calculated. Comparison of original and calculated
shapes of compressor discs is shown in Figures 2-3.
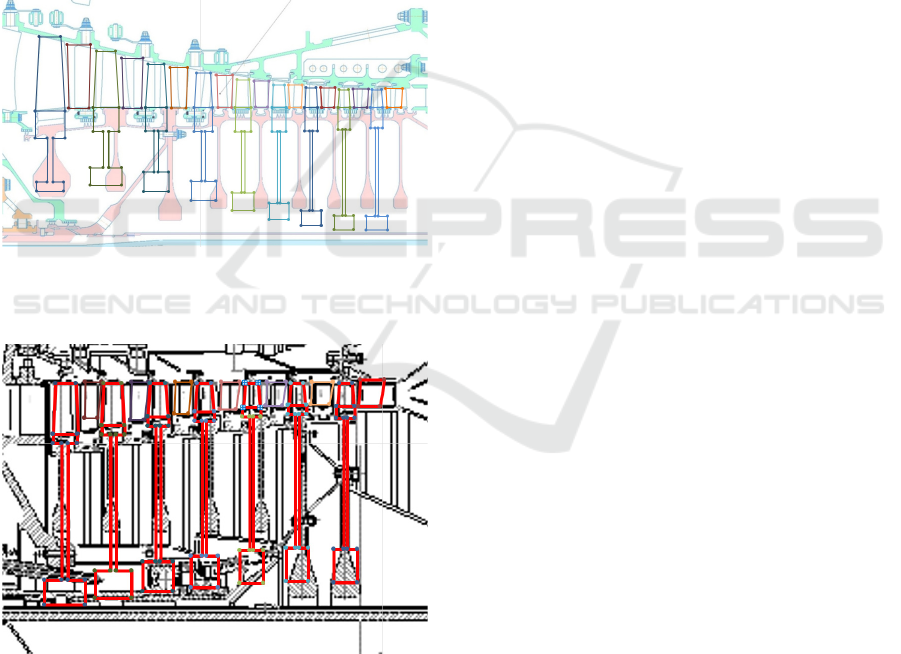
As can be seen from the results shown in
Figures 2 and 3, the developed formulas allow
to determine the expected shapes of axial
compressor discs quite reliably. In the future it
is planned to supplement the database, on the
analysis results of which the equations were
obtained and to carry out thinning of regression
dependences.
Figure 2: Comparison of real dimensions of CFM-56 high-
pressure compressor discs with the results of calculation
by regression equations from Table 1.
Figure 3: Comparison of real dimensions of D-36 high-
pressure compressor discs with the results of calculation
by regression equations from Table 1.
5 CONCLUSIONS
The presented article provides a statistical
analysis of a database collected by the authors
on the sizes of 27 different multi-stage axial
high-pressure compressors of various aircraft
engines. The database contained information
about more than 200 stages. This data array was
subject to statistical analysis, because of which
empirical equations were found that allow, as a
first approximation, to obtain the shape of the
compressor disk at the initial design stages. The
resulting formulas showed good agreement with
real compressor designs. As a result, having the
results of the design calculation of the
compressor, the engineer can quickly obtain the
expected disk shape, which will allow the mass
of the compressor to be assessed and taken into
account during optimization at the early stages
and find an excellent starting point for the
compressor design and its strength analysis. In
the future it is planned to supplement the
database, on the analysis results of which the
equations were obtained and to carry out
thinning of regression dependences.
ACKNOWLEDGMENTS
The research results were obtained as part of the
state task of the Ministry of Education and Science
of Russia "Study of the patterns of working
processes of injection machines based on coupled
mathematical models" (Project FSSS-2024-0015).
REFERENCES
Belousov, A., Musatkin, N., Radko, V. and Kuzmichev, V.
(2006). Design Thermal and Gas-Dynamic
Calculation of the Basic Parameters of Aviation Blade
Machineries (in Russian). Samara: Samara State
Aerospace University Press.
Cumpsty, A. (2004). Compressor Aerodynamics. Krieger
Publishing Company.
Falck, N. (2008). Thermal Power Engineering Energy
Sources: Axial Flow Compressor Mean Line Design.
Sweden: Lund University.
Gallimore, S. J. (1999). Proc. Instn Mech Engrs Axial-
flow compressor design.
Inozemtsev, A., Nikhamkin, M. and Sandratsky, V.
(2022). Fundamentals of design of aircraft engines
SIMULTECH 2024 - 14th International Conference on Simulation and Modeling Methodologies, Technologies and Applications
240

and power plants. Moscow: Direct-Media. Vol. 1, 2
nd
edition.
Mattingly, J. D., Heiser, W. and Pratt, D. (2002). Aircraft
Engine Design. Second ed Reston VA: American
Institute of Aeronautics and Astronautics.
Walpole, R., Myers, R., Myers, S. and Ye, K. Probability
and Statistics for Engineers and Scientists.
Montgomery, D., Peck, E., Vining, W. G. (2012).
Introduction to Linear Regression Analysis. 5
th
Ed. xvi.
Regression Equations for Preliminary Dimensioning of Axial Compressor Discs
241
