
Diagnosis Automation Using Similarity Analysis:
Application to Industrial Systems
Ivan Orefice
1
, Wissam Mallouli
1
, Ana R. Cavalli
1
, Filip Sebek
2
and Alberto Lizarduy
3
1
Montimage EURL, Paris, France
2
R&D ABB Marine and Ports, V
¨
aster
˚
as, Sweden
2
FAGOR Arrasate S.Coop, Spain
fi
Keywords:
Incident Diagnosis, Root Cause Analysis, Automation, Load Position System, Manufacturing Machinery,
Security.
Abstract:
The paper introduces the MMT-RCA framework, an automated incident diagnosis system crucial for main-
taining security and reliability in complex systems such as ABB’s Load Position Sensor (LPS) and FAGOR’s
remote manufacturing machinery access. Traditional incident response methods often involve time-consuming
and error-prone manual analysis, hindered by limited human expertise. MMT-RCA addresses this challenge
by leveraging similarity analysis techniques. It utilizes historical incident data to create a comprehensive
repository, capturing characteristics and outcomes of past incidents. By employing sophisticated algorithms,
the MMT-RCA framework identifies patterns and correlations among incidents, facilitating the swift identifi-
cation of similar problems and their root causes. To validate its efficacy, the framework underwent real-world
experiments with industrial data from both companies. The results demonstrate the framework’s ability to
accurately diagnose incidents and identify root causes.
1 INTRODUCTION
Ensuring the security and safety of critical industrial
system (Kalam, 2021) is essential to prevent incidents
that can result in significant damage, financial losses,
and potential harm to human lives. In fact, these
systems face various security and safety challenges
that can lead to incidents, making incident diagno-
sis a crucial aspect of their overall protection (Hem-
sley and Fisher, 2018). One of the key challenges is
the complex and evolving nature of threats. Attack-
ers are continuously developing new techniques to ex-
ploit vulnerabilities in industrial systems (Kallel et al.,
2021), necessitating proactive monitoring, threat in-
telligence, and robust incident detection capabilities
(Salazar et al., 2022). Effective incident diagnosis en-
ables the identification of security breaches and helps
determine the root causes of these incidents, allowing
organizations to implement appropriate countermea-
sures and strengthen their security posture.
Another challenge is the detection and diagnosis
of safety incidents within critical industrial systems
(He et al., 2022). Safety incidents can arise from
equipment failures, human errors, procedural viola-
tions, or environmental factors. Identifying the root
causes of safety incidents is crucial to prevent their
recurrence and improve overall safety measures.
Furthermore, the integration of security and
safety incident diagnosis is essential for a compre-
hensive approach to protect critical industrial sys-
tems(Kirkpatrick, 2019). Security and safety inci-
dents are often intertwined and can have cascading
effects on each other. For example, a cyber attack tar-
geting an industrial control system can lead to safety
hazards if critical safety controls are compromised.
Conversely, a safety incident, such as an equipment
malfunction, can create vulnerabilities that can be ex-
ploited by malicious actors. By integrating security
and safety incident diagnosis, organizations can gain
a holistic understanding of incidents, their interde-
pendencies, and the underlying causes, enabling them
to implement appropriate measures (Lanotte et al.,
2023) to address both security and safety concerns ef-
fectively.
In this paper, we propose an automated diagnosis
framework called MMT-RCA a new feature of Mon-
timage Monitoring Tool
1
that aims to leverage sim-
ilarity analysis techniques to enhance the identifica-
1
https://www.montimage.com/products
Orefice, I., Mallouli, W., Cavalli, A., Sebek, F. and Lizarduy, A.
Diagnosis Automation Using Similarity Analysis: Application to Industrial Systems.
DOI: 10.5220/0012719200003753
Paper published under CC license (CC BY-NC-ND 4.0)
In Proceedings of the 19th International Conference on Software Technologies (ICSOFT 2024), pages 331-338
ISBN: 978-989-758-706-1; ISSN: 2184-2833
Proceedings Copyright © 2024 by SCITEPRESS – Science and Technology Publications, Lda.
331

tion of the root causes of incidents within critical in-
dustrial systems. Traditional manual incident analy-
sis processes can be time-consuming and subjective,
relying heavily on the expertise and experience of hu-
man operators. By incorporating similarity analysis
techniques (Black et al., 2019) , the framework aims
to expedite the incident diagnosis process by identify-
ing patterns and correlations among incidents.
Similarity analysis involves comparing the char-
acteristics and outcomes of incidents to identify sim-
ilarities and associations that can help determine the
underlying root causes. This can be achieved through
clustering algorithms that group similar incidents to-
gether based on shared or close metric values. By uti-
lizing historical incident data and real-time monitor-
ing data, the framework can continuously learn and
improve its diagnosis capabilities.
The integration of similarity analysis techniques
in the automated diagnosis framework offers sev-
eral advantages. Firstly, it can significantly reduce
the time required for incident diagnosis, enabling
prompt response and mitigation actions. Secondly,
it helps minimize the subjectivity and biases associ-
ated with manual analysis, providing more objective
and data-driven results. Moreover, by identifying the
root causes of incidents, organizations can implement
targeted remediation strategies, enhance system re-
silience, and proactively address potential vulnerabil-
ities.
The MMT-RCA framework has been applied to
both LPS provided by ABB company
2
and remote
access to manufacturing machinery, a system used
inside FAGOR company
3
, and has yielded interest-
ing results. By leveraging historical incident data and
real-time monitoring data from the LPS and the man-
ufacturing system, the framework successfully iden-
tified patterns and correlations among incidents, en-
abling the prompt identification of root causes. The
application of the framework to both datasets signifi-
cantly reduced the time required for incident diagno-
sis, improving incident response efficiency and over-
all system uptime. These interesting results demon-
strate the effectiveness of the framework in automat-
ing the root cause analysis of incidents within these
two industrial complex contexts.
The paper is organised as follows. Section 2
presents related work to root cause analysis of in-
cident in industrial systems. Section 3 presents the
proposed framework architecture and implementation
details. Furthermore, Section 4 presents its applica-
tion results to LPS system and FAGOR use case. Sec-
tion 5 concludes the paper and present future work.
2
https://global.abb/group/en
3
https://fagorarrasate.com
2 RELATED WORK
There is a significant body of scientific work related
to protecting critical industrial systems (Salazar et al.,
2022) (Kalam, 2021) (Hemsley and Fisher, 2018)
and some of them focused on incidents diagnosis and
root cause analysis. The basic concepts and termi-
nologies related to Root Cause Analysis (RCA) are
defined in the literature.
The authors of (Kiermeier and Feld, 2018) dis-
cuss the challenges of performing root cause analysis
in self-organizing industrial systems (SOIS). These
systems adapt their behaviour dynamically, making
it difficult to establish explicit connections and iden-
tify root causes. The authors present a taxonomy of
possible root causes in SOIS, with a focus on error
sources arising from the online decision-making pro-
cess. They propose backtracking approaches, distin-
guishing between automatable and non-automatable
procedures. For cases where automatable evaluation
is not feasible due to the state space explosion, a vi-
sual analytics solution is proposed. The paper also
includes a proof of concept for an expert-based as-
sessment, demonstrating the necessary functions for
tracing back anomalies in SOIS.
Besides, (Wang et al., 2021) introduces Groot, an
event-graph-based approach for root cause analysis
in large-scale distributed systems. Groot addresses
the challenges posed by microservice architecture, in-
cluding operational complexities, system scale, and
monitoring. It constructs a real-time causality graph
based on events, incorporating various metrics, logs,
and activities for analysis. Groot can be customized
with user-defined events and domain-specific rules,
allowing integration of domain knowledge from site
reliability engineering (SRE) engineers. The paper
demonstrates the usability and effectiveness of Groot
in industrial settings, highlighting its practical appli-
cation and lessons learned. However, the Groot tool
presents some limitations associated with its scalabil-
ity, adaptability to different system architectures, or
potential challenges in integrating real-time data from
distributed environments.
These scientific works contribute to the under-
standing and development of root cause analysis
methodologies in industrial systems, providing valu-
able insights and practical guidance for incident in-
vestigation, prevention, and overall system improve-
ment. In our paper, we propose a generic root cause
analysis solution called MMT-RCA that can extended
to different sectors and can easily be integrated in op-
erational environments due to its modularity.
ICSOFT 2024 - 19th International Conference on Software Technologies
332
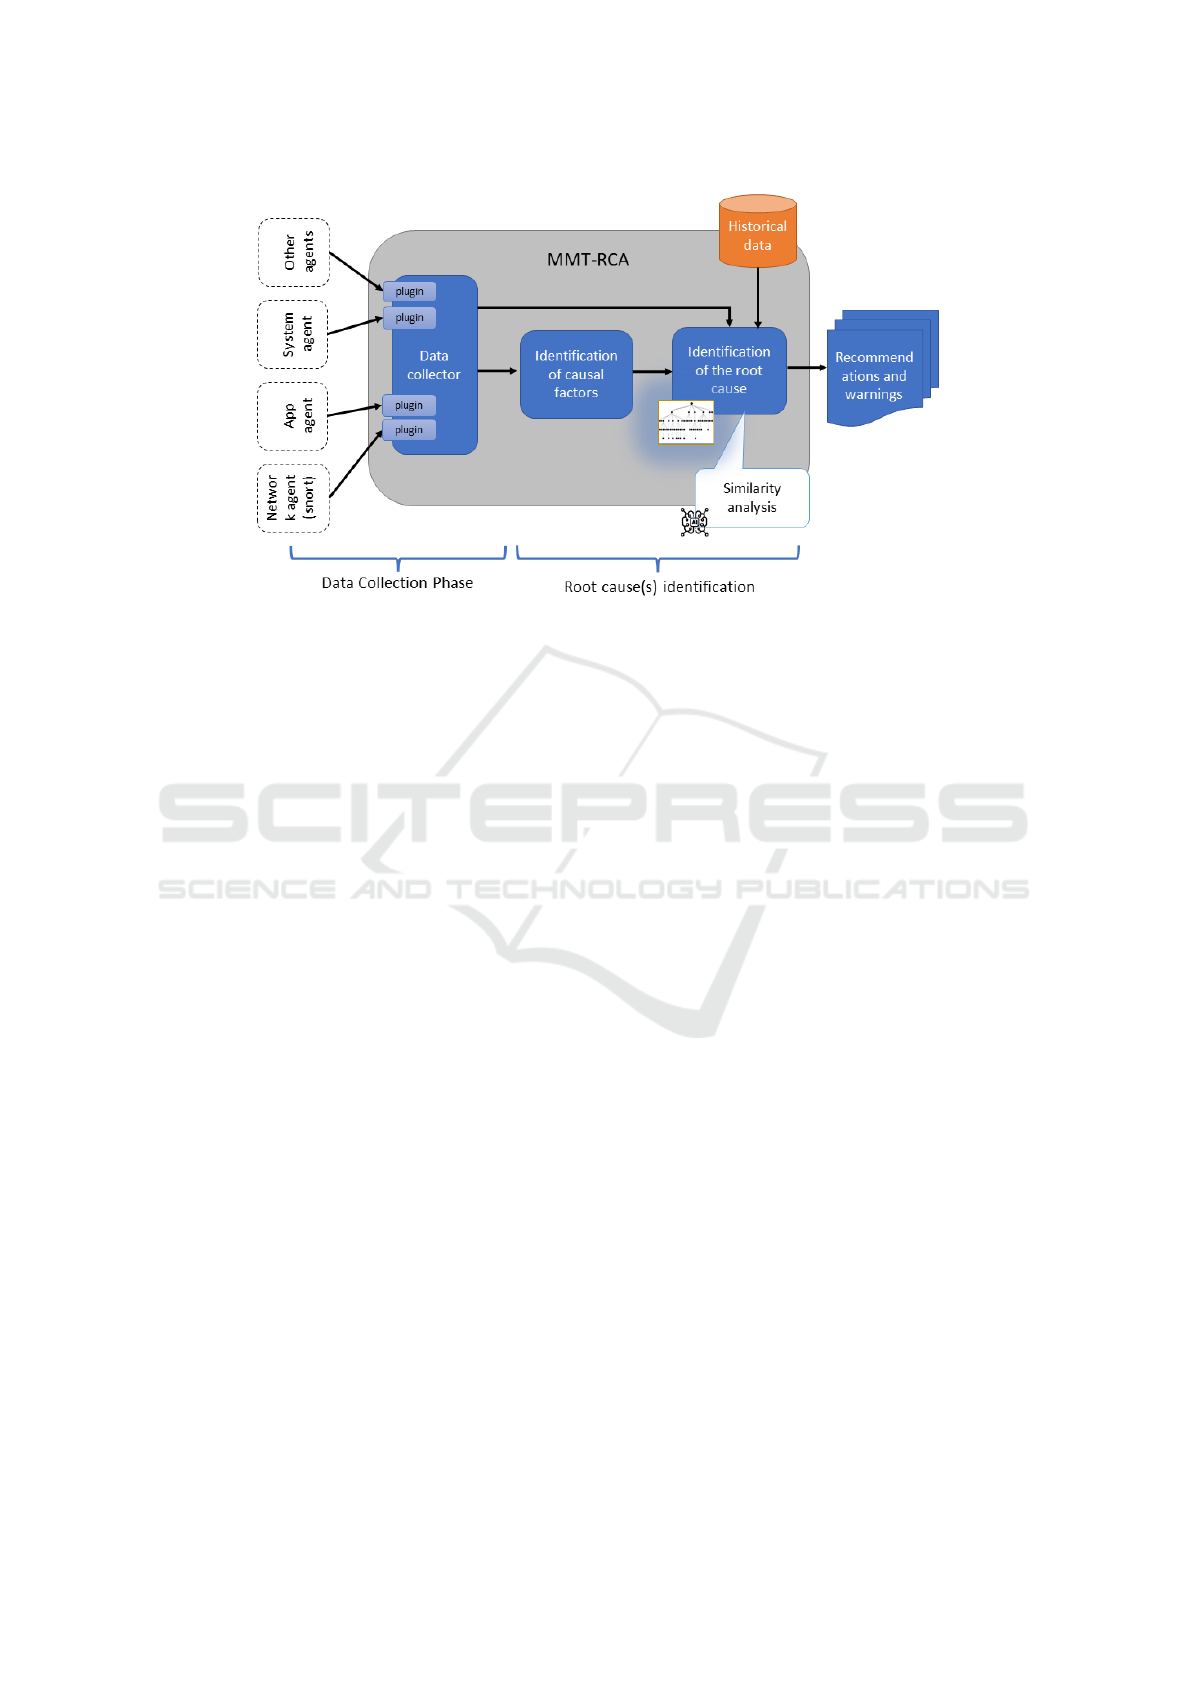
Figure 1: The automated diagnosis framework architecture.
3 THE AUTOMATED DIAGNOSIS
FRAMEWORK: MMT-RCA
In this section the complete framework of MMT-RCA
will be explained and showed in details.
3.1 The Automated Diagnosis
Framework
Figure 1 illustrates the high-level architecture of the
automated diagnosis framework. The tool utilizes
a data collector that gathers information from vari-
ous sources within the industrial critical system, such
as network, application, system and hardware, using
dedicated monitoring agents. The data collector em-
ploys a plugin architecture to support the extraction of
attribute values relevant for identifying the origin of
incidents. Machine learning algorithms are applied to
select the most significant attributes called causal fac-
tors, enhancing analysis accuracy and reducing com-
putational resource requirements.
The data collector can be either provided by the
system itself or deployed as an agent, captures net-
work traffic and reads and extracts logs in different
formats like JSON, CSV or even binary. Relevant
metrics are selected, considering performance indica-
tors and specific case studies.
Historical data consisting of labeled events and
their associated attribute values is used for learning
purposes. By using similarity learning, particularly
Ranking Similarity Learning, the tool compares new
system states with known undesirable states to rec-
ognize root causes. The tool recommends relevant
countermeasures based on known mitigation strate-
gies.
The RCA tool operates in two phases: knowl-
edge acquisition, also called learning phase, and mon-
itoring phase. The learning phase involves building
a historical database of known problems and inci-
dents, while the monitoring phase continuously an-
alyzes real-time system data, queries the historical
database, and suggests potential root causes. Root
cause identification relies on similarity analysis, treat-
ing system states as vectors in a multidimensional
space.
Recommendations and visualization of similarity
scores, known incidents, and root causes assist sys-
tem administrators in anticipating system evolution,
detecting faults, and taking appropriate mitigation ac-
tions.
3.2 Implementation Details
As described in the previous section, the RCA is
based on two phases: knowledge acquisition and
monitoring stage. Both of them require to define a set
of metrics or features describing the system status and
its related incidents. This set of features are obtained
thanks to the use of 4 in-house modules of MMT tool,
their combination constitute the MMT-RCA solution:
• MMT-Extract: this module allows parsing the in-
put traces of the MMT-RCA. These inputs can
have different formats and sources. That’s why
MMT-Extract has a plugin architecture to deal
with heterogeneous inputs. Today MMT-Extract
has more than 650 plugins and can deal with pre-
Diagnosis Automation Using Similarity Analysis: Application to Industrial Systems
333
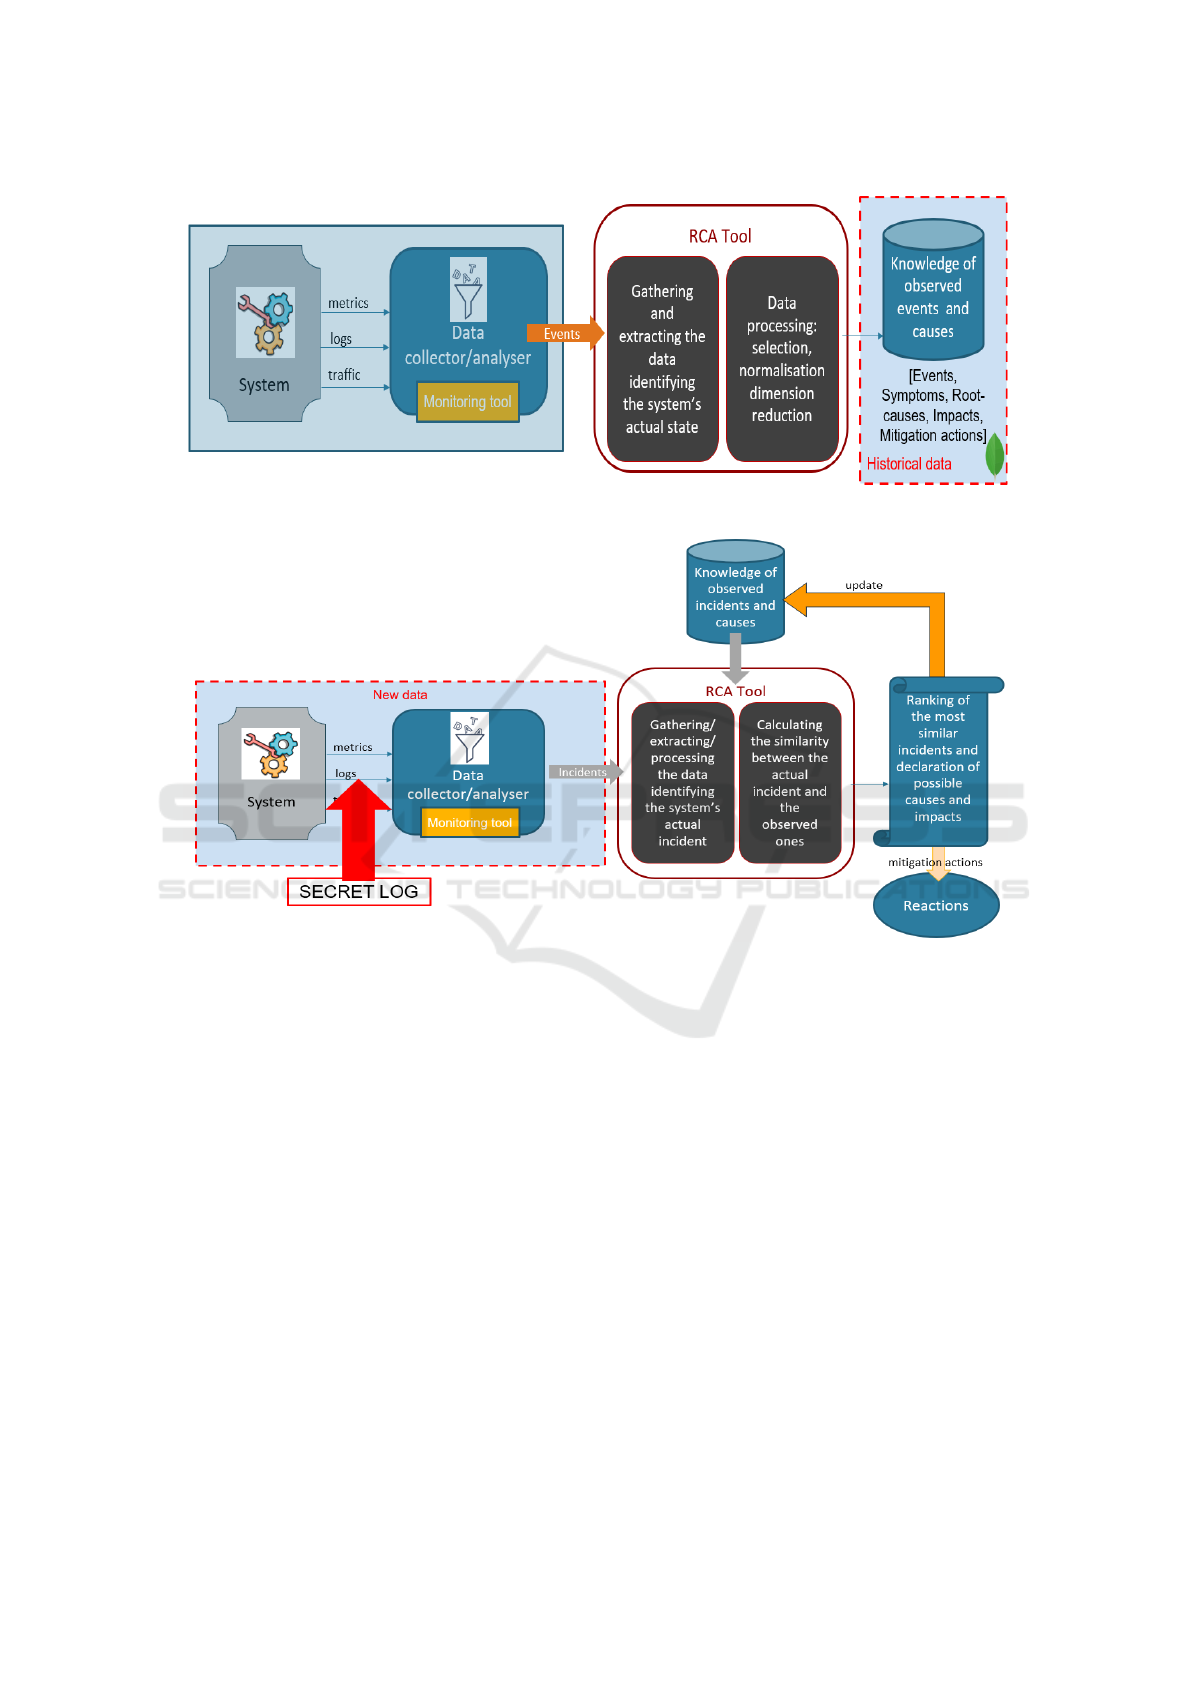
Figure 2: The Knowledge acquisition phase.
Figure 3: The monitoring and diagnosis phase.
captured logs/datasets or live streaming logs. The
data extracted can be coming from the raw data
(a specific attribute in the log) or computed data
by correlating several events. Example: comput-
ing packet loss rate in a session, or speed from 2
positions of a vehicle etc.
• MMT-Security: this module allows to perform
Complex Event Processing (CEP) to detect secu-
rity incidents and attacks. To do so, it aggregates
and applies a logic to the extracted variables.
• MMT-Similarity: Based on the historical data (i.e,
list known metrics values denoting each security
incident), a distance is computed for newly moni-
tored datasets. This allows to compute the similar-
ity of events and identify the root causes of prob-
lem with a specific accuracy. This identification
is based on similarity analysis algorithms that can
be chosen in the configuration file.
• MMT-Operator: allows the display of the results
of analysis and classify the possible causes and
provide recommendations and warnings.
The learning phase is depicted in Figure 2. During
this phase, labelled incidents need to be used. They
can be either old detected incidents or simulated ones.
The monitoring phase illustrated in Figure 3 relies
on precaptured logs or can be done at runtime where
incidents are detected and an automatic diagnosis is
performed. The MMT-RCA software solution is im-
plemented as open source solution in C, Python and
Javascript and its modules are available at
https://github.com/Montimage.
ICSOFT 2024 - 19th International Conference on Software Technologies
334
4 APPLICATION TO IT SYSTEMS
4.1 ABB Case Study
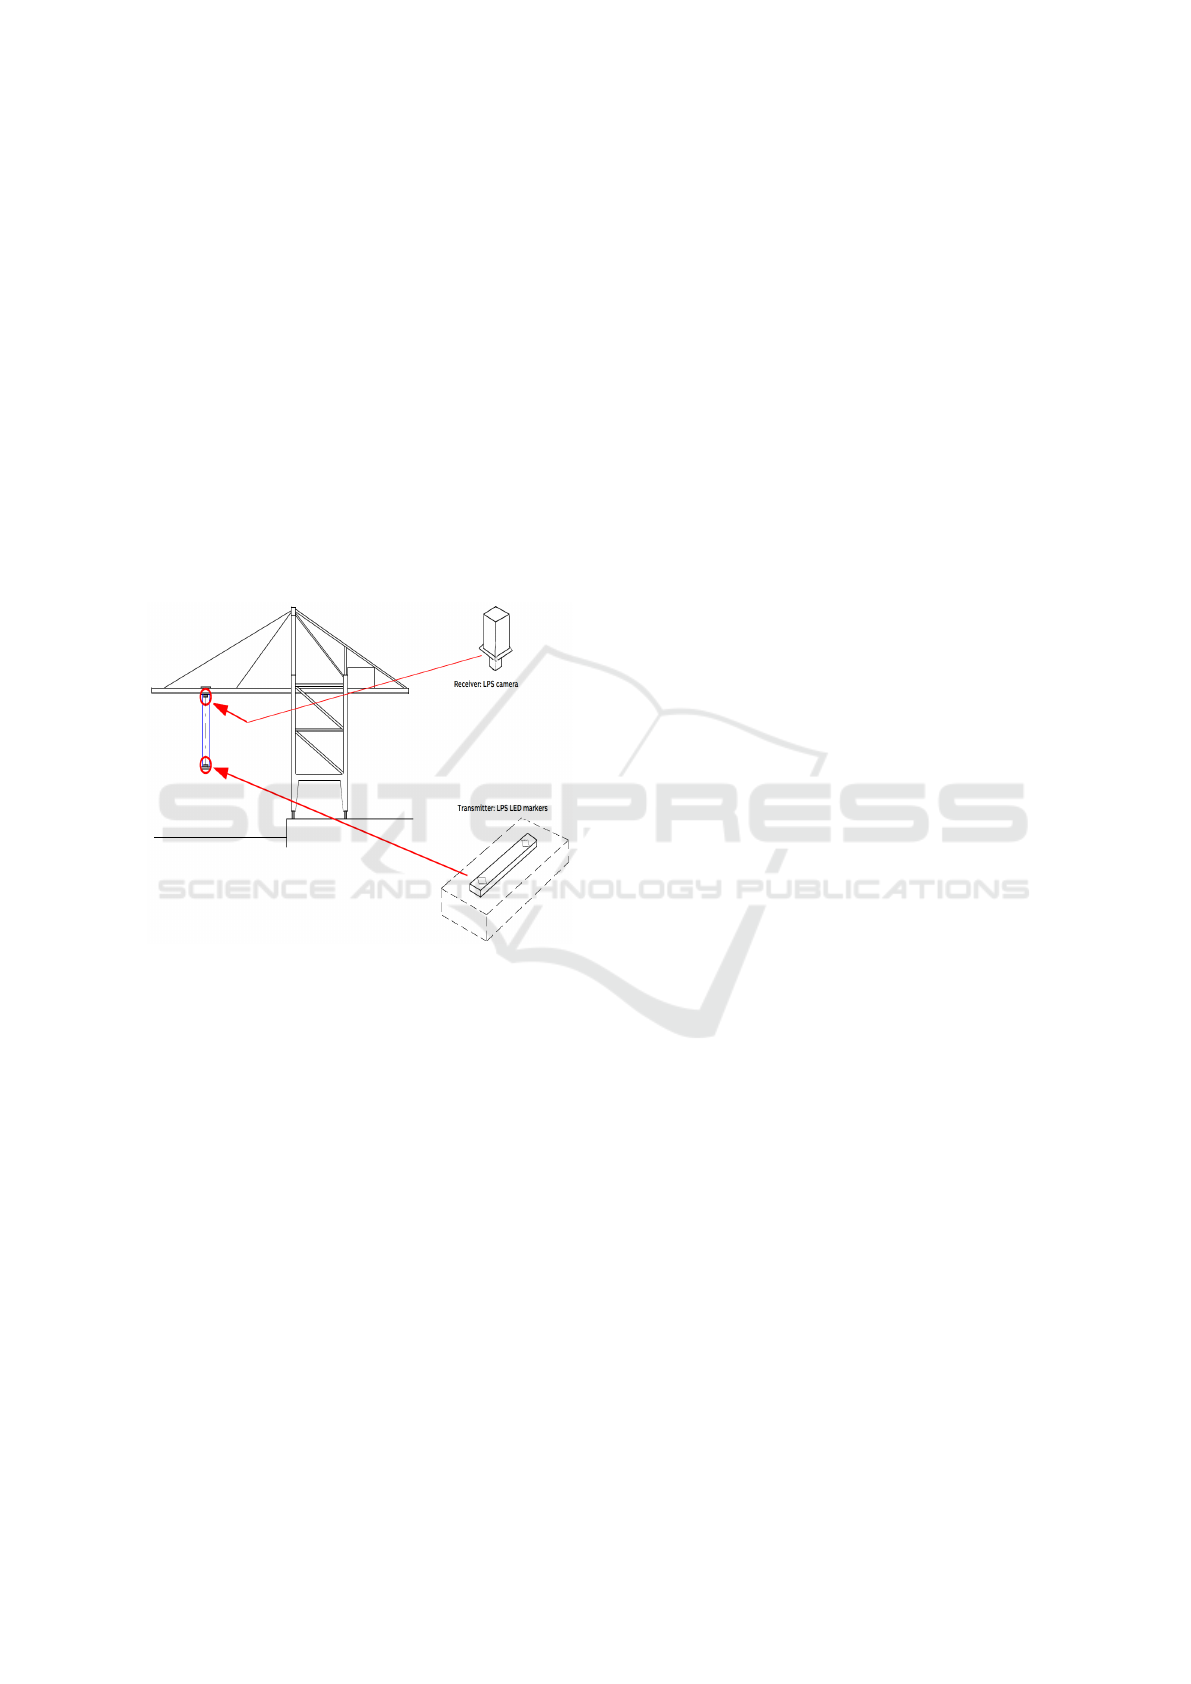
ABB Load Position Sensor (LPS) is a camera-based
tracking system that determines a hanging crane load
position with help of attached LED markers on the
load. As can be seen in Figure 4, the system consists
of a camera on top of a crane that keeps tracks of LED
markers on a load that is in motion. In addition, there
is single Programmable Logic Controller (PLC) that
analyses the camera images. The sensor acts as feed-
back to the automatic control of the crane.
However, it has happened that noise detected by
the camera is tagged as markers by the PLC. This sit-
uation might lead to incorrect movements of the crane
and compromise the safety of the system.
Figure 4: The Load Position Sensor (Salazar et al., 2022).
4.1.1 Potential Causes of Incidents
In this experiment, we focus only on 3 types of chal-
lenges that could cause an incident:
• Problem 1. Internal bugs in camera firmware that
could cause faulty output;
• Problem 2. Markers are split by a hanging cable
between the camera and the marker;
• Problem 3. Random noises from the environment
in the collected data.
Three datasets of each problem have been gathered by
ABB. Secret logs (without labelling) has been gener-
ated for testing purposes.
4.1.2 Data Extraction and Knowledge
Acquisition
A first attempt of using raw features in the datasets
has been ineffective as the information inside the
log was not enough to describe each of the prob-
lems. Therefore, new features were derived by us-
ing MMT-Extract applying computations and aggre-
gation of many rows of the log. These features are
listed in Table 1. A core step in the workflow of the
tool is the attributes selection. In order to do so, Re-
cursive Feature Elimination (RFE) (Choi et al., 2011)
and clusterization (Ezugwu et al., 2022) were applied
to the feature set and was computed a correlation ma-
trix, whereby it was selected a subset of metrics that
are more relevant to the incidents and enable higher
performance: metrics ids (1), (2), (3), (4), (5), (6),
(18), (20).
4.1.3 Learning Phase
During the learning phase, the tool takes in input the
subset of selected features for each labelled dataset.
From here on, normalisation is implemented: it per-
mits to have all the feature in the range [0,1] but also
to ease the comparison among the states of the inci-
dents. After the normalisation, parameters of Gaus-
sian distribution per problem are computed (mean,
standard deviation, min and max).
4.1.4 Evaluation Results
MMT-RCA recognised correctly most of the exam-
ples (with a similarity score above 80%) while the
tool had little trouble recognising the log without any
faults, but these examples still had a acceptable simi-
larity score (above 70%). The overall accuracy of the
tool was 95.1% while the amount of examples that
had not been correctly recognised was only 14 on a to-
tal of 292 examples. Finally, also the results obtained
with the secret log used as input of MMT-RCA are
satisfying; the log was composed of a scarce number
of examples of normal behaviour and a large amount
of examples related to the first problem. RCA clas-
sified successfully the examples to the first problem
while the ones not containing an issue were associ-
ated to problem 0 (normal behaviour). It is important
to underline that to obtain these results only one ex-
ample of each incident log was enough to learn and
build the knowledge database. This makes the MMT-
RCA unique and interesting for the industrial context.
4.2 Fagor use case
To use their manufacturing equipment, Fagor pro-
vides a Remote Desktop Protocol (RDP) connection
to remote users.Despite the robust RDP framework,
challenges may arise, leading to potential disruptions
in reaching the destination host. Monitoring is crucial
to identify and address these challenges promptly.
Diagnosis Automation Using Similarity Analysis: Application to Industrial Systems
335
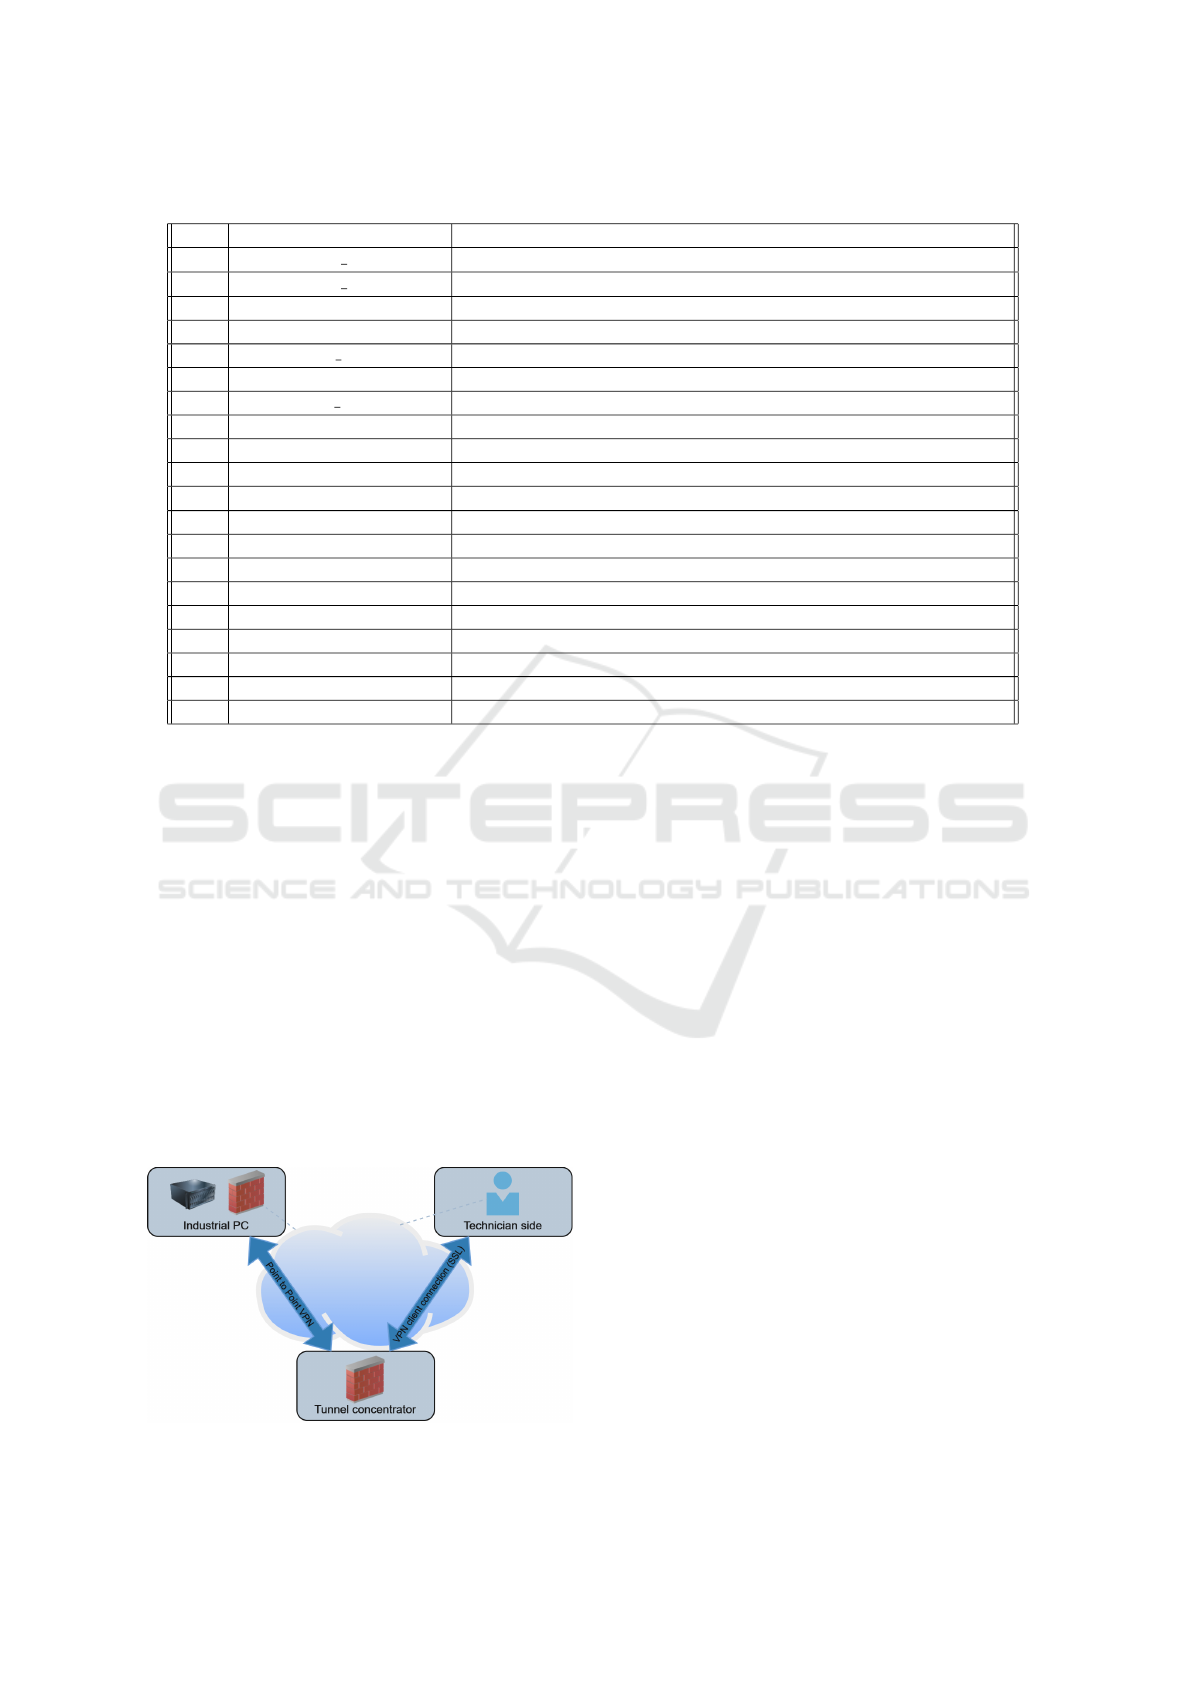
Table 1: List of attributes extracted with MMT-Extract for ABB use case.
Ref Attribute Description
(1) NSE M
i
th
Number of entries markers were frozen in the same position (x,y)
(2) NST M
i
th
Number of times markers were frozen in the same position (x,y)
(3) MDAM Minimum distance between all the entries for same marker
(4) ADAM Average distance between all the entries for same marker
(5) ADT TNM Average ∆ T the trolley was not moving with speed >0.5
(6) TTNM Number of times the the trolley was not moving with speed >0.5
(7) ADT HNM Average ∆ T the hoist was not moving with speed >0.5
(8) THNM Number of times the the hoist was not moving with speed >0.5
(9) AvgTrolleyPos Average position of the trolley in the log (x,y)
(10) AvgHoistPos Average position of the hoist in the log (x,y)
(11) AvgMarker
i
th
Average coordinates x and y per each marker
(12) AvgMhSpeed Average speed of Main Hoist
(13) AvgGaSpeed Average speed of Gantry
(14) AvgTrSpeed Average speed of Trolley
(15) AvgMhAcceleration Average acceleration of Main Hoist
(16) AvgGaAcceleration Average acceleration of Gantry
(17) AvgTrAcceleration Average acceleration of Trolley
(18) TotalDistanceMarker Total euclidean distance per marker in a window of time
(19) AvgNumberOfMarkers Average number of markers considered valid by PLC
(20) NotAligned Number of times the markers were not aligned (angle °<170)
Additionally, a VPN tunnel is used to transmit net-
work traffic between the Industrial PC and the Tele-
service host. In order to manage the traffic and guar-
antee the security and privacy of the operations, the
point-to-point VPN has a remote firewall that may
block traffic between the Industrial PC and the end-
point. Figure 5 illustrates the described architecture
and three different incident scenarios has been simu-
lated and pcap files provided for the learning phase.
• a trace describing the situation in which the Indus-
trial PC running, but RDP protocol was not acti-
vated (Problem 1);
• a problem known as Problem 2 where communi-
cation with the industrial PC was blocked by the
firewall;
• a pcap in which the firewall could not be contacted
(Problem 3).
Figure 5: FAGOR system topology.
4.2.1 Data Extraction and Knowledge
Acquisition
Several network features have been computed for this
analysis and are listed in Table 2. The feature selec-
tion process was still required despite the small num-
ber of metrics that were recovered. Features (1) and
(2) were finally discarded.
4.2.2 Learning Phase
Similar to how it was done for the ABB use case,
RCA was given the datasets as input so that it could
learn the states of every problem. After normalis-
ing the values, the states were stored in a MongoDB
collection, while the Gaussian distribution parameters
were kept in a separate collection. At the end of this
step there were four states in the historical data, one
for each scenario.
4.2.3 Evaluation Results
The majority of issues were acknowledged by the
tool as problems (with a similarity score in this case
above 75%, which was considered as a good thresh-
old). Only a few instances were mistakenly classified
as belonging to a separate problem, demonstrating the
tool’s reliability: in fact, the tool’s overall accuracy
was 91.42%, with only 35 out of a total of 408 sam-
ples failing to acquire the correct identification. Fi-
nally, the results from injecting unlabeled trace data
ICSOFT 2024 - 19th International Conference on Software Technologies
336
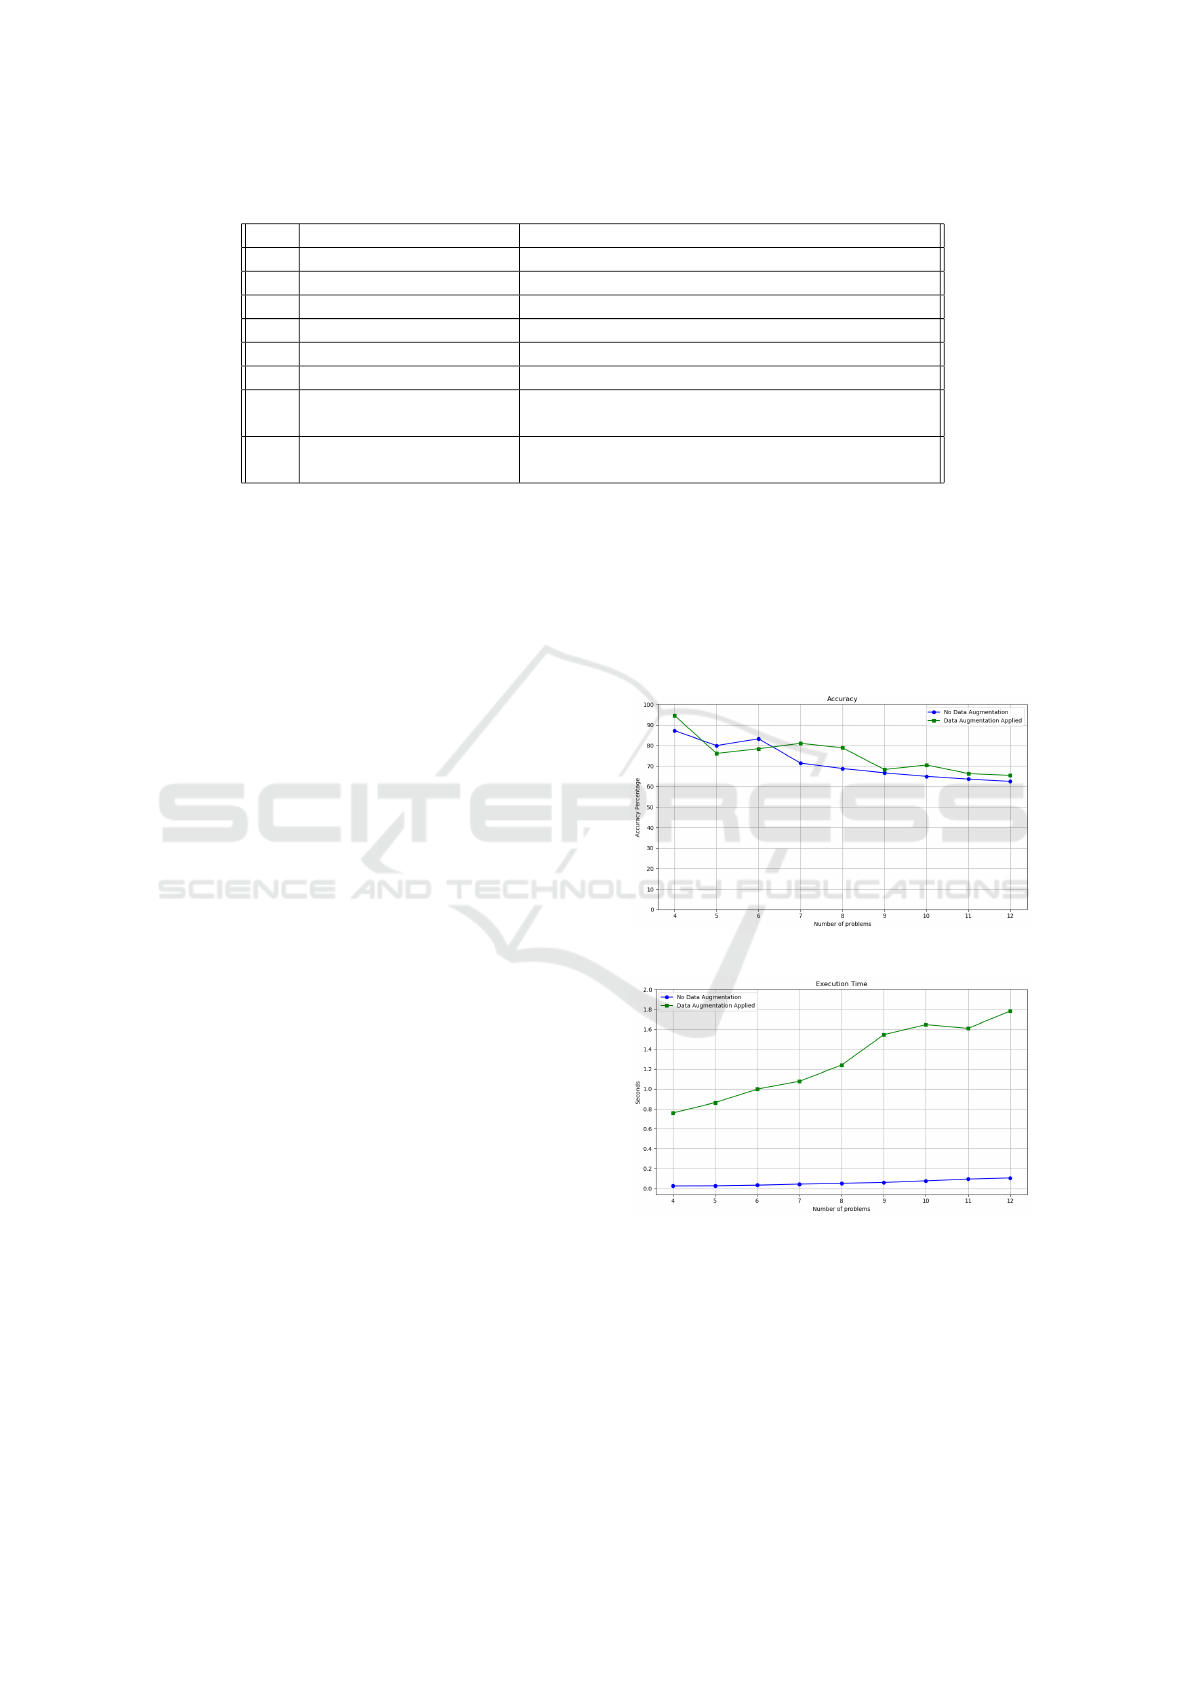
Table 2: List of attributes extracted and sent to RCA for FAGOR use case.
Ref Attribute Description
(1) RDP Percentage of RDP packets in the entire trace
(2) TPKT Percentage of TPKT packets in the entire trace
(3) ICMP Percentage of ICMP packets in the entire trace
(4) ARP Percentage of ARP packets in the entire trace
(5) MDNS Percentage of MDNS packets in the entire trace
(6) LENGTH Length of the trace (number of packets)
(7) NO-RDP-TPKT Absence of both RDP and TPKT packets in the
entire trace
(8) NO-RDP-TPKT-ICMP Absence of both RDP and TPKT and ICMP pack-
ets in the entire trace
into MMT-RCA are encouraging; the tool was able to
classify each trace to the appropriate incident with a
similarity score of ≈ 75%, with the exception of the
normal incident, which has a lower similarity rate but
is still correctly identified.
4.3 Performance Evaluation
To assess the performance of MMT-RCA, multiple
experiments were carried out regarding scalabilty and
execution time. The amount of root cause scenarios
was increased up to 12 which represent a high num-
ber of potential causes in a realistic case study. Each
different scenario was created taking into account a
likely possible scenario by applying a perturbation
to a subset of the features. For each case, the tool
has been applied to the examples and were collected
quantitative metrics such as the accuracy and execu-
tion time.
The experiments conducted can be divided into
two main groups:
• the first group is related to those experiments
which did not include data augmentation and had
a number of examples used during the learning
phase equal to 2 · |root − causes| according to the
number of problems used in that case;
• in the experiments of the second group instead
was used data augmentation, so that the number
of examples for every case was ≈ 400.
This division allowed to understand how MMT-RCA
performed with a small or a large amount of exam-
ples used during the learning phase. For all the ex-
periments of both groups it has been applied feature
selection, so as to get the highest possible value of
accuracy: the number of features ranges from 7 to 9.
Firstly, the experiments done to evaluate MMT-
RCA showed it can reach high levels of accuracy,
whether many examples are present with which to
learn the states of incidents or not. As anybody would
expect, the higher is the number of examples during
the learning phase, the more precise and definite is the
state, therefore the more accurate is the tool; on the
other hand, MMT-RCA still reaches high values of
accuracy when it encounters only few examples, that
is the formidable outcome of the instrument: just few
examples are needed (in our experiments each prob-
lem was described by only two instances) to create a
state which is in any case reliable.
Figure 6: Accuracy of MMT-RCA.
Figure 7: Execution Time of MMT-RCA.
Secondly, the experiments showed a real good per-
formance of the tool in terms of speed, since increas-
ing the number of problems did not lead to an expo-
nential increase of execution time for both groups; in-
stead, the execution time grows linearly, which is a
outstanding result: increasing the number of problems
did not correspond to an interminable wait.
Diagnosis Automation Using Similarity Analysis: Application to Industrial Systems
337

5 CONCLUSIONS
In conclusion, the proposed approach of leverag-
ing historical incident data and employing similar-
ity analysis algorithms in the MMT-RCA framework
has shown promising results in incident management
and root cause identification. By building a com-
prehensive incident repository and analyzing patterns
and correlations among issues, the framework effec-
tively identifies similar incidents and their underlying
causes. The validation experiments conducted using
real-world incident data from industrial settings pro-
vided by both ABB and FAGOR have demonstrated
the framework’s accuracy in diagnosing incidents and
significantly reducing the time needed for manual
analysis. The automation of the diagnosis process not
only improves incident response time but also enables
proactive maintenance, leading to increased system
uptime and enhanced operational efficiency. Overall,
the implementation of this approach holds great po-
tential for enhancing incident management practices
and optimizing the performance of industrial systems.
ACKNOWLEDGMENT
This work is partially supported by the European
Union’s Horizon Europe research and innovation pro-
gram under grant agreements No 957212 (VERIDE-
VOPS) and No 101070455 (DYNABIC). Views and
opinions expressed are however those of the author(s)
only and do not necessarily reflect those of the Euro-
pean Union.
REFERENCES
Black, P., Gondal, I., Vamplew, P., and Lakhotia, A. (2019).
Evolved similarity techniques in malware analysis. In
18th IEEE International Conference On Trust, Secu-
rity And Privacy In Computing And Communications /
13th IEEE International Conference On Big Data Sci-
ence And Engineering, TrustCom/BigDataSE 2019,
Rotorua, New Zealand, August 5-8, 2019, pages 404–
410. IEEE.
Choi, H., Yeo, D., Kwon, S., and Kim, Y. (2011). Gene
selection and prediction for cancer classification using
support vector machines with a reject option. Comput.
Stat. Data Anal., 55(5):1897–1908.
Ezugwu, A. E., Ikotun, A. M., Oyelade, O. N., Abualigah,
L. M., Agushaka, J. O., Eke, C. I., and Akinyelu,
A. A. (2022). A comprehensive survey of cluster-
ing algorithms: State-of-the-art machine learning ap-
plications, taxonomy, challenges, and future research
prospects. Eng. Appl. Artif. Intell., 110:104743.
He, Z., Chen, P., Luo, Y., Yan, Q., Chen, H., Yu, G.,
and Li, F. (2022). Graph based incident extraction
and diagnosis in large-scale online systems. In 37th
IEEE/ACM International Conference on Automated
Software Engineering, ASE 2022, Rochester, MI, USA,
October 10-14, 2022, pages 48:1–48:13. ACM.
Hemsley, K. and Fisher, R. E. (2018). A history of cy-
ber incidents and threats involving industrial control
systems. In Staggs, J. and Shenoi, S., editors, Crit-
ical Infrastructure Protection XII - 12th IFIP WG
11.10 International Conference, ICCIP 2018, Arling-
ton, VA, USA, March 12-14, 2018, Revised Selected
Papers, volume 542 of IFIP Advances in Informa-
tion and Communication Technology, pages 215–242.
Springer.
Kalam, A. A. E. (2021). Securing SCADA and critical in-
dustrial systems: From needs to security mechanisms.
Int. J. Crit. Infrastructure Prot., 32:100394.
Kallel, S., Cuppens, F., Boulahia-Cuppens, N., Kacem,
A. H., and Othmane, L. B. (2021). Special issue on
risk and security of smart systems. J. Inf. Secur. Appl.,
61:102925.
Kiermeier, M. and Feld, S. (2018). Visual analytics for root
cause analysis in self-organizing industrial systems. In
16th IEEE International Conference on Industrial In-
formatics, INDIN 2018, Porto, Portugal, July 18-20,
2018, pages 315–320. IEEE.
Kirkpatrick, K. (2019). Protecting industrial control sys-
tems. Commun. ACM, 62(10):14–16.
Lanotte, R., Merro, M., and Munteanu, A. (2023). In-
dustrial control systems security via runtime enforce-
ment. ACM Trans. Priv. Secur., 26(1):4:1–4:41.
Salazar, Z., Cavalli, A. R., Mallouli, W., Sebek, F., Za
¨
ıdi, F.,
and Rakoczy, M. E. (2022). Monitoring approaches
for security and safety analysis: Application to a load
position system. In 15th IEEE International Confer-
ence on Software Testing, Verification and Validation
Workshops ICST Workshops 2022, Valencia, Spain,
April 4-13, 2022, pages 40–48. IEEE.
Wang, H., Wu, Z., Jiang, H., Huang, Y., Wang, J., K
¨
opr
¨
u,
S., and Xie, T. (2021). Groot: An event-graph-based
approach for root cause analysis in industrial settings.
In 36th IEEE/ACM International Conference on Auto-
mated Software Engineering, ASE 2021, Melbourne,
Australia, November 15-19, 2021, pages 419–429.
IEEE.
ICSOFT 2024 - 19th International Conference on Software Technologies
338
