
Analytical Study on Typeface Visual Identification
Xavier Molinero
1,∗ a
, Josep Freixas
1 b
and Montserrat T
`
apias
2 c
1
Department of Mathematics, Universitat Polit
`
ecnica de Catalunya · BarcelonaTECH, Spain
2
Department of Optics and Optometry, Universitat Polit
`
ecnica de Catalunya · BarcelonaTECH, Spain
Keywords:
Visual Identification, Measure of Topographies, Power Indices.
Abstract:
In this study, our objective is to explore methodologies for the identification of diverse typefaces. Utilizing
the gathered data, we conducted a thorough analysis of the outcomes, distinguishing between successes and
failures for both uppercase and lowercase letters within each typeface. The analytical framework is anchored
in three distinct recognition measures. The initial measure draws upon the relative frequency of accurate re-
sponses, providing insights into the overall performance of each typeface. The second measure is constructed
around the F-score derived from confusion matrices, offering a comprehensive evaluation of recognition pre-
cision and recall. Lastly, the third measure is formulated on the well-established Shapley-Shubik index, exten-
sively scrutinized and endorsed within the realm of classical game theory. This multifaceted approach allows
us to comprehensively assess the distinct aspects of typeface recognition, contributing to a nuanced under-
standing of their effectiveness and characteristics.
1 INTRODUCTION
Low vision is a common visual impairment, espe-
cially among older adults, which makes it difficult for
individuals to read printed materials due to reduced
clarity and sharpness of vision. Typographers have
developed specific typographies to enhance identifi-
cation for low vision readers, by increasing contrast,
reducing glare, and optimizing letter size and spac-
ing. Serif fonts such as Times New Roman and Gara-
mond are considered more legible as serifs guide the
eye along the text. Sans-serif fonts such as Arial and
Verdana provide a clearer and simpler design, improv-
ing readability. However, designers must test their
typographies with low vision users, as identification
or readability is subjective and can vary depending
on the individual’s vision impairment. By optimiz-
ing typographies for low vision readers, we can make
printed materials more inclusive and improve acces-
sibility for all.
In this research, we introduce and discuss three
distinct measures for typographic identification. The
initial measure is described in Subsection 2.1. Fol-
lowing that, the second measure is introduced and
a
https://orcid.org/0000-0002-5203-4347
b
https://orcid.org/0000-0002-9033-9432
c
https://orcid.org/0000-0003-2421-0718
∗
Corresponding author.
detailed in Subsection 2.2. Lastly, Subsection 2.3
presents a novel measure, which is founded on the
Shapley-Shubik index derived from game theory. This
section provides a comprehensive definition and ex-
ploration of the application of the Shapley-Shubik in-
dex in the context of typographic recognition.
2 TYPOGRAPHIC
RECOGNITION
From now on, we assume that each letter of a given
typography T is presented n times. Let be µ
T
:
T × T → N, where µ
T
(X,Y ) = k is the number of
times that observers said Y when X is shown. For in-
stance, µ
T
(X,Y ) = 5 means that 5 times the observers
have said Y when X has been shown. Thus, the most
identificable tipography should verify
µ
T
(X,Y ) =
n if X = Y
0 if X 6= Y
(1)
for all X,Y ∈ T . Next, we analyze those dataset in
three different ways, i.e., applied to three visual iden-
tifications of topographies.
124
Molinero, X., Freixas, J. and Tàpias, M.
Analytical Study on Typeface Visual Identification.
DOI: 10.5220/0012719300003708
Paper published under CC license (CC BY-NC-ND 4.0)
In Proceedings of the 9th International Conference on Complexity, Future Information Systems and Risk (COMPLEXIS 2024), pages 124-127
ISBN: 978-989-758-698-9; ISSN: 2184-5034
Proceedings Copyright © 2024 by SCITEPRESS – Science and Technology Publications, Lda.
2.1 Identification from Relative
Frequency
In the initial phase, we examine the foundational sta-
tistical concept of relative frequency, as outlined by
Spiegelhalter in 2019 (Spiegelhalter, 2019).
Given a typography T , for each character X ∈ T
that we show to observers, we determine the relative
frequency of X, i.e., the number of times that we said
X divided by n. This value can be computed as fol-
lows:
µ
P
(X) =
µ
T
(X,X)
∑
Y ∈T
µ
T
(X,Y )
=
µ
T
(X,X)
n
.
In addition, we also define a general identifiable value
for the given typography T , based on the relative fre-
quency:
µ
P
(T ) =
∑
X∈T
µ
P
(X) .
2.2 Identification from Confusion
Matrix
In the subsequent step of our analysis, we employ
confusion matrices (Blog at WordPress.com., 2024)
as a fundamental analytical tool to assess a key met-
ric associated with each typography T , namely the F-
score. Widely acknowledged in classification tasks,
the F-score offers a nuanced evaluation by striking
a balance between precision and recall, making it
particularly pertinent to the nuances of typographic
recognition. By leveraging confusion matrices, we
scrutinize the performance of each typeface in terms
of true positives, false positives, and false nega-
tives, offering a comprehensive understanding of their
recognition capabilities.
For a detailed exploration of the computational
aspects and theoretical underpinnings of the F-score
within the scope of our study, interested readers are
directed to (Brabec et al., 2020; Wikipedia, 2024).
These references delve into the intricacies of F-score
calculations, elucidating the nuances of its application
and interpretation in the context of our research. In
particular, we consider µ
F
(X) = µ
F−score
(X) defined
by
2TruePositive
2TruePositive + FalsePositive + 2FalseNegative
,
where TruePositive is a test result which correctly
indicates that a condition hold, FalsePositive is a
result that indicates a given condition exists when it
does not, and FalseNegative is a test result which
wrongly indicates that a condition does not hold.
As we have done for the relative frequency, we
define a general identifiable value for the given tipog-
raphy T as follows
µ
F
(T ) =
∑
X∈T
µ
F
(X) .
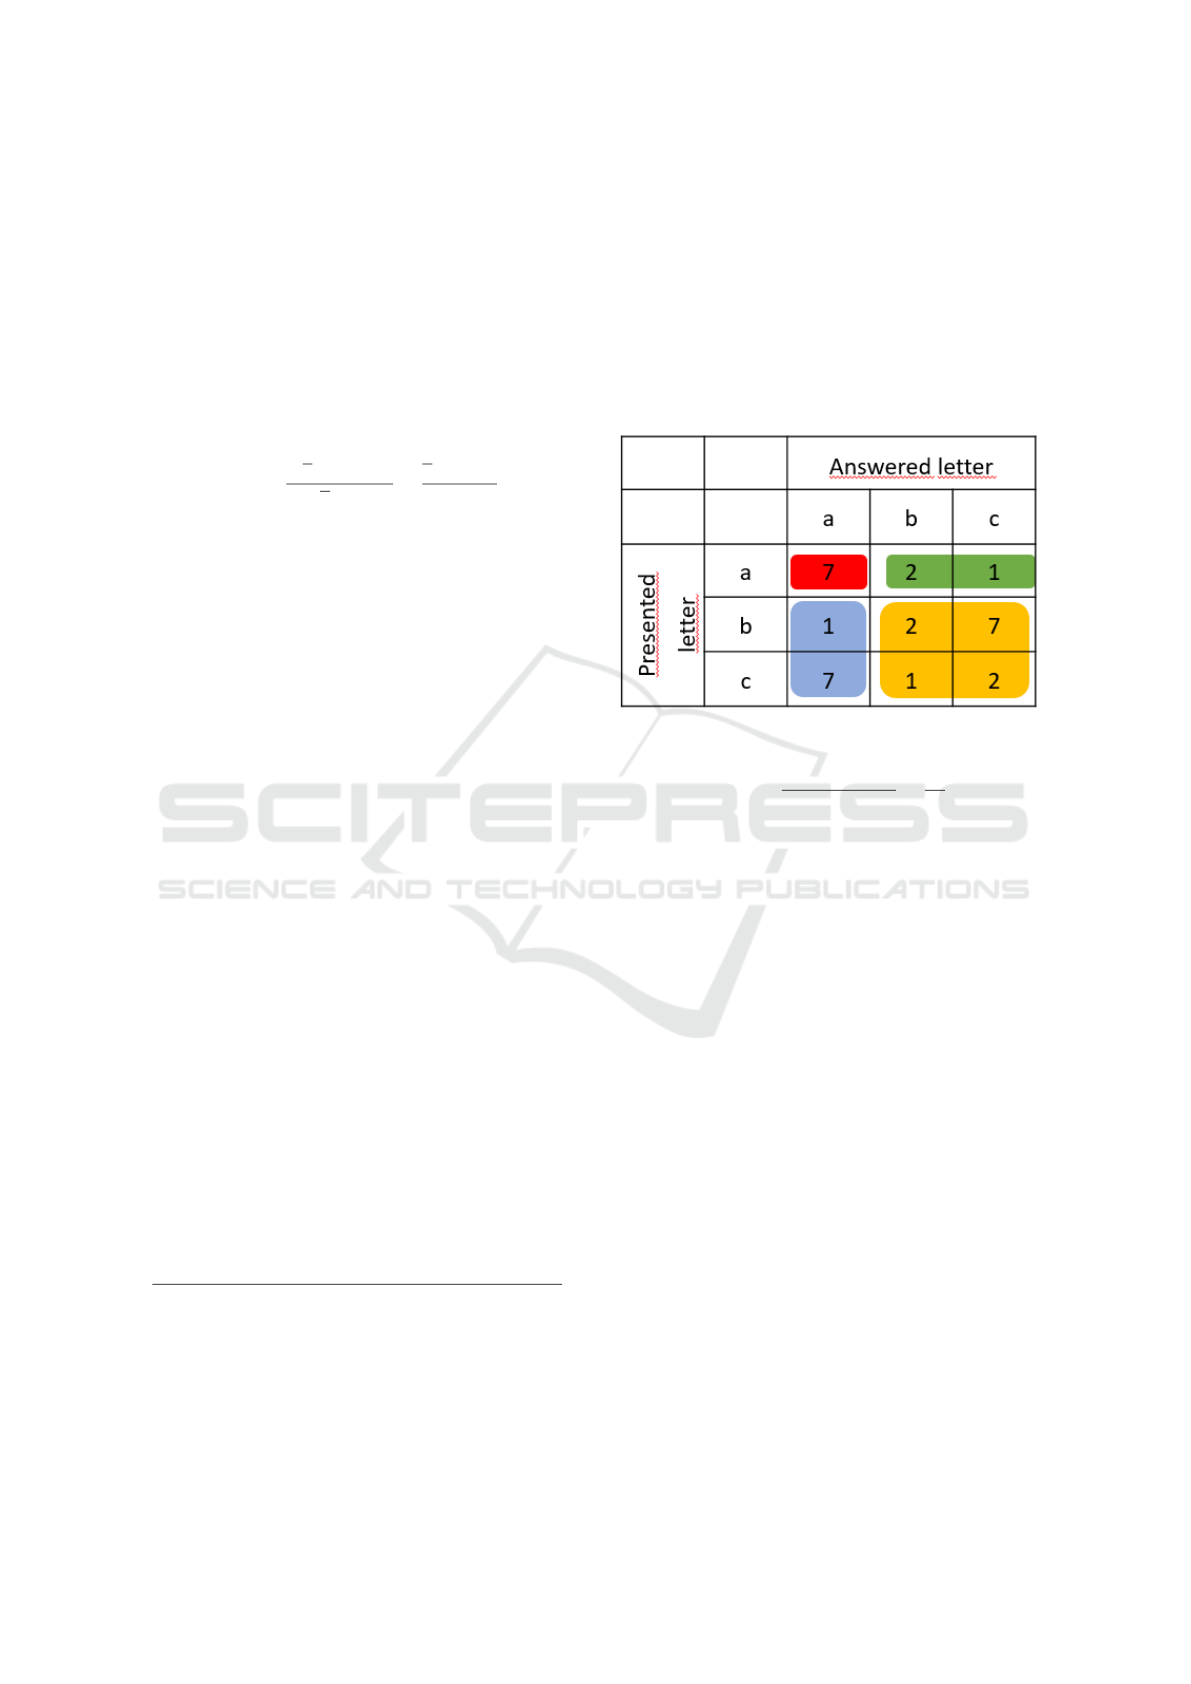
Example. Let T be a typography where
{a,b, p, q} ∈ T . Suppose that, after doing the experi-
ments with 10 presentations for each letter, we obtain
the following results:
From this table we are able to compute µ
F
(a) as fol-
lows
µ
F
(a) =
2 · 7
2 · 7 + 2 + 2 · 2
=
14
20
,
where the red values are TruePositive, the blue
ones are FalsePositive, the green ones are
FalseNegative, and yellow numbers are the re-
maining values.
2.3 Identification from Shapley-Shubik
Index
Thirdly, we define a specific weighted voting
game (Taylor and Zwicker, 1999). In general, given
n characters (or players) we assign a weight (non-
negative integer) for each character and a quota q (a
positive integer). We say that a coalition of characters
S is winning or successful if and only if the sum of the
corresponding weights is more or equal to q.
Subsequent to the consideration of a typogra-
phy denoted as T , we proceed to allocate a unique
weighted voting game, denoted as Γ
SS
(X), for each
distinct typographic element X ∈ T . This allocation
is carried out in accordance with a specific method-
ology designed to systematically capture the nuances
of typographic recognition within the framework of
weighted voting games. By tailoring the approach for
each individual typeface element, this methodolog-
ical precision allows for a detailed examination of
the intricate dynamics governing typographic recog-
nition. Consequently, this structured assignment en-
Analytical Study on Typeface Visual Identification
125

ables a profound exploration of the interrelations be-
tween typographic elements and their correspond-
ing recognition measures, offering insightful observa-
tions grounded in the principles of game theory.
Next, to the consideration of a typography denoted
as T , we proceed to allocate a unique weighted voting
game for each distinct typographic element X ∈ T ,
denoted as Γ
SS
(X). This allocation is carried out
in accordance with a specific methodology designed
to systematically capture the nuances of typographic
identification within the framework of weighted vot-
ing games. In particular, Γ
SS
(X) is described as fol-
lows:
Γ
SS
(X) := [q
T
(X); µ
T
(X,Y
1
),
µ
T
(X,Y
2
),... ,
µ
T
(X,Y
k
)]
where Y
i
, for i ∈ {1,. .. ,k}, are all characters of T .
Considering the 80% success rate, for each weighted
voting game Γ
SS
(X), we stated the quota q
T
(X) as
the 80% of the total n presentations considered, i.e.,
q
T
(X) = 0.8 · n. From these weighted voting game
Γ
T
(X), we are able to compute the corresponding
Shapley-Shubik value of X with respect to Γ
T
(X),
denoted by µ
ss
(X) (Shapley and Shubik, 1954). In
essence, µ
ss
(X) is the number of times that X is pivot
(it makes that a coalition of characters will be success-
fully) divided by all possible permutations. Finally,
we consider a general identifiable value for the given
tipography T based in those values as follows
µ
SS
(T ) =
∑
X∈T
µ
SS
(X) .
Example. Let T be a typography where
{a,b, p, q} ∈ T . Suppose that, after doing the exper-
iments with 10 presentations for each carhacter, we
obtain the following results:
Γ
T
(a) = [8;8,1,0,1] → µ
SS
(a) = 1
Γ
T
(b) = [8;2,8,0,0] → µ
SS
(b) = 1
Γ
T
(p) = [8;0,1,7, 2] → µ
SS
(p) = 2/3
Γ
T
(q) = [8;0,0,4,6] → µ
SS
(q) = 1/5
Thus,
µ
SS
(T ) = 1 + 1 +
2
3
+
1
5
=
43
15
.
Note that this last method is the main novelty of
this work. It gives us a new point of view to determine
whether a typography is indistinguishable or not. In
fact, it let us to see how relevant is a character to make
a coalition of characters a successfully coalition.
3 CONCLUSION AND FUTURE
WORK
In this work, we define three different values or mea-
sure to identify how good is a given typeface or ty-
pography. Subsequently, it is necessary to apply these
measures to specific typefaces and systematically as-
sess their effectiveness. This comprehensive evalu-
ation will not only provide insights into the perfor-
mance of individual typefaces but will also contribute
to a nuanced understanding of the applicability and
robustness of each measurement method in the con-
text of our study.
A prospective avenue for further research involves
the exploration of alternative power indices, such as
Banzhaf, Deegan-Packel, Holler, among others. This
expansion should allow a more comprehensive under-
standing of the typographic recognition. Additionally,
our future effors will also focus on an examination
of typography recognition within the realm of social
networks, where we intend to investigate the inter-
play and relationships among characters as a social
network.
The final results help us to choose the best typog-
raphy and improve the design of specific characters
in the considered typography, in terms of visual iden-
tification tasks and readability (Braida et al., 2018).
It let us to rank optotypes in order to classify them
according to the visual identification.
ACKNOWLEDGEMENTS
J. Freixas and X. Molinero has been partially sup-
ported by funds from the Ministry of Science and In-
novation grant PID2019-104987GB-I00 (JUVOCO)
and the Catalan government [2021 SGR 01419 AL-
BCOM].
REFERENCES
Blog at WordPress.com. (18th March, 2024). https://classe
val.wordpress.com/introduction/basic-evaluation-me
asures/. Basic evaluation measures from the confusion
matrix.
Brabec, J., Kom
´
arek, T., Franc, V., and Machlica, L. (2020).
On model evaluation under non-constant class imbal-
ance. In Krzhizhanovskaya, V. V., Z
´
avodszky, G.,
Lees, M. H., Dongarra, J. J., Sloot, P. M. A., Bris-
sos, S., and Teixeira, J., editors, Computational Sci-
ence – ICCS 2020, pages 74–87, Cham. Springer In-
ternational Publishing.
Braida, D., Ponzoni, L., Verpelli, C., and Sala, M. (2018).
Chapter 8 - visual object recognition task: A transla-
tional paradigm to evaluate sustained attention across
species. In Ennaceur, A. and de Souza Silva, M. A.,
editors, Handbook of Object Novelty Recognition, vol-
ume 27 of Handbook of Behavioral Neuroscience,
pages 139–150. Elsevier.
COMPLEXIS 2024 - 9th International Conference on Complexity, Future Information Systems and Risk
126

Shapley, L. S. and Shubik, M. (1954). A method for evalu-
ating the distribution of power in a committee system.
American Political Science Review, 48(3):787–792.
Spiegelhalter, D. (2019). Simple games: Desirability re-
lations, trading, pseudoweightings. Pelican, Penguin
Books.
Taylor, A. and Zwicker, W. (1999). Simple games: Desir-
ability relations, trading, pseudoweightings. Prince-
ton University Press, Princeton, NJ.
Wikipedia (18th March, 2024). https://en.wikipedia.org/w
iki/F-score. F-score.
Analytical Study on Typeface Visual Identification
127
