
Improving Robustness of Satellite Image Processing Using Principal
Component Analysis for Explainability
Ulrike Witteck
1
, Jan Stambke
2
, Denis Grießbach
1
and Paula Herber
2
1
Institute of Optical Sensor Systems, German Aerospace Center (DLR), Berlin-Adlershof, Germany
2
Embedded Systems Group, University of M
¨
unster, Germany
Keywords:
Satellite Image Processing, Robustness Testing, Genetic Algorithms, Principal Component Analysis.
Abstract:
Finding test-cases that cause mission-critical behavior is crucial to increase the robustness of satellite on-board
image processing. Using genetic algorithms, we are able to automatically search for test cases that provoke
such mission-critical behavior in a large input domain. However, since genetic algorithms generate new test
cases using random mutations and crossovers in each generation, they do not provide an explanation why
certain test cases are chosen. In this paper, we present an approach to increase the explainability of genetic
test generation algorithms using principal component analysis together with visualizations of its results. The
analysis gives deep insights into both the system under test and the test generation. With that, the robustness
can be significantly increased because we 1) better understand the system under test as well as the selection
of certain test cases and 2) can compare the generated explanations with the expectations of domain experts
to identify cases with unexpected behavior to identify errors in the implementation. We demonstrate the
applicability of our approach with a satellite on-board image processing application.
1 INTRODUCTION
Satellite on-board image processing algorithms have to
meet extremely strict requirements in terms of reliabil-
ity and accuracy in hard real time to guarantee several
years of continuous operation and maintainability in
the orbit. For that, it is important to detect errors and
performance issues early in the development process.
Robustness testing is a powerful method to increase
confidence in the correct behavior of such systems by
executing test cases that cause mission-critical behav-
ior. However, due to the extreme large input domain of
such complex applications, it is infeasible to exhaus-
tively run all possible test cases. Moreover, manual
testing is error-prone as well as time-consuming. A
solution to the problem are genetic algorithms (GAs),
since they are able to perform a guided search in a
large input domain. GAs evaluate test cases (individ-
uals) based on criteria that are specified by the tester
in terms of a fitness function. The algorithm evolves
test cases with high fitness values over a number of
generations until it reaches a predefined goal applying
evolutionary mechanisms like selection, crossover, and
mutation. A major problem is that the evolutionary
mechanisms are subject to chance, which makes the
evolutionary process hard to understand for the tester.
For example, mutation and crossover are usually ap-
plied randomly to generate new individuals in each
generation. As a consequence, GAs do not provide ex-
planations why certain test cases are chosen. However,
robustness and explainability are fundamental to gain
reliability and confidence in the system and thus the
trust of the user (Holzinger, 2021).
Recent works of (Fyvie et al., 2021), (Wallace
et al., 2021), and (Mouret and Clune, 2015) show
promising concepts in the field of explainable artificial
intelligence (AI) for GAs. In particular, in (Fyvie
et al., 2021) the authors present a principal component
analysis (PCA) on GAs for trajectory mining. A PCA
identifies variables that explain variance in a given
data set, which are called principal components (PCs).
PCs can be used as explanations for variations over
time. Moreover, the authors show that a PCA can be
used to gain better understanding of an evolutionary
process. However, to the best of our knowledge, it has
not been investigated how the results from explainable
AI research can be adopted for genetic test generation
or satellite on-board image processing.
In this paper, we present an approach to increase
the explainability of genetic test generation using PCA
together with visualizations of its results. Our ap-
proach is based on three key ideas.
Witteck, U., Stambke, J., Grießbach, D. and Herber, P.
Improving Robustness of Satellite Image Processing Using Principal Component Analysis for Explainability.
DOI: 10.5220/0012719500003753
Paper published under CC license (CC BY-NC-ND 4.0)
In Proceedings of the 19th International Conference on Software Technologies (ICSOFT 2024), pages 207-218
ISBN: 978-989-758-706-1; ISSN: 2184-2833
Proceedings Copyright © 2024 by SCITEPRESS – Science and Technology Publications, Lda.
207

First, we adopt the PCA approach presented in
(Fyvie et al., 2021) to genetic test generation by defin-
ing two PCA input data formats that capture domain
specific aspects of the individuals in a given GA popu-
lation. Second, to explain the GA search process, we
visualize the ratio of explained variance per PC in a
scree plot, the evolutionary process as a trajectory over
PCs, and loading values of PCs in a bar chart. Third,
we introduce a joint analysis of loading values and the
GA’s trajectory in a PC sub-space to reflect changes
between specific GA populations. This enables do-
main experts to identify important test cases as well as
to gain insights why the GA has chosen certain inputs
as suitable test cases. This paper is based on the master
thesis of one of the co-authors (Stambke, 2023).
Our analysis gives deep insights into both the ge-
netic test generation process as well as the system un-
der test. With that, the robustness can be significantly
increased because we 1) better understand the perfor-
mance of the algorithm under test for specific/selected
input parameters, 2) can compare gained explanations
with expectations of domain experts to identify cases
with unexpected behavior, which might be caused by
errors in the implementation. We demonstrate the ef-
fectiveness of our approach on a real-world problem
with experimental results for the fine guidance system
(FGS) of the ESA mission PLAnetary Transits and
Oscillations of Stars (PLATO).
The rest of this paper is structured as follows: We
introduce preliminaries in Section 2 and discuss re-
lated work in Section 3. We present our explainability
approach for genetic test generation using PCA in Sec-
tion 4. We evaluate our approach in Section 5 and
conclude in Section 6.
2 PRELIMINARIES
In this section, we first introduce the general ideas of
explainable AI and PCA. Then, we give an overview
of the PLATO mission and its mission-critical FGS
algorithm. Finally, we summarize the genetic test gen-
eration approach presented in (Witteck et al., 2020).
2.1 Explainable Artificial Intelligence
The goal of explainable AI is to increase confidence in
AI-based algorithms by making the learning process
understandable. There are two ways to achieve this:
First, transparency design offers insights in form of
knowledge about the internal structure of an AI sys-
tem (e.g. decision trees). Transparency design may
reveal explainable aspects like variance in a linear re-
gression to understand single components or provide
algorithmic transparency by understanding the learn-
ing algorithm itself. Second, post-hoc explainable AI
offers knowledge about the algorithm by explaining
its results via e.g. analytic statements, visualization
techniques, or input manipulation to understand the
influence of single parameters or back propagation to
identify important combinations of nodes and edges in
neural networks. In post-hoc approaches like PCA, the
extraction of information from results has no impact
on the performance of the algorithm itself (Xu et al.,
2019; Do
ˇ
silovi
´
c et al., 2018; Lipton, 2018).
2.2 Principal Component Analysis
PCA is a method to reduce the dimensionality of large
data sets. The analysis identifies highly correlated
variables, which can be transformed to PCs to gain
a smaller set of variables with the same amount of
information. PCs contain the variance of the data set in
descending order. This means that the first PC contains
most of the information, the second the second most,
etc. Depending on the data analysis objective and the
data set, a small amount of PCs might be sufficient in
their information value.
There are several options to calculate PCs, e.g.
eigendecomposition of the covariance matrix, singular
value decomposition (SVD), eigenvalue approxima-
tion via power iterative computation, or non-linear
iterative partial least squares computation (Wu et al.,
1997). For reasons of numerical stability and imple-
mentation, we apply SVD. By means of SVD, we
calculate eigenvectors and eigenvalues of the variables
in our data set. Eigenvectors are linear combinations of
the original variables and its coefficients describe the
contribution of each variable to the PC. Eigenvalues
provide the amount of variance in the data.
X = USV
T
(1)
XV = USV
T
V = US (2)
λ
i
= s
2
i
for i-th data point (3)
As Equation (1) shows, SVD is a factorization of
an
m × n
matrix
X
(
m
samples,
n
variables) into an
m × m
matrix
U
, an
m × n
diagonal matrix
S
, and an
n × n
matrix
V
T
.
S
is a diagonal matrix with square
roots of the eigenvalues of
X
T
X
(singular values).
Columns of
U
are orthonormal eigenvectors of the
row-spaced matrix
XX
T
. Columns of
V
are orthonor-
mal eigenvectors of the column-spaced matrix
X
T
X
.
The PCA transforms the data set
X
according to Equa-
tion (2) into a new representation
US
by multiplying
the matrix
X
with eigenvectors
V
. The column vectors
of
V
are PCs. From Equation (3), we obtain eigenval-
ues, that show the variance of the PCs (Shlens, 2014).
ICSOFT 2024 - 19th International Conference on Software Technologies
208

By multiplying eigenvectors with the square root of
eigenvalues, we calculate PCA loading values. Load-
ing values reflect the correlation between original vari-
ables and PCs. We analyze the weight of loading
values to figure out to which extend original variables
contributed to the PCs. The sign of the loading value
indicates whether the correlation is positive or negative.
If two variables have opposite signs in their loading
value, the PC expresses a trade-off between the vari-
ables. Otherwise, the PC reflects that the variables
vary in the same way (Reris and Brooks, 2015).
2.3 PLATO Mission
The PLATO mission is the third medium-class mission
in ESA’s long-term space scientific program Cosmic
Vision (European Space Agency, 2022). The main
goal of the mission is the detection and characteriza-
tion of Earth-like exoplanets orbiting in the habitable
zone of solar-type stars. The scientific objective is
achieved by large samples of stars with ultra-high pre-
cision for a long period of time without being inter-
rupted. This process requires a very large field of view
(FoV) and a low noise level. The required FoV and a
high pupil size are obtained by a novel multicamera ap-
proach: the instrument consists of
24
normal cameras
and two fast cameras. Each camera is equipped with
four charge coupled devices in the focal plane with
4510 pixel × 4510 pixel
. The normal cameras observe
stars fainter than magnitude 8 with a cadence of
25 s
.
Fast cameras monitor stars brighter than magnitude 8.
To avoid saturation of the detector, the exposure time
is
2.5 s
. Additionally, the fast cameras serve as two
independent and redundant FGS to provide precise
attitude measurements to the spacecraft (Grießbach
et al., 2021). The FGS algorithm calculates attitude
data for the telescope by comparing measured star vec-
tors with reference directions in a star catalog. The
attitude calculation is performed with an accuracy of
milliarcseconds since the FGS is set to fulfill the mis-
sions scientific goal of ultra-high precision star data.
Hence, the FGS algorithm is a mission-critical compo-
nent (Martin Pertenais, 2022). It is crucial for mission
success, that the algorithm meets these requirements,
and therefore needs to be tested extensively.
2.4 Genetic Test Generation
To make testing more efficient and less time consum-
ing, it is preferable to examine few test cases that cover
a large part of the system under test. Equivalence class
partition testing is a commonly used solution to this
problem in practice. Equivalence classes (ECs) are
disjoint sub-domains of an input domain or output do-
main. All elements in an EC are expected to provoke
the same system behavior according to a specification.
For systematic testing, representative values of each
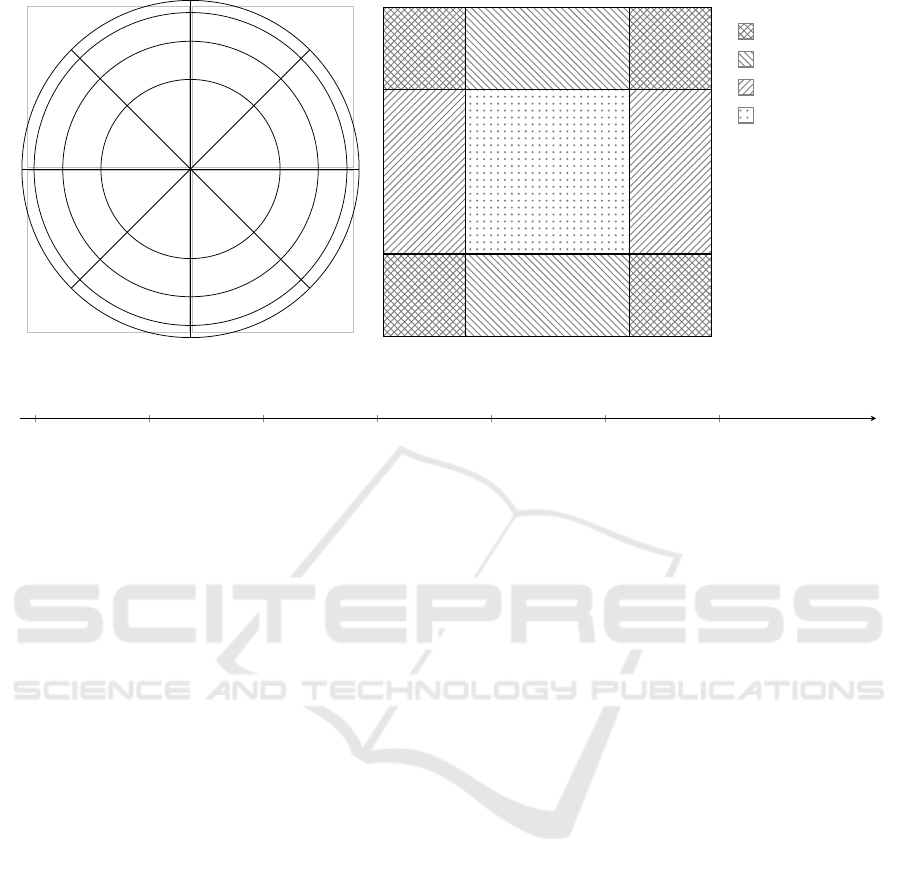
EC are then chosen. In (Witteck et al., 2019), equiva-
lence class partitioning has been applied to the input
domain of satellite on-board image processing in the
context of PLATO’s FGS algorithm. Satellite on-board
image processing algorithms such as the FGS heavily
depend on the positions of the input stars on the focal
plane assembly (FPA). To include test cases for var-
ious positions, the authors partition the FPA into the
sectors shown in Figure 1a, where the numbers shown
in the picture are used as IDs for the ECs. Further star
parameters are the sub-pixel position and magnitude.
Figure 1b shows an example for partitioning a pixel
and Figure 1c for the magnitude range. An input star is
then described by the combination of its FPA position,
pixel position and magnitude using the IDs of the ECs.
By defining ECs for the parameters of a star repre-
sentation, the number of test inputs is heavily reduced.
However, to test the FGS, combinations of stars are
needed. Previous experiments have shown that 30 in-
put stars provide sufficiently good results of the FGS
algorithm (Grießbach et al., 2021). Therefore, we de-
fine a combination of 30 stars as a test case. However,
even with a reduced test suite of stars, the number of
possible combinations is still infeasible high. E.g. with
a testsuite of 768 EC input combinations, there exist
768
30
= 7.7 · 10
53
possible FGS test cases.
GAs are capable to automatically search for spe-
cific test cases in such a large test suite. These search
algorithms are inspired by the concept of biological
evolution to solve complex optimization problems.
Evolutionary mechanisms like selection, mutation, and
crossover are applied to possible solutions until a spe-
cific termination criterion is met. In the context of GAs,
possible solutions are individuals that consist of genes.
The GA aims to optimize combinations of genes to
maximize a predefined fitness function. To achieve
this, the algorithm randomly selects a number of indi-
viduals from a given search space and evaluates each
individual by means of the fitness function. Individuals
with a high fitness value are more likely to be selected
to the next generation. In the context of genetic test
generation, an individual represents a test case. In
(Witteck et al., 2020), the authors present a GA that
searches for test cases that provoke mission-critical
behavior with respect to reliability and mathematical
accuracy of satellite on-board image processing appli-
cations. To achieve this, they define a fitness function
that captures the accuracy and execution time of the
system under test. They partition the input domain
in ECs and define genes as EC combinations, which
significantly reduces the search space.
Improving Robustness of Satellite Image Processing Using Principal Component Analysis for Explainability
209
0
12
3
4
5 6
7
8
910
11
12
13 14
15
16
1718
19
20
21 22
23
24
2526
27
28
29 30
31
(a) FPA Position ECs.
Pix-EC-0
Pix-EC-1
Pix-EC-2
Pix-EC-3
(b) Pixel ECs.
7 6.6 6.3 6 5.8 5.6 5.5
Mag-EC-0 Mag-EC-1 Mag-EC-2 Mag-EC-3 Mag-EC-4 Mag-EC-5
magnitude
0.4 0.6 0.9 1.1 1.3 1.5 1.7
·10
6
photons
(c) Magnitude ECs.
Figure 1: Partitioning examples for FPA, pixel and star magnitude parameters.
3 RELATED WORK
While there are various approaches of explainability
for deep learning algorithms, the field of explainable
metaheuristics is widely unexplored. In (Xu et al.,
2019) and (Islam et al., 2022), the authors offer re-
views in terms of history, research, and application
of explainable AI. Besides post-hoc explainability via
PCA as proposed in (Fyvie et al., 2021), recent re-
search shows further explainability techniques with
innovization (Deb et al., 2014), MAP-Elites (Mouret
and Clune, 2015), and surrogate fitness functions (Wal-
lace et al., 2021; Brownlee et al., 2021). Further, there
exist concepts to increase trust in GA solutions, such
as the confidence measure from (Mirjalili et al., 2015).
In (Mirjalili et al., 2015), the authors propose ro-
bust optimization of evolutionary algorithms by defin-
ing a neighborhood with radius r around every solution.
If there are multiple diverse solutions available in that
neighborhood, confidence for a valid GA solution is
increased. Mirjalili et al. integrate this metric in meta-
heuristic operations for robust optimization of single-
and multi-objective fitness functions. This confidence
measure successfully reduces faulty optima in a GA
run, which are caused by uncertainties in operating
conditions, manufacturing tolerance or due to mea-
surement errors. However, we aim to achieve a form
of trust by giving explanations about the GA’s evolu-
tion steps, by highlighting the relevance of individual
genes for the fitness score.
In (Deb et al., 2014), the authors introduce in-
novization as an explainability technique that describes
the process of analyzing and discovering knowledge in
properties of near-Pareto-optimal solutions. Innoviza-
tion focuses on multi-objective optimization tasks with
conflicting objectives. In contrast to their problem, we
focus on single-objective optimization.
MAP-Elites (multi-dimensional archive of phe-
notypic elites) (Mouret and Clune, 2015) is an illu-
minating algorithm, designed to return the highest-
performing solution at each point in the feature space.
The algorithm uses evolutionary algorithm concepts
by evolving generations of solutions through crossover
and mutation operations. Contrary to a classic GA,
MAP-Elites illuminates the fitness potential of the en-
tire feature space by creating an archive of distributed
high-performing solutions. This is achieved by storing
differing individuals in predefined bins. If a bin is al-
ready occupied, a higher performing individual is able
to replace the former contender. In (Urquhart et al.,
2019), the authors provided end-users with the abil-
ity to review a bins history of solutions and highlight
the highest performing solutions based on specified
criteria. Further research shows explainability oppor-
tunities in automated rule extraction from MAP-Elite
archives (Urquhart et al., 2021). While MAP-Elites
focuses on providing multiple solutions for an opti-
mization problem, the authors in (Wallace et al., 2021)
offer an approach to explain a single solution via sur-
rogate fitness functions. The concept of surrogates
ICSOFT 2024 - 19th International Conference on Software Technologies
210

originates in the motivation to increase the speed of a
GA’s search process. Parallel to the optimization run,
the authors train a surrogate model to approximate the
true fitness function. Since true fitness functions are
typically costly in computing an individuals fitness,
the surrogate can be used to evaluate the majority of
solutions at a faster rate. Wallace et al. argue, that
”the surrogate is an explicit model of what the algo-
rithm has learned about high-fitness solutions”. Hence,
the surrogate model can be mined to gain information
about the algorithms decision process. For example, a
high performing solution can be evaluated with the sur-
rogate by modifying single variables and recording the
variation in fitness. Since the surrogate represents the
learning process, the user is able to create a ranking of
variable importance within a solution. Thus, the user
can identify decisive components in individuals, which
can help in adjusting GA’s operation parameters.
MAP-Elites and surrogate functions represent valid
approaches to be exploited besides the PCA presented
in (Fyvie et al., 2021). However, both approaches
require the definition of a feature space or surrogate
functions to generate explanations in parallel with the
optimization process. In contrast, with a post-hoc
explainability approach like PCA we are able to get
explanations for results generated by an existing GA
by reducing the data dimensionality. This allows us
to analyze the performance of the algorithm under
test as well as reveal unexpected behavior caused by
implementation errors by investigating PCA loading
values. In this paper, we increase the explainability
of genetic test generation using PCA. We leave the
investigation of MAP-Elites and surrogate functions
to gain further explanations as subject to future work.
4
EXPLAINABILITY OF GENETIC
TEST GENERATION USING PCA
The input domain of satellite on-board image process-
ing algorithms is extremely large. This makes robust-
ness testing challenging since it is infeasible to exhaus-
tively execute all possible test cases. As a solution
to this problem, the authors in (Witteck et al., 2020)
propose a GA that automatically searches in a large in-
put domain for test cases that provoke mission-critical
behavior and therefore support robustness testing. In
our case study, mission-critical are scenarios where
the pointing of the satellite cannot be stabilized as re-
quired due to a low precision of the calculated attitude.
However, the solutions generated by the GA do not
provide an explanation for changes in the populations
and thus makes it hard for a user to understand the
optimization process.
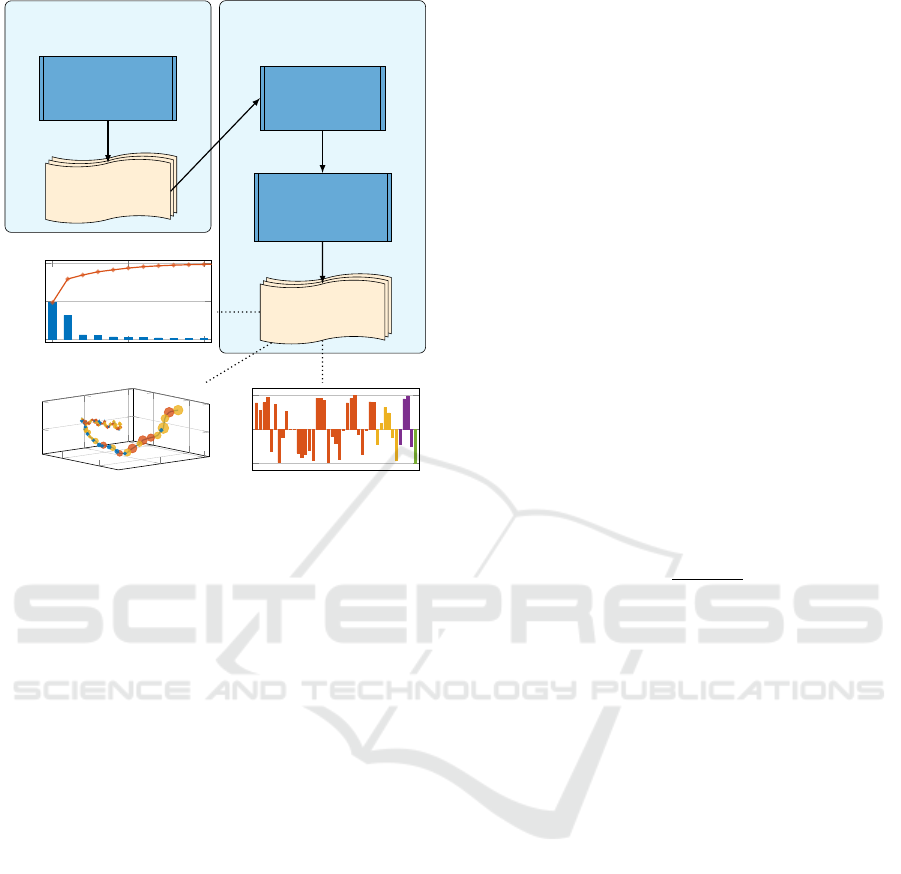
To overcome this problem, we propose an approach
to increase the explainability of genetic test generation
algorithms using PCA together with visualizations of
its results. The overall approach is shown in Figure 2.
At its core, we extend the genetic test generation of
(Witteck et al., 2020) with an explainability approach
as proposed by (Fyvie et al., 2021). Each test case is
an individual of the GA that contains a combination
of
30 stars
. Thus, a gene is a star that can be described
by an EC combination. To explain the results of the
genetic test generation algorithm (i.e., the test cases),
we define two dedicated data formats that record the
change in GA solutions throughout the generations.
The goal is to explain which gene modifications have
the highest effect on the fitness value. After preprocess-
ing the GA results in our data formats, we apply PCA
on the data to remove redundant information and thus
reduce the dimensionality of the formats. We define re-
dundant information as gene modifications that appear
over all generations and correlate with the fitness value.
Finally, we analyze these correlations within the newly
constructed dimensions, the PCs, by combining three
visualization approaches: a) we visualize the ratio of
explained variance between the calculated PCs as scree
plot as shown in the diagram in the middle of the left
side in Figure 2. The scree plot enables us to select the
most important PCs, e.g. PCs that contain the highest
ratio of explained variance, for further analysis and di-
mensionality reduction. Then, b) we apply the existing
explainable AI approach of GA trajectory mining in
(Fyvie et al., 2021). We use the PCA results to visu-
alize a trajectory of GA population changes and thus
highlight actual differences between generations as
shown in the lower left diagram of Figure 2. Finally, c)
we visualize PC loading values to analyze covariances
(correlations on standardized data) between genes and
fitness value. The lower right diagram in Figure 2
shows an example for PC loading values. We consider
loading values as coefficients scaled by eigenvalues to
include the PC’s variance. High correlations allow us
to generate a ranking of variable importance, which
gives us a better understanding of the search process.
The resulting visualizations enable domain experts to
quickly identify decisive genes, as well as important
generation steps in the trajectory. The increased con-
fidence in the GA results increases the confidence in
specifically generated test cases for mission-critical
scenarios for robustness testing, and helps to identify
cases where explanations do not match expectations,
e.g., due to implementation errors.
In the following, we describe the PCA preprocess-
ing with our novel data formats and how PCA results
can be used as explanations to gain a deeper under-
standing of genetic test generation.
Improving Robustness of Satellite Image Processing Using Principal Component Analysis for Explainability
211
Genetic
Algorithm
Test Cases
Data
Preprocessing
Principal
Component
Analysis
Explainable
Results
Test Generation
Explainability
approach
0
10
0
10
0
5
PC1
PC2
PC3
Pos-01
Pos-02
Pos-03
Pos-04
Pos-05
Pos-06
Pos-07
Pos-08
Pos-09
Pos-10
Pos-11
−1
0
1
PC1
0 5 10
0
0.5
1
Principal Comp onents
Variance Ratio
Figure 2: Overview of the PCA explainability approach.
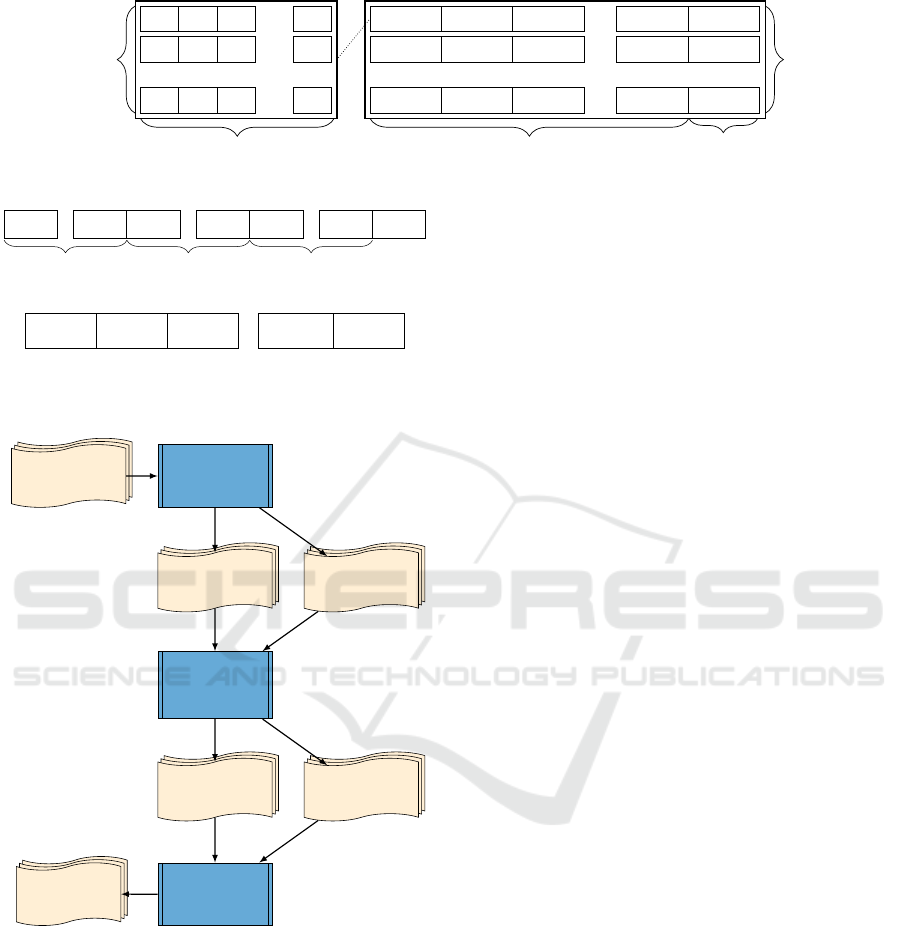
4.1 Data Preprocessing
The preprocessing of the generated test cases by the
GA is an important step to ensure meaningful results
of the PCA. We propose a data format that records
changes in the GA generations throughout the evolu-
tionary process. To achieve this, we count all gene
occurrences within all individuals in each generation
and additionally provide the average fitness value. Fig-
ure 3 illustrates our data format concept. The left side
of the figure presents an example of individuals with
their genes in the first generation. Value ”1” means
the respective gene is included in the individual and
value ”0” means it is not included. The right side of
the figure shows the gene count for each generation.
n(g
i, j
)
denotes the number of occurrences of the j-th
gene within all individuals in the i-th generation, and
µ
the average. On the right side in the example, one
individual in the first generation (first line) contains
the first gene, two individuals contain the second gene
and three individuals contain the n-th gene. Through
this aggregated representation, we obtain information
about which gene modification has the biggest effect
on the fitness value.
In the context of the PLATO FGS, we aim to get
information on the influence of specific ECs on the
FGS performance as well as information on the perfor-
mance of EC combinations (that represent single stars).
To achieve this, we define two data formats: First, the
EC data format records the occurrences of single ECs
per parameter in the populations’ individuals. For ex-
ample, the EC ID
Pos
0
occurs in no gene of the first
individual in the first generation,
Pos
1
occurs in two
genes, etc. The PCs calculated from this format are
linear combinations of all ECs of the input parameters.
Second, the starID data format records occurrences of
star IDs per generation. For example,
Star
0
occurs in
five individuals in the first generation, five individuals
contain
Star
1
, etc. The PCs calculated from this for-
mat are linear combinations of all available star IDs
in the input test suite. Figure 4a and Figure 4b illus-
trate the idea of our data formats, where
n
denotes the
number of occurrences and µ the average.
Figure 5 shows that after constructing the data for-
mats on the GA results, we accumulate the data of both
formats for all GA runs in terms of mean, minimum,
and maximum fitness value per generation. As shown
in Figure 5, the last step of the preprocessing is the
standardization of the data. Since the fitness value and
data variables have different ranges of variation, we
apply a standardization method to center and scale the
data. For a data matrix
X
with
i
individuals, repre-
sented by
j
features, the standardized scores for value
X
i j
are defined as:
z
i j
=
X
i j
− µ
X
j
σ
X
j
(4)
where
µ
X
j
is the mean of the
j
-th feature and
σ
X
j
is the
respective standard deviation. As a result, standardized
scores have zero mean and unit standard deviation.
We extract correlations between the data variables by
applying PCA on the standardized data.
4.2 Principal Component Analysis and
Explainable Results
We apply PCA to reduce the dimensionality of stan-
dardized data. Through the use of SVD, we decompose
our standardized data matrix
X
into eigenvectors and
eigenvalues as described in Section 2.2. The resulting
PCs explain the variation in our data set. We discard
PCs with lower variances since we assume that PCs
with higher variance provide reasonable explanations
of the original data set (Shlens, 2014). To simplify the
evaluation of PCA results, we use three visualizations
to plot the distribution of data variance in the PCs:
scree plot, loading bar chart, and trajectory plot.
Scree Plot. The scree plot visualizes data variance
for each PC as a bar chart (an example is shown with
our experimental results in Figure 7). The plot indi-
cates whether variables in the data set are correlated
or not. In measurements of uncorrelated variables the
redundancy is low. Hence, the variance in all PCs is
ICSOFT 2024 - 19th International Conference on Software Technologies
212
0
1 1
. . .
1
.
.
.
1
0 0
. . .
1
0
1
0
. . .
1
Generation 0
Gene 0..N
Individuals
n(g
m,0
) n(g
m,1
) n(g
m,2
)
. . .
n(g
m,n
)
µ( f it
m
)
.
.
.
n(g
1,0
) n(g
1,1
) n(g
1,2
)
. . .
n(g
1,n
)
µ( f it
1
)
1 2 1
. . .
3
µ( f it
0
)
Data Format
Generation 0..M
Count of Gene 0..N
Average fitness
Figure 3: Concept of PCA data format.
n(P os
0
)
. . .
n(P os
31
) n(M ag
0
)
. . .
n(Mag
5
) n(Pix
0
)
. . .
n(P ix
3
)
µ(fit)
position
magnitude sub-pixel
(a) EC data format per individual.
n(Star
0
) n(Star
1
) n(Star
2
)
. . .
n(Star
768
) µ(fit)
(b) StarID data format per generation.
Figure 4: Data formats.
Test Cases
Construct
Data Format
EC
Data Format
StarID
Data Format
Aggregate
(mean,
max, min)
EC
MeanMaxMin
StarID
MeanMaxMin
Standardize
Data Format
PCA Inputs
Figure 5: Data preprocessing.
low as well and we have to select a lot of PCs to gain
sufficient information about the data set. In this case,
PCA is not able to reduce the dimensionality of the
original data set. However, if variables are highly cor-
related, measurements are highly redundant and PCA
significantly reduces the data dimensionality. In this
case, the scree plot shows that higher ranked PCs are
associated with most of the data variance.
In addition to the data variance, our scree plot
shows the accumulated variance ratio to provide better
visibility of the required number of PCs to reach a
specific threshold. For example, Figure 7 in Section 5
shows that the first three PCs are associated with more
than
80 %
of the data variance. Thus, the scree plot al-
lows us to quickly decide these three PCs are sufficient
to provide explanations for our GA results.
Loading Bar Chart. PCA loading values represent
the correlation between original variables and calcu-
lated PCs. We generate for each PC of interest a load-
ing bar chart that plots the loading values of the vari-
ables within our data formats. For the EC data format,
we are particularly interested in the correlation be-
tween the fitness variable and the EC variables, and
for the starID data format in the correlation between
the fitness variable and the star ID variables. For ex-
ample, Figures 9 to 11 present the loading values of
the EC data format of our experimental results. The
figure shows that we group the EC variables according
to the corresponding input parameter and highlight
the fitness variable. For the starID data format, we
group stars based on their EC ID for a preselected in-
put parameter and again highlight the fitness variable.
Moreover, we are able to visualize the loading values
for a specific EC as shown in Figure 12 in Section 5.
As a result, the loading bar chart allows us to analyze
which EC or star ID variables vary in the same way as
the average fitness value.
Trajectory Plot. Fyvie et al. propose in (Fyvie et al.,
2021) the concept of PCA to visualize trajectories for
GA results. They transform GA results into PCs and
use the first three PCs to generate a trajectory. The
authors point out that the resulting trajectory does not
reveal the fitness landscape but shows the direction
and magnitude of population variations in the new
subspace. We use the approach to generate a trajectory
of our GA results in the subspace of the first three
PCs. With that, we capture and visualize changes in
the evolution of GA solutions. Using the trajectory,
we can quickly analyze whether the solutions follow
a specific path or whether the solutions are subject
to chance. We extend the approach by highlighting
PCs with the most influence on a specific generation.
Improving Robustness of Satellite Image Processing Using Principal Component Analysis for Explainability
213
To do so, we compare the distances of each PC value
in each generation with the PC value of the former
generation. This allows us to apply a joint analysis of
trajectory plot and loading bar chart. Hence, we know
from the trajectory plot which PC has the most impact
in a generation and are able to understand from the
respective loading bar chart of the PC which variables
correlate with the fitness value.
5 EVALUATION
We evaluate our proposed explainability approach with
the FGS of the PLATO mission. The main goal is
to gain insights into the evolutionary process of the
genetic test generation, and in turn to gain a deeper
understanding of the most critical inputs and the FGS
algorithm itself. A known behavior of the FGS algo-
rithm is that in some cases, jitter in the input data has
a strong influence on the accuracy of the results. To
validate our PCA approach, we have defined a novel fit-
ness function, which explicitly searches for test cases
where the jitter does have strong influence on the cal-
culated FGS attitude. With the new fitness function,
the test generation algorithm searches for critical test
inputs with respect to the jitter influence. To show
the applicability of our explainability approach, we
aim at a better understanding for which input stars the
accuracy of the FGS drops for some jittered inputs and
are thus suited for robustness testing.
In the following, we first present our novel fitness
function that encodes the influence of the jitter on the
mathematical accuracy of the FGS. Then, we briefly
summarize the main characteristics of the implemen-
tation of our PCA approach and the configuration of
the genetic test generation algorithm we have used in
the experiments. Finally, we present our experimental
results from running the PCA on the test generation
algorithm results and show the visualizations.
5.1 Adaptation of the Test Generation
Approach
In (Witteck et al., 2020), the authors define a fitness
function that searches for test cases that provoke long
execution times or a low accuracy, represented by a
high quality index. This is a well-suited approach for
robustness testing, as mission-critical behavior is de-
tected. However, the newest version of the PLATO
FGS has deterministic execution times. Furthermore,
while it is useful to search for test cases that provoke a
high quality index to specifically target the mathemat-
ical accuracy of the algorithm, it is highly desirable
Dash app
Python
Plot PCA
dataframes
pandas; plotly
Preprocessing
Python
Process HDF5-Files
H5py; pandas;
scikit-learn
PCA
Python
Process
dataframes
pandas; numpy.svd
GA-PCA
GA HDF5-Files
Preprocessed
dataframes
PCA dataframes
Figure 6: Overview of the implementation.
to identify star combinations where input jitter has a
strong influence on the calculated FGS attitude.
In this paper, we present a novel fitness function
for the genetic test approach based on the FGS atti-
tude error. We first calculate for each FGS exposure
the deviation between the jitter inserted in the image
data and the jitter of the calculated attitude data. We
express the deviation as euler angles
(x,y,z)
in milliarc-
seconds. Then, we calculate the standard deviation of
each angle over all exposures. The fitness value
f it
of
an individual is determined with
f it =
r
σ
2
x
+ σ
2
y
+
σ
z
4
2
, (5)
where
σ
is the standard deviation for all angles. Each
angle represents the jitter deviation per exposure. In
the context of PLATO, the rotations around the
x
-,
y
-
and
z
-axis are the raw, pitch and roll angles of the
satellite. According to internal PLATO specifications,
roll angle errors affect point shifts on the cameras field
of view by factor of four.
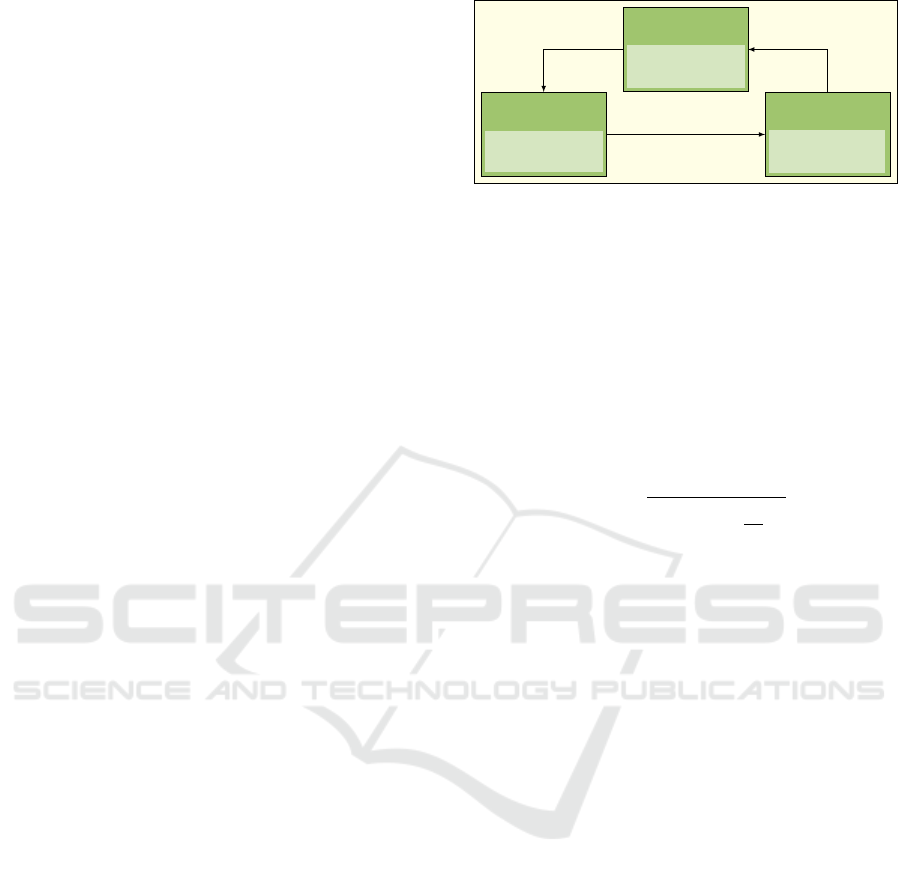
5.2 PCA Implementation
We have designed our implementation in such a way
that we are able to process GA results of the developed
test framework presented in (Witteck et al., 2020). We
have implemented our PCA in Python 3. For scalabil-
ity we offer the usage of our tool rendered in a web
browser or by using the command line interface. The
tool is deployed on an x86-64 Ubuntu 18.04 machine.
Figure 6 shows the structure of our implementation.
We use Dash, a framework developed by Plotly (Plotly
Technologies Inc., 2015) to build data applications,
for our web application. Since the test framework
stores the GA results in an HDF5 data format (The
HDF Group, 2006), we use the python library H5py to
read the data. Our application generates preprocessed
data formats by means of pandas (The pandas devel-
opment team, 2022) and uses scikit-learn (Pedregosa
et al., 2011) to standardize the data. Further, we use
the SVD implementation in the numpy (Harris et al.,
2020) package to perform the PCA.
ICSOFT 2024 - 19th International Conference on Software Technologies
214
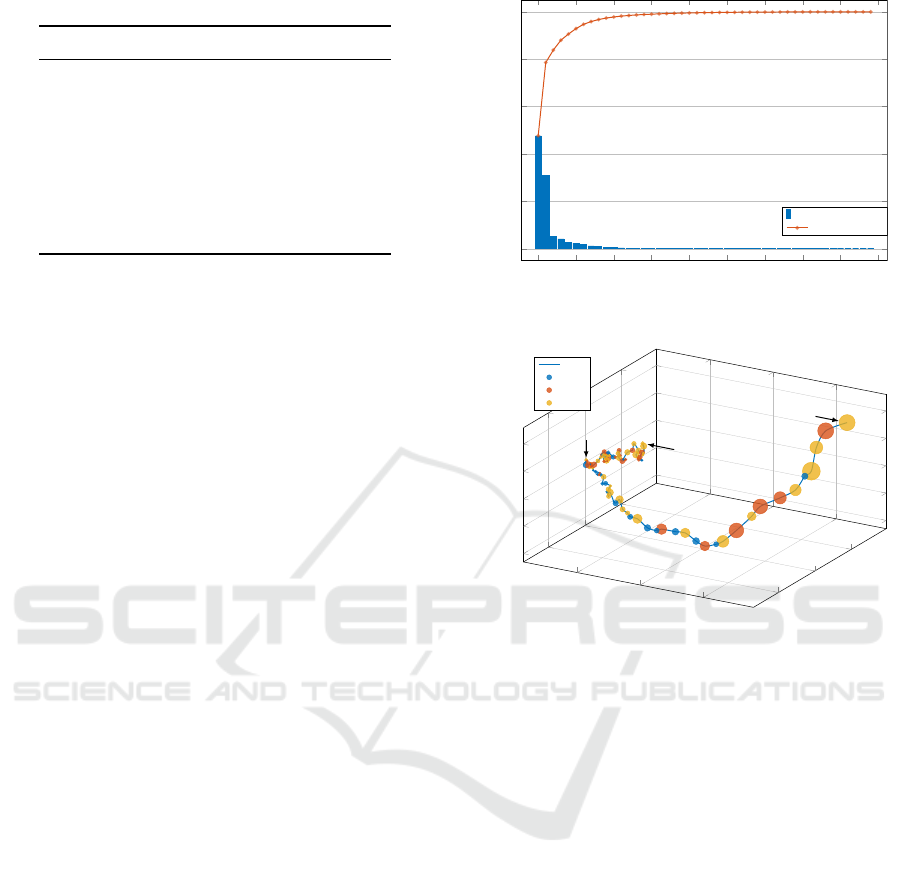
Table 1: Default GA configuration.
Parameter Value
FGS exposures 1000
Population size 100
Number of genes 30
Crossover probability 0.5
Mutation probability 0.06
Tournament size 7
Maximum generation number 100
Repetition number 10
5.3 GA Configuration
The search space of our GA is based on a test suite of
768 stars. Each star is described by three input parame-
ters: position on the FPA in pixel, e.g. (1969.4, 322.5),
magnitude, e.g. 6.5, and sub-pixel position in pixel,
e.g. (0.9, 0.4). Since the test suite covers all EC combi-
nations, the number of star results from the number of
input parameter EC (see Figure 1): 32 classes for the
position on the FPA, 6 classes for the magnitude, and
4 classes for the sub-pixel position. For each star, we
simulate 1000 images of
6 pixel × 6 pixel
as input of
the FGS algorithm. During our experiments, we used
the parameters in Table 1 as default GA configuration.
5.4 Experimental Results
In our experiments, we ran the GA 10 times with the
configuration shown in Table 1. Our goal was to find
test cases that increase the jitter deviation of the FGS
attitude. The resulting average fitness value in the last
generation over all runs was
∼19.14 milliarcseconds
.
This is a significant increase over the average fitness
value of
∼5.56 milliarcseconds
in the first generation.
Thus, the GA has successfully generated test cases that
provoke high jitter deviation.
To gain a better understanding which input star
parameters or EC combinations are responsible for
increased jitter deviation, we have transformed the GA
results into our starID data format as well as EC data
format and have performed the PCA on our GA results.
The resulting scree plot, trajectory, and PC loading
values are shown in Figures 7 to 11.
The scree plot in Figure 7 shows that most data
variation is explained in PC1 and PC2. Together with
PC3 the PCs captures
83.86 %
of the explained vari-
ance. This means that the PCA successfully reduces
the dimensionality of the input space and is suitable to
generate explanations for the evolutionary test process.
The trajectory of our experimental data in Figure 8
illustrates the average direction of the GA populations
over all runs. The trajectory depicts a steady devel-
0 5 10 15 20 25 30 35 40 45
0
0.2
0.4
0.6
0.8
1
Principal Components
Variance Ratio
PC Variance
Accu. Variance
Figure 7: Jitter deviation fitness - scree plot.
0
5
10
−5
0
5
−4
−2
0
2
4
first generation
last generation
generation 45
PC1
PC2
PC3
Path
PC1
PC2
PC3
Figure 8: Jitter deviation fitness - trajectory.
opment along the PC1 axis, but also temporary direc-
tional changes along axes PC2 and PC3. Figure 8
shows that the evolution along the PC1 axis decreases
after generation 45. The fitness value of generation
45 is
∼17.86 milliarcseconds
, which is
90.75 %
of the
GA’s explored fitness. As the trajectory shows, the GA
performed most of the individual evolution until this
point and is only able to optimize the next generations
to a lesser extent.
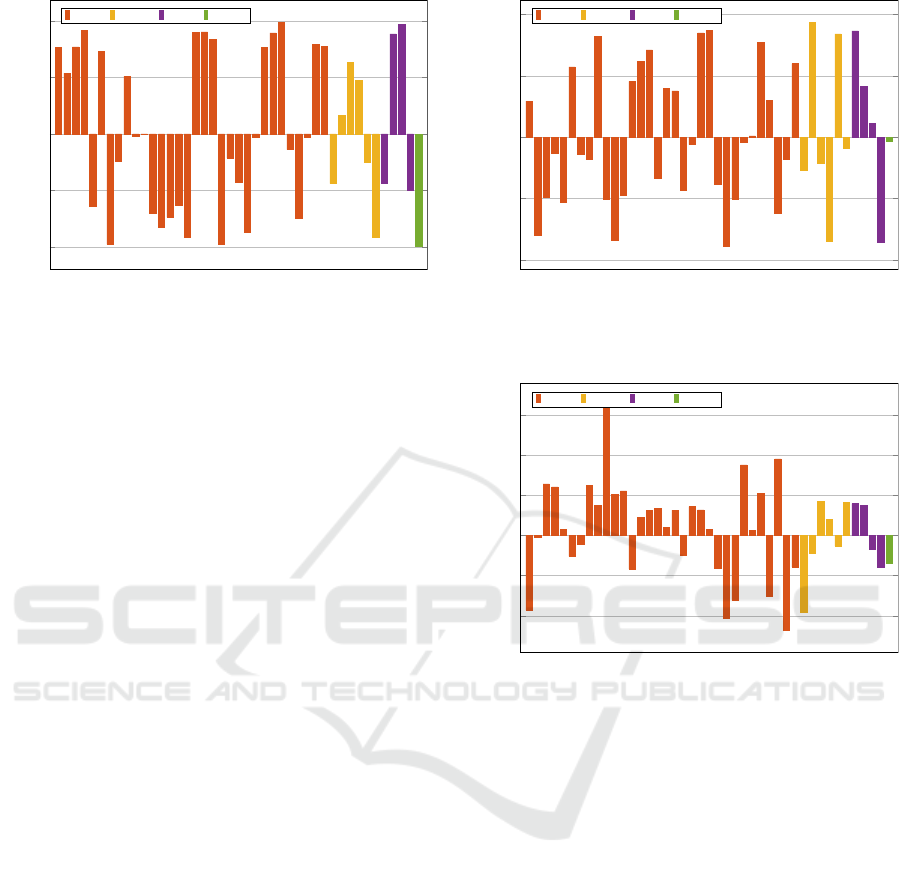
The loading value of the fitness value in PC1 shown
in Figure 9 suggests that negative values along the PC1
axis correspond to strong improvements of the fitness
value. We can therefore infer from the figure that
stars positioned on the lower left part of the FPA (ref.
Figure 1a), with high and low magnitude (Mag-00 and
Mag-05) as well as sub-pixel positions in the center
and on the corner (Pix-00 and Pix-03) correlate with
a high fitness value. After analyzing the Point Spread
Function (PSF) shapes of the test stars, we have seen
that stars located on the lower left part of the FPA have
a wide shape due to optical aberrations. Since wide
PSF shapes lead to inaccurate centroid estimations,
the jitter of the calculated attitude is high as well. A
further reason for selecting these EC is the distribution
of stars on the FPA. Close star positions lead to a high
Improving Robustness of Satellite Image Processing Using Principal Component Analysis for Explainability
215
Pos-00
Pos-01
Pos-02
Pos-03
Pos-04
Pos-05
Pos-06
Pos-07
Pos-08
Pos-09
Pos-10
Pos-11
Pos-12
Pos-13
Pos-14
Pos-15
Pos-16
Pos-17
Pos-18
Pos-19
Pos-20
Pos-21
Pos-22
Pos-23
Pos-24
Pos-25
Pos-26
Pos-27
Pos-28
Pos-29
Pos-30
Pos-31
Mag-00
Mag-01
Mag-02
Mag-03
Mag-04
Mag-05
Pix-00
Pix-01
Pix-02
Pix-03
Fitness
−1
−0.5
0
0.5
1
Equivalence Classes
PC1
Pos-EC Mag-EC Pix-EC Fitness
Figure 9: Loading values for PC1.
roll angle error (Grießbach et al., 2021) and thus lead
to high residual noise of the estimated star centroids.
We generally expect more faint stars (high magni-
tude) in the resulting star combination, since they have
less information for centroid estimation than bright
stars (Grießbach et al., 2021). However, the loading
values show that besides faint stars in Mag-00, also
brighter stars in Mag-04 and Mag-05 correlate with
the fitness value. If we consider the magnitude and the
position of a star together, we find that the signal of
bright stars with a wide PSF shape is evenly distributed
over many pixels but the signal-to-noise ratio is low.
This provides a good explanation why the centroid
estimation is less accurate.
Figure 9 shows that stars in Pix-00 (pixel center)
and Pix-03 (pixel corner) lead to a high fitness value.
We expect a high fitness value if a star is located on the
pixel corner, since the centroid may move to neighbor-
ing pixels due to jitter movement and therefore cause
deviations in the pixel illumination. However, a star
position in the pixel center leads to a low amount of
signal in neighboring pixel since the star’s flux is only
distributed in a few pixel. A low number of pixel con-
taining star information leads to a decreased precision
of the star position estimation (Grießbach et al., 2021).
This applies especially to faint stars and gives an ex-
planation for the GA results. However, we did not
expect stars located in the pixel center to have same
correlations to the fitness value as stars on the pixel
corner. The results give reason to review the effect and
the definition of the pixel ECs in future work.
The loading values of PC1 in Figure 9 indicates
that the star position on the FPA was the driver of the
GA evolution in the first 45 generations. Because the
loading values show that the GA selects no specific
magnitude or pixel value but rather faint and bright
stars as well as stars located in the pixel center and
pixel corner. The trajectory in Figure 8 shows that
Pos-00
Pos-01
Pos-02
Pos-03
Pos-04
Pos-05
Pos-06
Pos-07
Pos-08
Pos-09
Pos-10
Pos-11
Pos-12
Pos-13
Pos-14
Pos-15
Pos-16
Pos-17
Pos-18
Pos-19
Pos-20
Pos-21
Pos-22
Pos-23
Pos-24
Pos-25
Pos-26
Pos-27
Pos-28
Pos-29
Pos-30
Pos-31
Mag-00
Mag-01
Mag-02
Mag-03
Mag-04
Mag-05
Pix-00
Pix-01
Pix-02
Pix-03
Fitness
−1
−0.5
0
0.5
1
Equivalence Classes
PC2
Pos-EC Mag-EC Pix-EC Fitness
Figure 10: Loading values for PC2.
Pos-00
Pos-01
Pos-02
Pos-03
Pos-04
Pos-05
Pos-06
Pos-07
Pos-08
Pos-09
Pos-10
Pos-11
Pos-12
Pos-13
Pos-14
Pos-15
Pos-16
Pos-17
Pos-18
Pos-19
Pos-20
Pos-21
Pos-22
Pos-23
Pos-24
Pos-25
Pos-26
Pos-27
Pos-28
Pos-29
Pos-30
Pos-31
Mag-00
Mag-01
Mag-02
Mag-03
Mag-04
Mag-05
Pix-00
Pix-01
Pix-02
Pix-03
Fitness
−0.4
−0.2
0
0.2
0.4
0.6
Equivalence Classes
PC3
Pos-EC Mag-EC Pix-EC Fitness
Figure 11: Loading values for PC3.
after generation 45, PC2 becomes more important.
The loading values of PC2 in Figure 10 indicate that
stars located on the pixel corner (Pix-03) lead to a
high fitness value. In contrast to PC1, the stars are
more distributed on the FPA. It is obvious that the GA
improves the fitness by selecting stars based on their
pixel position. We observe from the trajectory that
in the last generations, PC3 dominates. The loading
values of PC3 in Figure 11 indicate that the GA mainly
selects faint stars located on the outer FPA to increase
the fitness value.
In summary, the PCA extracts relevant information
from our GA results such that we are able to find useful
explanations for the evolutionary test process. We can
conclude that stars positioned on the lower left part
of the FPA, with high or low magnitude as well as
sub-pixel positions in the center and on the corner are
critical for the precision of the FGS and are therefore
suitable as test cases for FGS robustness tests.
ICSOFT 2024 - 19th International Conference on Software Technologies
216
Detection of Errors. So far, we have only evaluated
the PCA results on the EC data format. Since both
data formats preprocess the same GA results and an
EC combination is related to a star ID, the results from
the starID data format highlight the same ECs as the
results from the EC data format. Therefore, we use the
EC data format to show a more detailed view on the
effect of specific input parameters.
However, the PCA results on the starID data format
provides a view on the evolutionary process that is
tailored to understand the role of particular stars. We
have grouped the loading values for the starID data
format based on star parameters to record trends in
the parameter ECs. By comparing the loading values
of both data formats, we have detected some cases,
where the PCA results for the starID data format do
not match with the understanding gained from the EC
data format. Interestingly, this means that we have
identified cases where star loading values should not
correlate with the fitness loading value according to
the analysis performed on the EC data format, but still
lead to a high jitter deviation, as shown by their high
correlation with the fitness loading value on the starID
data format and the other way around.
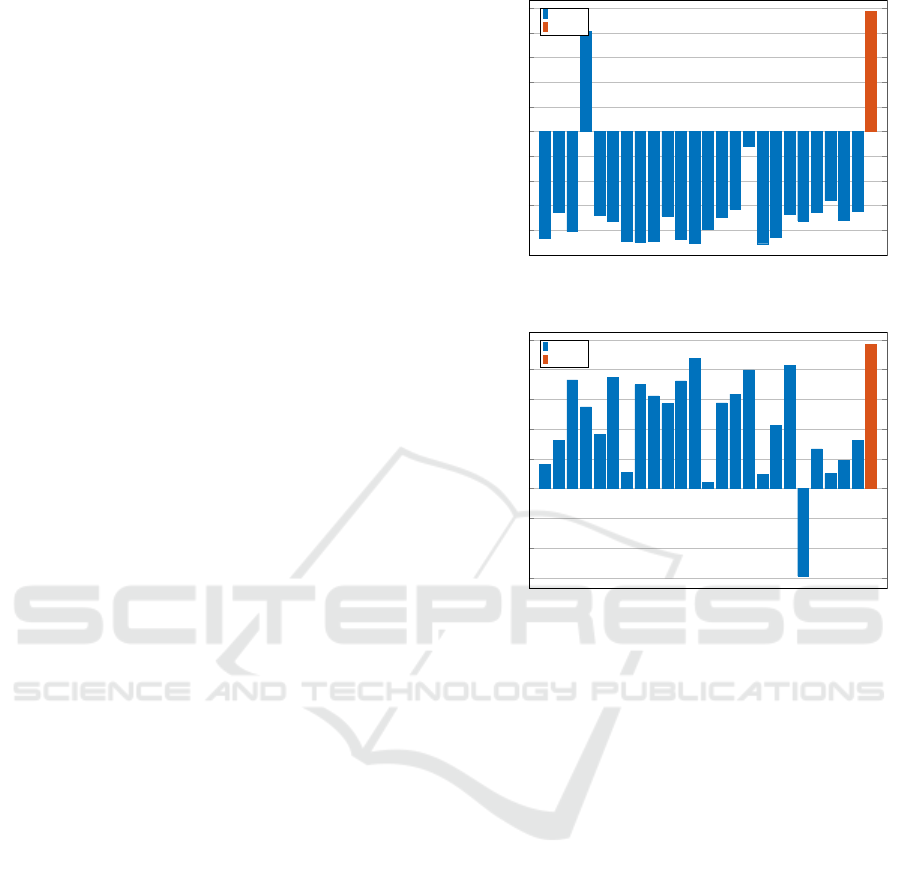
From Figure 9, we see that the FPA position class
Pos-16 does not correlate with the fitness value, but
Pos-20 does. Considering the loading values of the
starID data format grouped for ECs Pos-16 in Fig-
ure 12a and Pos-20 in Figure 12b we notice that the
majority of the loading values show the same behavior
to the fitness value as Figure 9. However, Figure 12a
depicts a high correlation between star ID 387 that
belongs to Pos-16 and the fitness value. Moreover,
we see in Figure 12b that star ID 499 in Pos-20 does
not correlate with the fitness value. After a closer
analysis of the calculated star centroid position, we
have detected an error in a coordinate transformation
that affected a few stars. The error leads to an incor-
rect attitude and thus to an exceptional fitness value.
The visualizations and explanations generated from
the PCA on the starID data format proved to be very
helpful to detect and fix the error in the FGS algorithm.
6 CONCLUSION
In this paper, we have presented an approach for post-
hoc explainability of genetic test generation algorithms.
Our key contributions are two novel data formats to
prepare the data generated by the genetic test genera-
tion algorithm for a PCA, a technique to apply a PCA
to these data formats, as well as a method to visualize
and evaluate the resulting data. Our approach simpli-
fies the analysis of test cases generated by the GA and
401
398
399
400
402
397
404
405
406
407
403
396
384
394
385
386
387
388
395
390
391
392
393
389
−1
−0.8
−0.6
−0.4
−0.2
0
0.2
0.4
0.6
0.8
1
Star ID’s
PC1
Pos-16
Fitness
(a) StarID loading values, Pos-16.
494
503
502
501
500
499
498
497
496
495
493
492
491
481
482
483
484
485
480
487
488
489
490
486
−0.6
−0.4
−0.2
0
0.2
0.4
0.6
0.8
1
Star ID’s
PC1
Pos-20
Fitness
(b) StarID loading values, Pos-20.
Figure 12: Loading values per starID.
enables us to identify parameters that influence the GA
solution. This makes it possible to reveal explanations
why the test generation algorithm has chosen certain
inputs and input combinations. These explanations
increase the confidence in the generated test cases and
can be used to gain a deeper understanding of the test
generation process and the system under test.
We have applied our proposed approach to the FGS
of the PLATO mission. The FGS computes the atti-
tude of the satellite from given images of input stars.
We have used an existing GA together with a novel
fitness function to search for input star combinations
where jitter has a high influence on the precision of the
results. Then, we have used our novel explainability
approach to identify which input stars mostly influ-
ence the precision of the FGS algorithm. Moreover,
the results helped to find an error in the FGS algorithm
that affected only a few stars.
In future work, we plan to use our explainability
approach also to identify stars that are particularly well
suited as guide stars for the FGS of the PLATO mission.
Further, we plan to investigate other approaches such
as MAP-Elites and surrogate fitness functions.
Improving Robustness of Satellite Image Processing Using Principal Component Analysis for Explainability
217

REFERENCES
Brownlee, A., Wallace, A., and Cairns, D. (2021). Min-
ing markov network surrogates to explain the results of
metaheuristic optimisation. In SICSA eXplainable Artif-
ical Intelligence Workshop 2021, pages 64–70. CEUR
Workshop Proceedings.
Deb, K., Bandaru, S., Greiner, D., Gaspar-Cunha, A., and
Tutum, C. C. (2014). An integrated approach to auto-
mated innovization for discovering useful design prin-
ciples: Case studies from engineering. Applied Soft
Computing, 15:42–56.
Do
ˇ
silovi
´
c, F. K., Br
ˇ
ci
´
c, M., and Hlupi
´
c, N. (2018). Ex-
plainable artificial intelligence: A survey. In 2018 41st
International convention on information and commu-
nication technology, electronics and microelectronics
(MIPRO), pages 0210–0215. IEEE.
European Space Agency (2022). ESA - cosmic vi-
sion. https://www.esa.int/Science Exploration/Space
Science/ESA s Cosmic Vision.
Fyvie, M., McCall, J. A., and Christie, L. A. (2021). To-
wards explainable metaheuristics: Pca for trajectory
mining in evolutionary algorithms. In International
Conference on Innovative Techniques and Applications
of Artificial Intelligence, pages 89–102. Springer.
Grießbach, D., Witteck, U., and Paproth, C. (2021). The fine
guidance system of the PLATO mission. In Cugny, B.,
Sodnik, Z., and Karafolas, N., editors, International
Conference on Space Optics — ICSO 2020, volume
11852, page 118523H. International Society for Optics
and Photonics, SPIE.
Harris, C. R., Millman, K. J., van der Walt, S. J., Gommers,
R., Virtanen, P., Cournapeau, D., Wieser, E., Taylor,
J., Berg, S., Smith, N. J., Kern, R., Picus, M., Hoyer,
S., van Kerkwijk, M. H., Brett, M., Haldane, A., del
R
´
ıo, J. F., Wiebe, M., Peterson, P., G
´
erard-Marchant,
P., Sheppard, K., Reddy, T., Weckesser, W., Abbasi,
H., Gohlke, C., and Oliphant, T. E. (2020). Array
programming with NumPy. Nature, 585(7825):357–
362.
Holzinger, A. (2021). The next frontier: Ai we can re-
ally trust. In Joint European conference on machine
learning and knowledge discovery in databases, pages
427–440. Springer.
Islam, M. R., Ahmed, M. U., Barua, S., and Begum, S.
(2022). A systematic review of explainable artificial
intelligence in terms of different application domains
and tasks. Applied Sciences, 12(3):1353.
Lipton, Z. C. (2018). The mythos of model interpretability:
In machine learning, the concept of interpretability is
both important and slippery. Queue, 16(3):31–57.
Martin Pertenais, P. P. T. (2022). Instrument technical re-
quirement document. PLATO-DLR-PL-RS-0001.
Mirjalili, S., Lewis, A., and Mostaghim, S. (2015). Con-
fidence measure: a novel metric for robust meta-
heuristic optimisation algorithms. Information Sci-
ences, 317:114–142.
Mouret, J.-B. and Clune, J. (2015). Illuminating search
spaces by mapping elites. arXiv e-prints, pages arXiv–
1504.
Pedregosa, F., Varoquaux, G., Gramfort, A., Michel, V.,
Thirion, B., Grisel, O., Blondel, M., Prettenhofer, P.,
Weiss, R., Dubourg, V., Vanderplas, J., Passos, A.,
Cournapeau, D., Brucher, M., Perrot, M., and Duch-
esnay, E. (2011). Scikit-learn: Machine learning
in Python. Journal of Machine Learning Research,
12:2825–2830.
Plotly Technologies Inc. (2015). Collaborative data science.
https://plot.ly.
Reris, R. and Brooks, J. P. (2015). Principal component
analysis and optimization: A tutorial. 14th INFORMS
Computing Society Conference, pages 212–225.
Shlens, J. (2014). A tutorial on principal component analysis.
arXiv preprint arXiv:1404.1100.
Stambke, J. (2023). Principal component analysis for ex-
plainability of genetic test generation in satellite image
processing.
The HDF Group (2006). Hierarchical Data Format, version
5. https://github.com/HDFGroup/hdf5.
The pandas development team (2022). pandas-dev/pandas:
Pandas. https://doi.org/10.5281/zenodo.4309786.
Urquhart, N., Guckert, M., and Powers, S. (2019). Increasing
trust in meta-heuristics by using map-elites. In Pro-
ceedings of the Genetic and Evolutionary Computation
Conference Companion, pages 1345–1348.
Urquhart, N., H
¨
ohl, S., and Hart, E. (2021). Automated,
explainable rule extraction from map-elites archives.
In International Conference on the Applications of
Evolutionary Computation (Part of EvoStar), pages
258–272. Springer.
Wallace, A., Brownlee, A. E., and Cairns, D. (2021). To-
wards explaining metaheuristic solution quality by data
mining surrogate fitness models for importance of vari-
ables. In International Conference on Innovative Tech-
niques and Applications of Artificial Intelligence, pages
58–72. Springer.
Witteck, U., Grießbach, D., and Herber, P. (2019). Equiva-
lence class definition for automated testing of satellite
on-board image processing. In International Confer-
ence on Software Technologies, pages 3–25. Springer.
Witteck, U., Grießbach, D., and Herber, P. (2020). A genetic
algorithm with tournament selection for automated
testing of satellite on-board image processing. In Inter-
national Conference on Software Technologies, pages
134–157. Springer.
Wu, W., Massart, D., and de Jong, S. (1997). The kernel
pca algorithms for wide data. part i: Theory and al-
gorithms. Chemometrics and Intelligent Laboratory
Systems, 36(2):165–172.
Xu, F., Uszkoreit, H., Du, Y., Fan, W., Zhao, D., and Zhu,
J. (2019). Explainable ai: A brief survey on history,
research areas, approaches and challenges. In CCF in-
ternational conference on natural language processing
and Chinese computing, pages 563–574. Springer.
ICSOFT 2024 - 19th International Conference on Software Technologies
218
