
Assessing the Risks of Enhancing the Current Europe’s ADA Web Map
with Ground Movement Classification Data
Jos
´
e A. Navarro
a
, Anna Barra
b
and Mar
´
ıa Cuevas-Gonz
´
alez
c
Centre Tecnol
`
ogic de Telecomunicacions de Catalunya-CERCA, Parc Mediterrani de la Tecnologia – Building B4,
Av. Carl Friedrich Gauss 7, 08860 Castelldefels, Spain
Keywords:
Active Deformation Areas, EGMS, Geoprocessing, Ground Movement Classification, Open-Source, Web
Map.
Abstract:
The European Ground Motion Service is offering data on ground movement across Europe with millimetre
precision. With the intention of helping in the interpretation of such a large volume of data, the CTTC has al-
ready created an online Active Deformation Areas (ADA) web map, which can be consulted freely. The CTTC
is considering the possibility of enhancing the said web map by including the causes explaining why ADAs
occur. This article presents the changes in the self-developed ADAtools to make possible such enhancement
and analysis of the impacts on the current implementation of the web map as well as an early assessment of
the risks that such changes would imply.
1 INTRODUCTION
The European Ground Motion Service (EGMS) (Eu-
ropean Environment Agency, 2021b; Crosetto et al.,
2020) has made available to the public the deforma-
tion measurements of practically all of Europe. Three
levels of products are distributed, namely: (a) the ba-
sic one, which consists of line-of-sight (LOS) velocity
maps referred to a local reference point for both as-
cending and descending orbits, (b) the calibrated one,
which is obtained by correcting the data of the ba-
sic product using a model derived from data from the
Global Navigation Satellite Service (GNSS) as a ref-
erence, and finally, (3) Ortho, which consists of the
horizontal and vertical displacements calculated from
the reference data.
This constitutes a real plethora of information that
allows for continental-scale projects to be undertaken.
However, the interpretation of these data as they are
available is difficult and complex, and it is conve-
nient to use tools that offer a higher level of abstrac-
tion and consequently facilitate their understanding.
The ADAtools have been carrying out this type of
task since 2018; the most notable tasks they are capa-
ble of performing are (a) identifying Active Deforma-
a
https://orcid.org/0000-0001-7877-1516
b
https://orcid.org/0000-0001-6254-7931
c
https://orcid.org/0000-0002-4988-5669
tion Areas (ADAs) (Barra et al., 2017; Navarro et al.,
2020) and (b) classifying said areas according to up
to four different processes (subsidence, constructive
settlement, sinkhole, and landslide).
Initially, the ADAtools were used to process ar-
eas of limited extension—that is, what could be clas-
sified as local or regional projects. Since the ap-
pearance of the EGMS data, it has been possible
to address continental-level targets. One example is
the calculation of ADAs for all of Europe with the
data available between 2015 and 2020, the first de-
livery of the named EGMS baseline: the European
ADA web map (Navarro et al., 2022; Navarro et al.,
2023) (see Figure 1); another project, currently on-
going, is aimed at the generation of wide-area differ-
ential deformation maps (Shahbazi et al., 2023) indi-
cating the gradient of the deformation field, also from
EGMS basic products and again covering mostly all
Europe—although, at the moment of writing this pa-
per, only a small part of Spain has been published.
These two projects have been materialized as web
maps and WMS / WMF layers. Both web maps may
be accessed at https://groundmotionadas.com/.
The EGMS is committed to update the informa-
tion it delivers on a regular basis; this makes possi-
ble (and advisable) to update, as well, the European
ADA web map, incorporating the new information
available. Since this means that the ADAs for all Eu-
rope should have to be recomputed, this situation may
Navarro, J., Barra, A. and Cuevas-González, M.
Assessing the Risks of Enhancing the Current Europe’s ADA Web Map with Ground Movement Classification Data.
DOI: 10.5220/0012720900003696
Paper published under CC license (CC BY-NC-ND 4.0)
In Proceedings of the 10th International Conference on Geographical Information Systems Theory, Applications and Management (GISTAM 2024), pages 195-202
ISBN: 978-989-758-694-1; ISSN: 2184-500X
Proceedings Copyright © 2024 by SCITEPRESS – Science and Technology Publications, Lda.
195
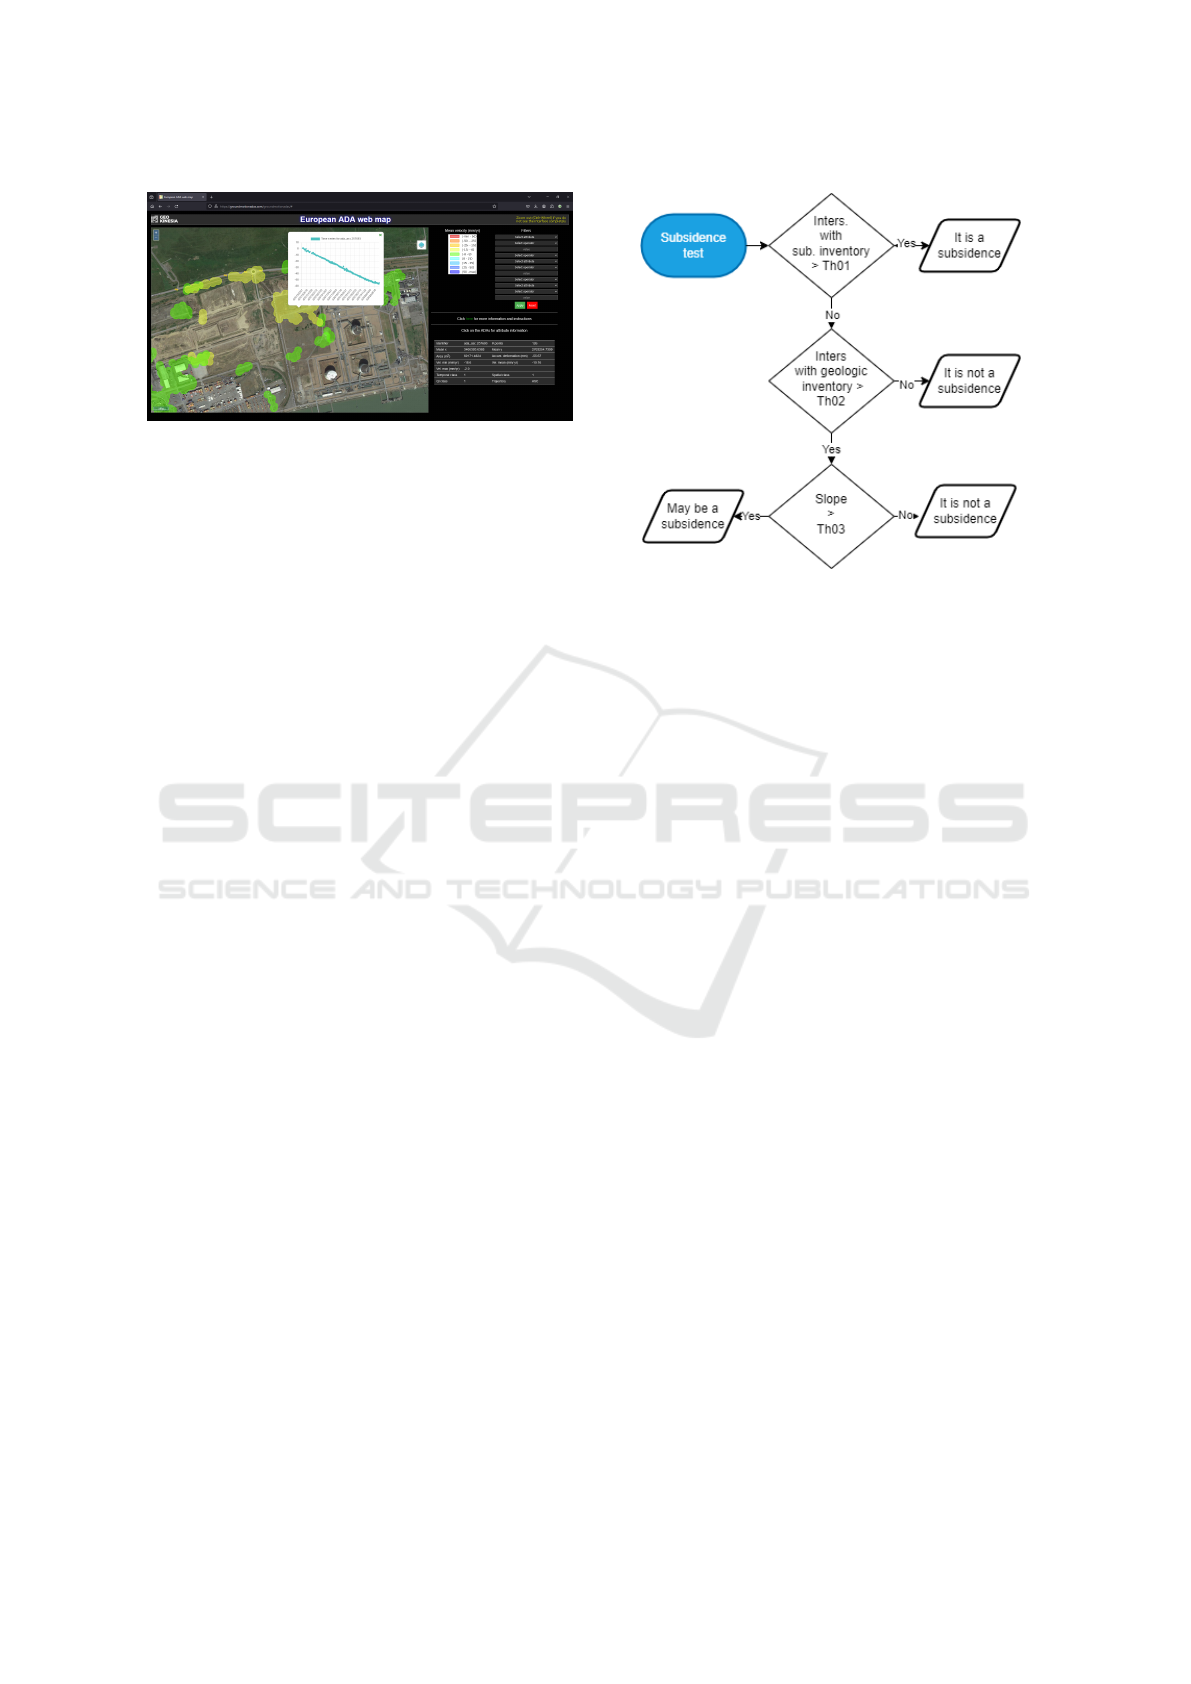
Figure 1: The web map for the ADAs of all Europe
(https://groundmotionadas.com/).
be seen as an opportunity to reconsider what kind of
ADA data the new version of the web map could in-
clude. The authors believe that the most relevant data
to consider would be the reason why ADAs occur—
that is, what kind of ground movement process is pro-
ducing these.
The next sections will describe what challenges
(in terms of risk) that such changes would imply, con-
sidering the tools to use or develop, the impact on
the current data production workflow and hardware
resources.
2 THE TOOLS
The workhorse to produce the ADAs and afterwards
their classification is the ADAtools toolset (Barra
et al., 2017; Navarro et al., 2020). The main tools
involved in the process are ADAfinder and ADAclas-
sifier.
ADAfinder takes care of identifying the ADAs. It
takes the Measurement Points (MP) distributed by the
EGMS as input, producing the polygons defining the
said ADAs as well as some data characterizing them,
such as their mean velocity, area, or an assessment
of the quality of the finding—that is, how probable
is that the area identified as active be active indeed.
ADAfinder is a seasoned, reliable tool, used in many
projects since 2018. Therefore, the authors consider
that it may be used for this new project in its current
state.
ADAclassifier starts where ADAfinder ends. It
takes the ADAs produced by ADAfinder and runs a
series of tests to determine, for each of these ADAs,
what is the kind of ground movement process that
most probably caused it. Up to four different pro-
cesses were checked by the original version of this
tool: subsidence, constructive settlement, sinkhole,
and landslide. To do it, it implemented a single de-
cision subtree for each of these processes. Figure 2
depicts the one used by the landslide classification
Figure 2: Single decision tree for landslides in the old ver-
sion of ADAclassifier.
process. These trees relied on several datasets and
thresholds (denoted as “Th01”, “Th02” and “Th03”
in the said figure) provided as inputs by the user. The
datasets include a digital terrain model, several kinds
of inventories (for subsidences, constructive settle-
ments, sinkholes, and landslides as well as a geologic
map) and horizontal displacement data. Most of these
inputs are optional, but their absence will make some
of the checks unavailable.
Note that, unlike ADAfinder, the original version
of ADAclassifier was not a seasoned tool. In fact, it
had some limitations and problems that prevented the
authors to use it “as is” in this project. The next sec-
tion explains why.
3 IMPROVING ADAclassifier
ADAclassifier, the tool of the ADAtools in charge of
classifying the different phenomena of ground move-
ments, suffered from a series of defects that advised to
improve or replace it before undertaking any massive
data processing campaign if the risk of generating in-
correct data was to be avoided. The most important
defects were the following:
• All tests relied on the consultation of inventories
(such these for landslides or sinkholes). The per-
formance observed when querying the inventories
was far from satisfactory. The reason, a non-
optimal implementation of the polygon intersec-
tion search algorithms. In fact, said performance
was of order n × m, where n and m represent, re-
spectively, the number of polygons to be queried
(ADAs) and the polygons available in the inven-
tory. Since the implementation of the inventory
GISTAM 2024 - 10th International Conference on Geographical Information Systems Theory, Applications and Management
196

software was the same for all inventories the per-
formance problem affected all classification pro-
cesses. This meant that processing a single EGMS
burst could take about 4 hours; this might be per-
fectly valid to process a small area, but consider-
ing that there are about 15,000 EGMS bursts, the
time required to finish the processing of all data
would take about 2,500 days working non-stop.
This problem alone would make the project un-
feasible.
• Decision trees were too simple, due to the early
stage of development of the concept when ADA-
classifier was first implemented. The concurrence
of different factors that could influence the classi-
fication process was not considered. On the con-
trary and based on a relatively small number of
data and thresholds, an attempt was always made
to reach a conclusive decision regarding the type
of ground movement process that was being ver-
ified. This can be seen in Figure 2, which shows
the unique decision tree for the landslide detection
process in the old version of ADAclassifier. Note
that the trees for the rest of the processes were of
similar simplicity.
• The data formats accepted for certain types of in-
formation were limited or not very widespread.
For example, horizontal displacement data was
accepted in the format generated by los2hv only
(los2hv is another tool included in the ADAtools
that computes the separate horizontal and ver-
tical components plus the total displacement of
the ground displacement measured with Persis-
tent Scatterer Interferometry (PSI) technologies
along the satellite’s line of sight); the digital ter-
rain models could only be used in the ENVI native
format.
• The uplift detection process was not implemented.
The defects mentioned have a clear impact on three
important cornerstones: performance, reliability, and
flexibility of the tool. To address these shortcom-
ings, ADAclassifier has undergone a deep revision
and improvement process. Obviously, the improve-
ments were aimed at eliminating or mitigating the
mentioned defects: the performance of searches in
the inventories now work in logarithmic instead of
quadratic times, so processing a burst takes, usually,
just a few minutes; new formats have been added,
such as the popular GeoTIFF for storing horizontal
and/or vertical displacement data as well as for dig-
ital terrain models. Additionally, the uplift detection
process has been incorporated.
The improvements in the performance of this tool
seems to make possible the processing of all Europe.
The tests carried out seem to point in this direction;
however, the authors are not sure that this perfor-
mance will be maintained uniformly for all available
bursts from the EGMS, since such performance de-
pends on several factors; one of them, for instance, is
the complexity of inventories—tests have shown that
when these include polygons with a very high number
of vertices (apparently, more than 10,000) the perfor-
mance is degraded, due to the increased complexity
of the intersection operations.
Besides performance, the most important change
is the one related to the reliability of the results. The
new version of ADAclassifier now incorporates a set
of decision subtrees, and not just one tree, for each
of the ground movement processes it checks; for in-
stance, the test to decide whether an ADA is a land-
slide consists of four decision sub-trees instead of just
one. In this way, a much larger set of factors that may
have some impact when deciding whether an ADA
corresponds to a certain process can be checked in
a non-exclusive way. Each of these subtrees gener-
ates a score; the scores of each subtree are added,
thus reaching a final, total score, that collects much
more information than that provided by the old, orig-
inal ADAclassifier trees. Based on the total score, a
class is assigned to the ADA. The classes are “It is
not X”, “It may be X”, “It should be X” and “It is X”,
where “X” stands for the different kinds of ground
movement processes.
Figure 3 depicts just one of the four decision
subtrees used in the landslide classification process.
There, “ThLa04” stands for some threshold input by
the user and the numbers on the leaves stand for the
points scored by each one. Conditions such as “As-
pect in A” or “VLOS is consistent with aspect” sum-
marize some checks that are explained in the applica-
tion’s user guide.
With these changes, the authors believe that the
new ADAclassifier could be a suitable tool for mass
data production. This, however, must be confirmed
in the near future, processing more datasets to gather
more performance data for this tool. Therefore, the
authors perceive a risk here that should be addressed
before taking any steps towards the implementation
of this enhancement.
4 AUTOMATING THE MASS
PRODUCTION PROCESS
The transition from processing a small number of
datasets to handling information on a continental
scale necessitates the identification and resolution of a
novel set of challenges before embarking on produc-
Assessing the Risks of Enhancing the Current Europe’s ADA Web Map with Ground Movement Classification Data
197
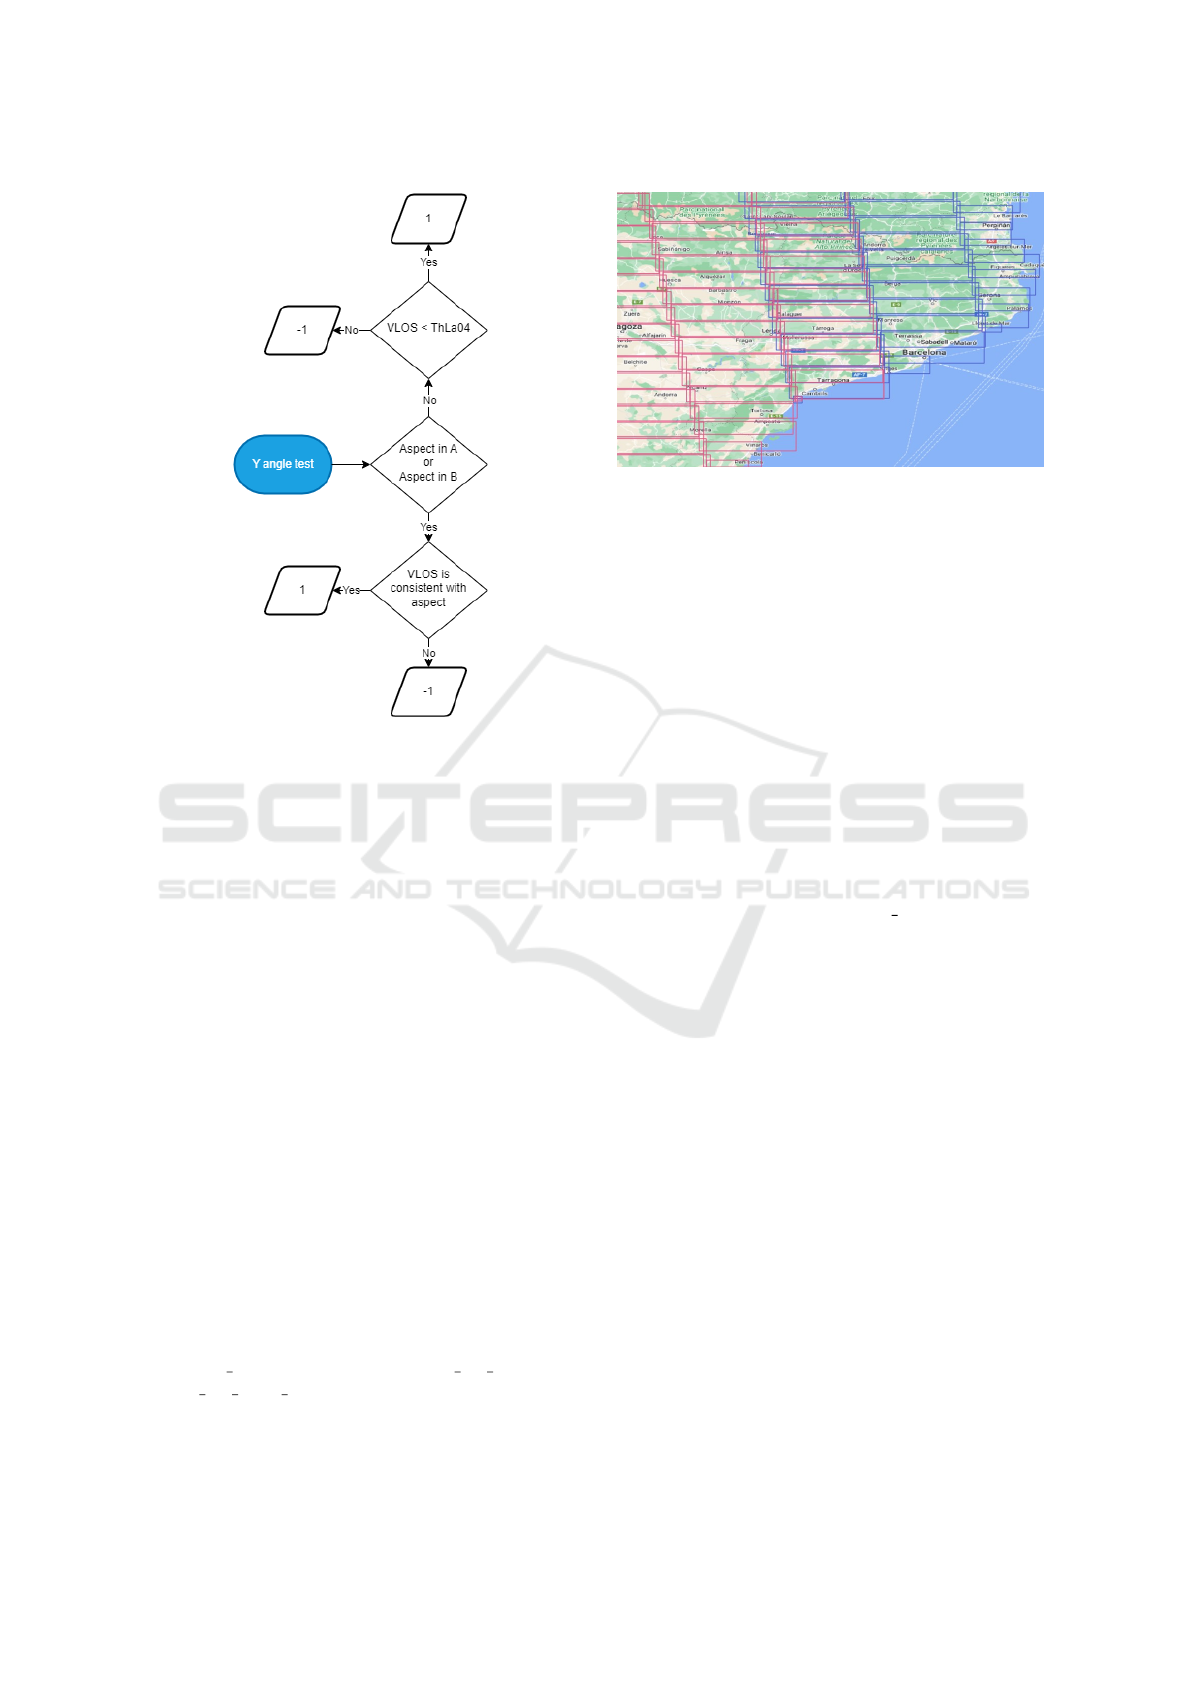
Figure 3: One of the four decision subtrees for landslides in
the new ADAclassifier.
tion activities.
The first challenge is automation. It does not make
sense to dedicate human effort to executing the dif-
ferent applications that will integrate the production
workflow, dataset by dataset. Therefore, it is conve-
nient to have meta-tools that allow the required tools
to be executed as many times as necessary, reducing
human intervention to the minimum indispensable.
There are already meta-tools to automate the execu-
tion of both ADAfinder and ADAclassifier. Conse-
quently, there are no risks related to the automation of
these two tools.
The second challenge is related to the organiza-
tion of information. This includes an important fac-
tor such as the systematization of the file nomen-
clature; note, however, that this issue is present in
all mass production systems. Without a normal-
ized nomenclature, it is impossible to automate pro-
duction. Fortunately, this problem is not such in
this case, since the original EGMS data source it-
self has systematized the naming of data; if this
nomenclature is adapted with standardized variants
to denote the different types of by-products gener-
ated by the system, the problem is solved. For
example, given some downloaded file whose name
is “some file”, the variants “some file ADA” or
“some file ADA CLASSIFIED” may be selected to
represent such by-products. This convention was al-
ready adopted for the first version of the European
Figure 4: Spatial overlap of EGMS data. Source: (Navarro
et al., 2023).
ADA map; now, it should be extended to consider the
by-products generated by the new ADAclassifier.
More serious is the problem of how input data has
been organized: EGMS has processed the Sentinel-
1 bursts that overlap to guarantee full coverage. As
can be seen in Figure 4, there is an overlap between
contiguous bursts. This causes the ADAfinder appli-
cation to generate repeated (although not identical)
ADAs covering the same area in those zones where
such bursts overlap (Figure 5), which, in the specific
case of this web map, is unacceptable. Therefore, it is
necessary to carry out additional data cleaning tasks
due to how the information has been organized at the
source.
This problem was already detected when imple-
menting the European ADA web map and had to be
solved by implementing the purge overlaps tool. The
biggest problem with this tool is the need to load all
the ADAs in Europe simultaneously, to eliminate the
overlaps at once (Navarro et al., 2023). However, the
servers where this process is carried out are, fortu-
nately, capable of handling the load that this entails;
nonetheless, it is worth to remark the problem here,
since it must be highlighted how the organization of
data may impact in how data must be processed or,
worse, whether it is possible to process it due to ca-
pacity problems.
Considering these two issues in advance (file nam-
ing and ADA overlapping) and taking the appropri-
ate measures the risk of a project failure due to data
organization problems is, according to the author’s
standpoint, eliminated. Not considering these factors
could, conversely, lead to a high-risk project.
No other risks related to data organization aspects
are foreseen at the moment of writing this paper.
GISTAM 2024 - 10th International Conference on Geographical Information Systems Theory, Applications and Management
198
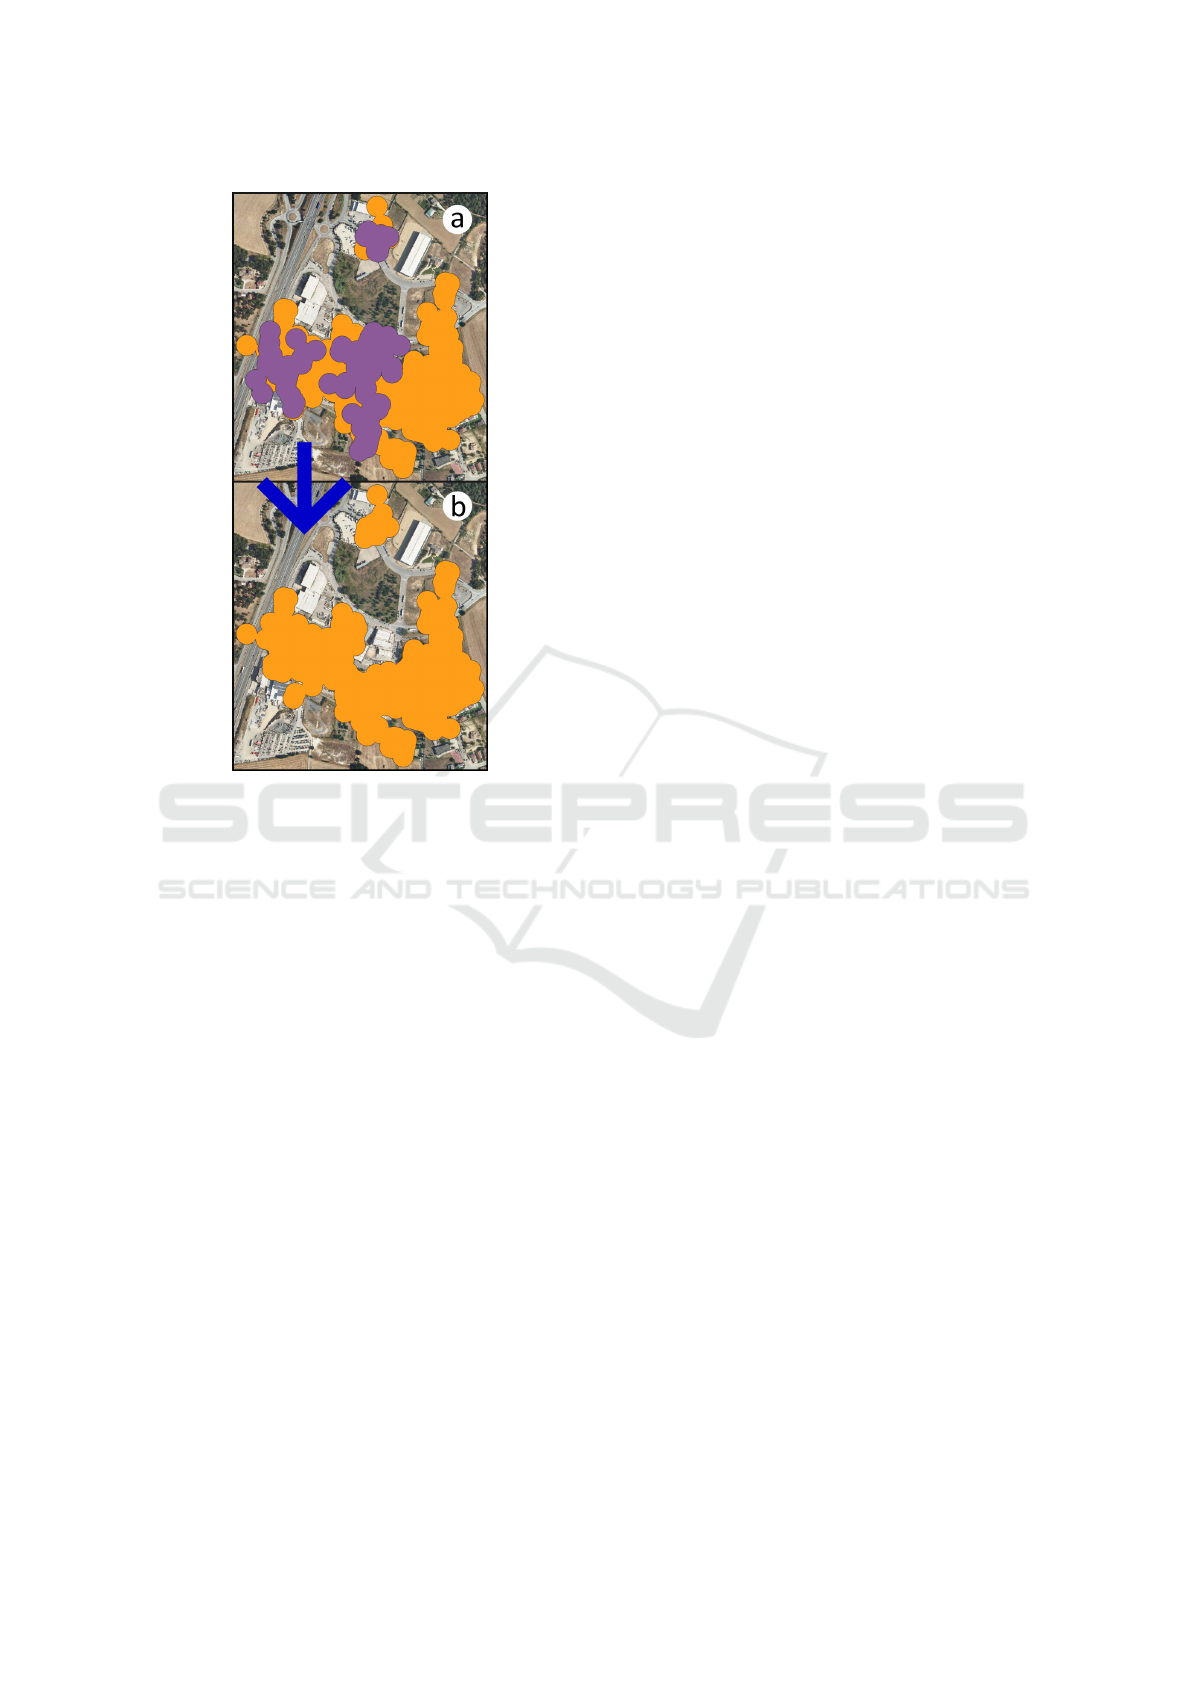
Figure 5: The need to remove overlaps. Source: (Navarro
et al., 2023).
5 FROM DATA TO THE WEB
Assuming that it is possible to generate the classifica-
tion of all ADAs in Europe using the tools (and meta-
tools for automation) mentioned in the previous sec-
tions, there are still problems to be solved. This sec-
tion explains how data formats are one of these prob-
lems.
The new version of the web map should display
classified ADA data, which ought to be stored some-
where. The most common way to store data to be used
by web-based applications is a relational database, as
for example PostgreSQL. In fact, this is the solution
adopted by the current web map.
However, ADAclassifier generates ESRI shape-
files, which cannot be inserted directly into a
database. Therefore, it will be necessary to create
a tool to convert these shapefiles into files contain-
ing SQL (Standard Query Language) statements. By
mean of these files it will finally be possible to trans-
fer the information to the database.
A tool like this already exists, ADA2PGIS, but
it should be modified to handle the new data fields
to consider—at least, the code representing the most
probable ground movement process causing the ADA.
This would not be so great a change, but it should not
be forgotten. Furthermore, the tool should be able to
automate the conversion process as much as possible,
considering again the issues (time, human resources)
related to the processing of 15,000 datasets. That was
already solved for the current version of the Euro-
pean web map, but the changes in the data production
workflow and therefore in the set of by-products to
deal with would imply that the tool should have to be
reimplemented to handle such changes. The authors,
however, believe that the development of the new ver-
sion of ADA2PGIS would not be a challenge, in terms
of risk.
It is not just the conversion tool, however, the only
element that would suffer a change due to the new in-
formation considered. The structure of the database
itself should be changed, in fact, by two reasons: the
first one, the number of elements in the ADA’s time
series (new epochs, and thus, new MPs are included
with each EGMS update), the second, the code stat-
ing the reason of the ground movement. The authors
decided that, although mandatory, this change should
not be considered as a risk, since it is present event in
the case the ground movement code is not considered
in future updates, for the database must be modified
due to the increase in size of the time series when new
updates from the EGMS are implemented in the web
map. In short, the risk of modifying the structure of
the database would be the same no matter the number
of new fields to include.
6 THE WORKFLOW
Sections 2 to 5 delve into the project’s ADAtools
toolset, exploring both existing tools and those need-
ing development. Additionally, these sections tackle
the most important challenges that must be addressed
and overcome. Here, a global picture is presented ex-
plaining how these tools should work together.
Figure 6 depicts how, starting with the deforma-
tion maps downloaded from EGMS, the information
about ADAs is stored in the database.
In the figure, green blocks stand for automated
processes, that is those able to process more than one
burst at a time—ideally, all the bursts at once. Note
that the process to purge the repeated ADAs lying
in overlapped areas is run just once due to the con-
straints of the problem. On the other side, download-
ing the deformation maps from the EGMS is a manual
process that must be repeated until all the necessary
information has been retrieved. It is expected, how-
ever, that improvements on the EGMS Explorer (the
interface to download EGMS data, (European Envi-
Assessing the Risks of Enhancing the Current Europe’s ADA Web Map with Ground Movement Classification Data
199
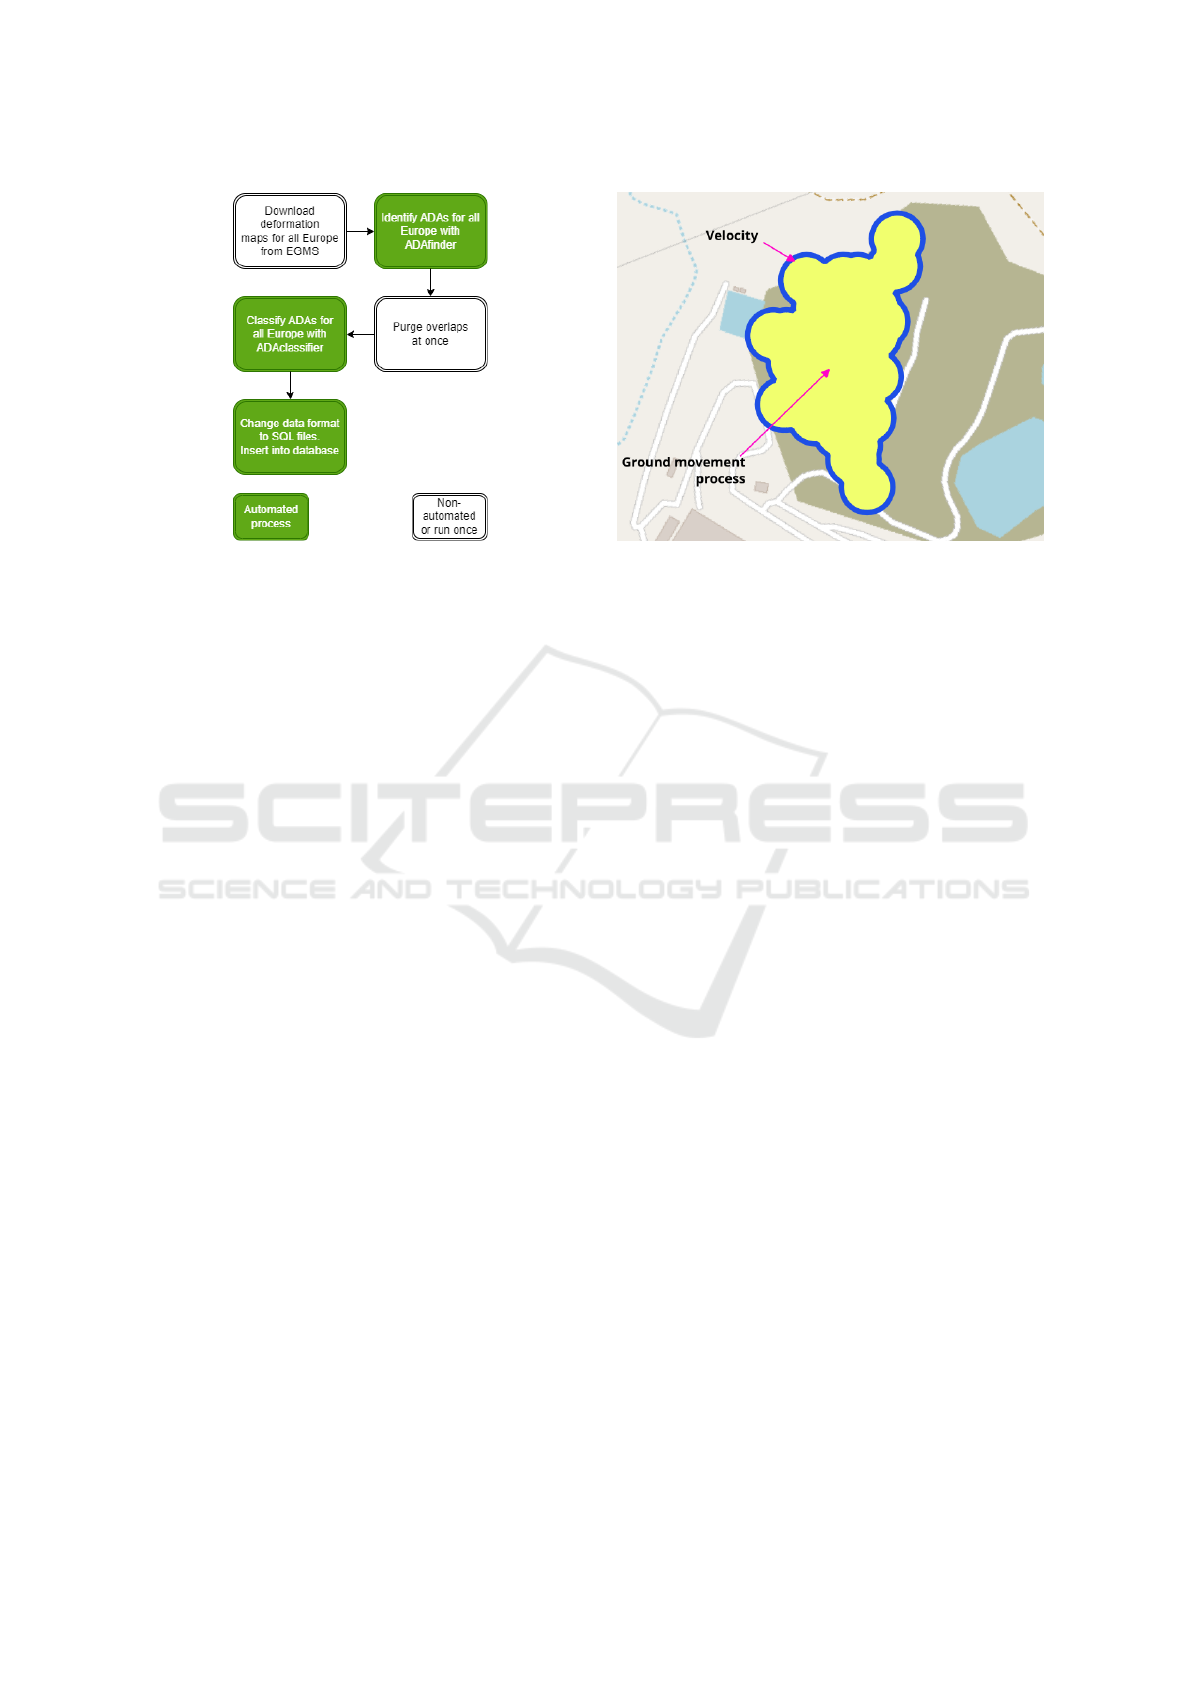
Figure 6: The candidate workflow: from EGMS MPs to
classified ADAs in a database.
ronment Agency, 2021a)) will make possible the au-
tomation of these downloads.
The first three steps in Figure 6 would be manda-
tory even if no enhancements to the web were made,
since incorporating the latest data updates to it can-
not be done without them. The greatest risk related
to the changes in the workflow is the potential, still
unknown increase of processing time due to the clas-
sification of the ADAs using ADAclassifier (see sec-
tion 3); at the moment of writing this paper, not
enough tests had been performed to assess it with a
comfortable level of confidence.
7 THE WEB MAP
Drawing on the past experience from the implemen-
tation of the currently published version of the web
map, the authors foresee no significant challenges to
enhance it to show the new data about ADAs. Basi-
cally, changes are related to the way relevant informa-
tion would be shown.
The goal would be visually displaying as much
key data as possible without overwhelming users.
While ADA’s velocity was the primary focus in
the initial map (represented by colour-coded painted
ADAs), now there would be two key elements: veloc-
ity (as in the current version) and ground movement
processes (the new data). Ideally, both should be visu-
ally integrated to avoid confusion and unlock deeper
insights.
The authors envision a solution using distinct
colours for the perimeter and inner area of each ADA,
as illustrated in Figure 7. This approach would lever-
age colour coding effectively: the perimeter colour
would represent velocity, while the inner area would
Figure 7: ADA colour codes for velocity (perimeter) and
ground movement process (interior).
depict the ground movement process. This conven-
tion would serve to enhance clarity and avoiding in-
formation overload, potentially improving user com-
prehension; this convention could be reversed (ex-
changing the roles or perimeters and inner areas).
This double colour scheme could be easily imple-
mented using the styles included in GeoServer (see
section 8); therefore, no problems are foreseen in this
regard. The authors are confident in the technical fea-
sibility of this approach.
8 THE SERVER
To make the web map available to the public, one or
more servers are needed, which should host the appli-
cations themselves (the web map) as well as the soft-
ware stack necessary to implement the service. Like-
wise, the data must also reside on one of these servers.
The server used with the current version of
the web map is not affected by performance is-
sues (Navarro et al., 2022). Consequently, the authors
are truly confident that it would be perfectly valid to
host the new version. Nowadays, information about
the amount of data to store in the database as well as
the workload that the server must support is available.
The inclusion of the new update from the EGMS and,
eventually, that of the ground movement information,
would imply a rather negligible increase of both space
or performance requirements. Considering that server
is working comfortably with the current workload,
there is a wide margin of manoeuvrer to increase the
volume of data or performance requirements, so no
problems nor risks are foreseen regarding this issue.
The software stack and operating system of the
server would remain unchanged:
GISTAM 2024 - 10th International Conference on Geographical Information Systems Theory, Applications and Management
200
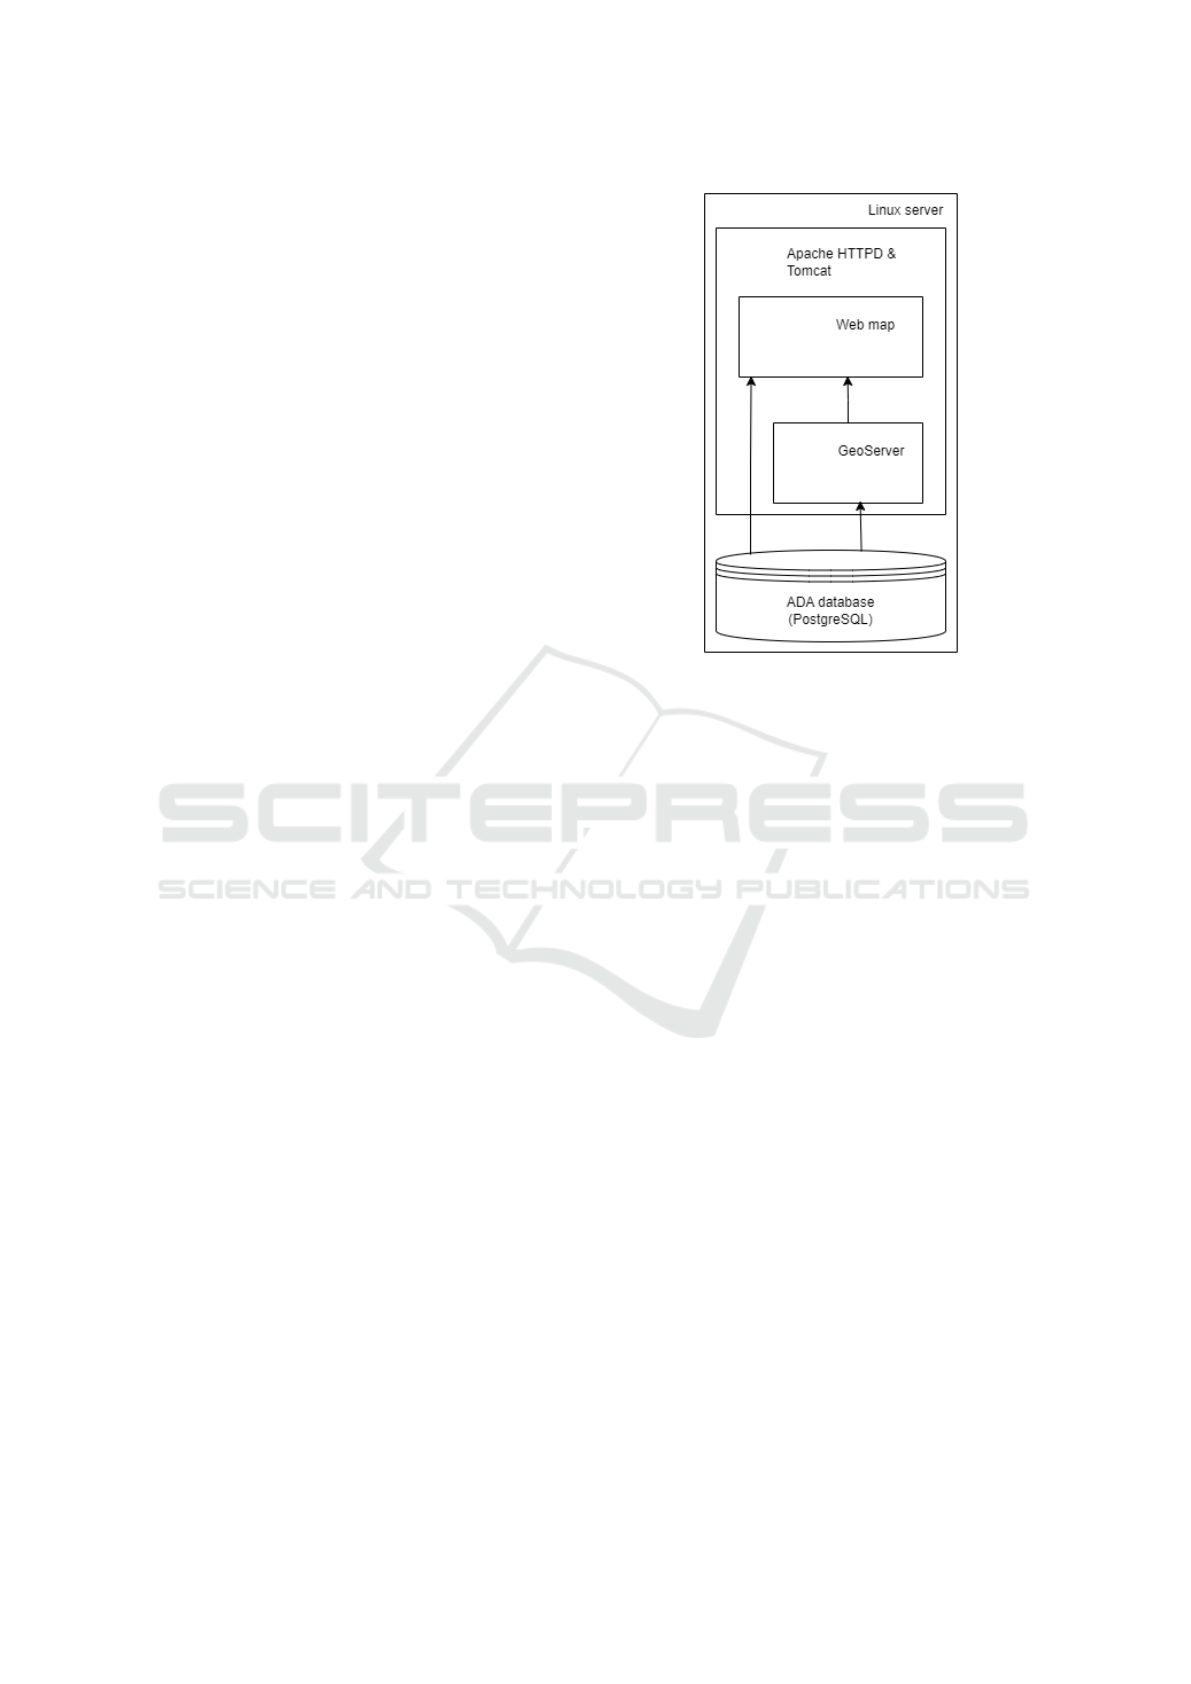
• PostgreSQL (The PostgreSQL Global Develop-
ment Group, 2024) as the database manager, in-
cluding PostGIS (PostGIS Project Steering Com-
mittee, 2024) to store, index, and query geospatial
data. These will keep all the information relative
to ADAs.
• GeoServer (OSGEO, 2024), for sharing spatial
data. Used as a bridge between the database and
the web map. Transforms raw database data into
WMS / WMF layers.
• Apache HTTPD (The Apache Software Founda-
tion, 2024b) and Tomcat (The Apache Software
Foundation, 2024a) servers. These are technol-
ogy enablers. They make possible (1) to run
GeoServer and (2) to have a web server to host
the web map itself.
• The web map application. Relies on GeoServer
to retrieve ADA data and on public base maps
such as OpenStreetMap (OpenStreetMap Founda-
tion, 2024) to add a background cartography layer.
This is the human interface.
• The operating system of the physical server host-
ing the previous software components is Ubuntu
Linux server edition (Canonical Ltd., 2024).
This selection of technologies incorporates only free
and open-source software components. This has an
important economic impact on the implementation of
the project, as there is no cost to use them. Conse-
quently, the adoption of this software stack reduces
the risk of the project. Figure 8 shows the relation-
ships between all the components making the system.
9 CONCLUSIONS
With this paper the authors are trying to assess the
risks related to the addition of a new feature in an al-
ready working web map. This enhancement has been
discussed in the context of a necessary system update
due to the emergence of new EGMS data.
Several aspects have been discussed, such as the
required reliability and performance of the tools in-
tervening in a mass production process, the need for
automation, the unexpected problems that data orga-
nization may produce, the change in data formats or
database structure or the need of a server to imple-
ment the said system. These subjects have been ex-
plored under the light of risk assessment, trying to
identify the weakest link or links in the chain, so a de-
cision might be taken based on solid (or more solid)
evidence.
The experience developing and implementing the
original European ADA web map has proven es-
Figure 8: The architecture of the server.
sential to assess the risks of almost all the points
discussed—as, for instance, how difficult would be to
adapt ADA2PGIS to convert from ESRI shapefiles to
SQL or whether the selected server and software stack
would be enough to implement the whole system.
The most difficult element to assess is the new ver-
sion of the ADAclassifier tool. Its reliability has been
thoroughly tested, so the problem is related only to
performance. Although it is much faster than the orig-
inal version, not enough tests have been yet carried
out to be reasonably sure that a mass production cam-
paign may be started. The authors have noticed that
such performance might be influenced by the com-
plexity of the polygons in the inventories, so more
tests are mandatory before any further steps are taken.
On the other side, the intersection of ADAs and
inventories are just a subset of the tests (subtrees, see
section 3) that ADAclassifier carries out. In fact, in-
ventories are optional inputs to ADAclassifier; when
not present, the checks (subtrees) related to inven-
tories are simply ignored. This, combined with the
fact that, usually, inventories are not available, might
make the ADAclassifier performance issue less im-
portant. It is still unknown which inventories (for
each kind of ground movement process) will be avail-
able if it is decided to process all of Europe. This, to-
gether with the performance of ADAclassifier, is the
second unknown to be solved.
In conclusion, the analysis presented herein al-
lows the authors to affirm that the enhancement of the
web map is possible from the technical standpoint;
no risk is perceived on this side. On the contrary,
Assessing the Risks of Enhancing the Current Europe’s ADA Web Map with Ground Movement Classification Data
201

there are serious doubts from the temporal standpoint:
the lack of solid knowledge about the performance of
ADAclassifier as well and about the availability of the
inventories, makes very difficult to assess how much
time would be needed to complete the whole project,
and whether such amount of time is affordable. Fur-
ther work on this direction is therefore needed.
Note, however, that the current version of the
ADAtools is reliable and performant enough as to be
used in local / regional projects. It is available for free
and may be obtained contacting any or the authors.
ACKNOWLEDGEMENTS
This work has been developed in the framework of
project SARAI (PID2020-116540RBC22), funded by
(MCIN/ AEI /10.13039/501100011033).
REFERENCES
Barra, A., Solari, L., B
´
ejar-Pizarro, M., Monserrat, O.,
Bianchini, S., Herrera, G., Crosetto, M., Sarro, R.,
Gonz
´
alez-Alonso, E., Mateos, R. M., Lig
¨
uerzana, S.,
L
´
opez, C., and Moretti, S. (2017). A Methodology to
Detect and Update Active Deformation Areas Based
on Sentinel-1 SAR Images. Remote Sensing,, 9(10).
Canonical Ltd. (2024). Ubuntu server - for scale out work-
loads | ubuntu. https://ubuntu.com/server. Accessed:
2024-03-14.
Crosetto, M., Solari, L., Mr
´
oz, M., Balasis-Levinsen, J.,
Casagli, N., Frei, M., Oyen, A., Moldestadk, D. A.,
Bateson, L., Guerrieri, L., Comerci, V., and Andersen,
H. S. (2020). The Evolution of Wide-Area DInSAR:
From Regional and National Services to the European
Ground Motion Service. Remote Sensing, 12:2043.
European Environment Agency (2021a). EGMS. https://
egms.land.copernicus.eu/. Accessed: 2024-03-14.
European Environment Agency (2021b). European
Ground Motion Service – Copernicus Land Monitor-
ing Service. https://land.copernicus.eu/pan-european/
european-ground-motion-service. Accessed: 2024-
03-14.
OSGEO (2024). GeoServer. https://geoserver.org/. Ac-
cessed: 2024-03-14.
Navarro, J. A., Garc
´
ıa, D., and Crosetto, M. (2022). An
in-house, self-developed low-cost WebGIS relying on
open-source and self-made tools to show the active
deformation areas across Europe. In Proceedings of
the 8th International Conference on Geographical In-
formation Systems Theory, Applications and Manage-
ment (GISTAM) - Volume 1, pages 99–106. INSTICC,
SciTePress.
Navarro, J. A., Garc
´
ıa, D., and Crosetto, M. (2023).
New challenges in the implementation and exploita-
tion of a low-cost web map of the active deforma-
tion areas across Europe. In Proceedings of the 9th
International Conference on Geographical Informa-
tion Systems Theory, Applications and Management
(GISTAM) - Volume 1, pages 192–199. INSTICC,
SciTePress.
Navarro, J. A., Tom
´
as, R., Barra, A., Pag
´
an, J. I., Reyes-
Carmona, C., Solari, L., Vinielles, J. L., Falco, S., and
Crosetto, M. (2020). ADAtools: Automatic Detec-
tion and Classification of Active Deformation Areas
from PSI Displacement Maps. ISPRS Int. J. Geo-Inf.,
9:584.
OpenStreetMap Foundation (2024). OpenStreetMap. https:
//www.openstreetmap.org/about. Accessed: 2024-03-
14.
PostGIS Project Steering Committee (2024). PostGIS
— Spatial and Geographic Objects for postgreSQL.
https://postgis.net/. Accessed: 2024-03-14.
Shahbazi, S., Navarro, J. A., and Barra, A. (2023). Com-
puting and sharing the differential deformation of the
ground at a continental level using public EGMS data.
In Proceedings of IV Conference on Geomatics Engi-
neering. MDPI.
The Apache Software Foundation (2024a). Apache
Tomcat
©
– Welcome! http://tomcat.apache.org/. Ac-
cessed: 2024-03-14.
The Apache Software Foundation (2024b). Welcome!
– The Apache HTTP Server Project. https://httpd.
apache.org/. Accessed: 2024-03-14.
The PostgreSQL Global Development Group (2024). Post-
greSQL: The world’s most advanced open source
database. https://www.postgresql.org/. Accessed:
2024-03-14.
GISTAM 2024 - 10th International Conference on Geographical Information Systems Theory, Applications and Management
202
