
Designing a Framework to Support the Teaching of Programming
Basics to Large Numbers of Novices
Milo Gianinazzi, Philippe Weidmann and Laurent Moccozet
a
Computer Science Centre, University of Geneva, Battelle, 7 Route de Drize, Carouge, Switzerland
Keywords: Code Metrics, Code Testing, Novice Programmers, Pair Programming, Peer Review, Teaching Programming.
Abstract: In this paper we propose the design of a framework dedicated to facilitating the teaching of programming
basics in the context of large classes of beginners. The biggest issue for the teachers of this type of classes, is
the assessment process of coding exercises. To solve this, we propose a method specifically designed to
alleviate the teacher’s workload while giving him both a general overview of the class and a way to quickly
identify problematic codes. The platform relies on a set of metrics and unit test to provide numerous statistics
and data to the teacher. The platform was tested on a real-life scenario of an introductory class of 500 students.
Our results show that our platform and the underlying method is beneficial. However, more tests should be
conducted to determine its real effectiveness.
1 INTRODUCTION
In recent years, the teaching of programming has
spread to many disciplines and is no longer restricted
to computer sciences. Indeed, many scientific,
linguistic, or economic courses now offer
introductory courses in programming, to teach the
basic concepts that govern the programs and
applications used daily. This opening to a larger
public implies more and more classes. These new
classes impose new challenges for the teachers:
multiplication of assistants, difficulty to calibrate the
course, impossibility to gauge the global
understanding, etc...
These problems are exacerbated when students
must complete an exercise and the professors correct
it. An exercise implies that, for each student, the
teacher must read and correct the submitted code and
deduce whether the teaching/learning has been
correctly given/received. This task quickly becomes
impossible as the amount of code to be evaluated is
so great. The correction of exercises in these
conditions can therefore quickly become a "chain
labour" and any intellectual synthesis on the overall
level of understanding of the class can be extremely
laborious. Such problems will not be solved simply
by increasing the budget for teaching assistants.
a
https://orcid.org/0000-0003-0333-1932
There is a real need for a new way of
correcting/performing programming exercises.
2 THE EVALUATION METHODS
To reduce the teacher’s workload, we had to choose
an evaluation method that our platform will use.
However, when discussing teaching in any form, the
literature pool can very quickly become extremely
vast and disparate as the act of teaching can be
addressed from several different ways. However, we
will only discuss the domains relevant to our context.
Thus, the chosen domains will not be about the act of
teaching, but the ways and methods that could be used
to both facilitate and improve the teacher’s work.
To this end, three domains were selected: peer
review, pair programming and qualitative code
metrics.
2.1 Peer-Review
When searching for a way to facilitate and alleviate
the act of teaching, peer review is what stands out the
most. It is a very well-known solution and is widely
used in education across the globe. In programming
courses, it has already been observed by C. D.
Gianinazzi, M., Weidmann, P. and Moccozet, L.
Designing a Framework to Support the Teaching of Programming Basics to Large Numbers of Novices.
DOI: 10.5220/0012723100003693
Paper published under CC license (CC BY-NC-ND 4.0)
In Proceedings of the 16th International Conference on Computer Supported Education (CSEDU 2024) - Volume 2, pages 597-604
ISBN: 978-989-758-697-2; ISSN: 2184-5026
Proceedings Copyright © 2024 by SCITEPRESS – Science and Technology Publications, Lda.
597

Hundhausen et al. (2013) that peer review helps the
students’ critical thinking skills. At the same time, C.
Kulkarni et al. (2013) and K. Reily et al. (2009)
demonstrated that peer-review can also greatly
alleviate the grading process by producing feedback
or grades for large courses.
However, we decided to not use peer-review as an
evaluation method on its own. This is due to multiple,
inherent flaws of this method. As shown by H.
Hämäläinen et al. (2011), peer-review is complex to
implement as it necessitates a lot of back and forth
between the students and teachers. This system can,
and will increase the organizational complexity of the
course, and with it, will generate more questions and
needs for help from the students, thus increasing the
time spent by the teacher answering questions and
helping students. In addition, peer-review is a system
that significantly increases the student's workload,
which is not desired in our case. Another flaw showed
in the article is the huge difference between the grades
attributed by the teachers and the students. Even with
a small number of grades, no student gave a low grade
to another student.
The authors indicated that these results were the
consequence of an evaluation pattern not complex
and well-defined enough to ensure a more accurate
evaluation by the students. We can conclude that this
issue could be resolved with more preparation in the
evaluation criteria, or by only doing a pass/fail kind
of grade.
In conclusion, while these problems are not
insurmountable in themselves, they are big enough to
discourage us to use peer review as a standalone
system. The limitations in terms of grade reliability
and of complexity and time requirements, points us to
the conclusion that, in our case, peer review would be
best used as a tool in addition to another system, but
not as a core component.
2.2 Pair Programming
Pair programming is a method commonly used in the
industry and education alike. In the education it has
already been proven to drastically help the students in
multiple ways. C. McDowell et al. (2003) and C.
McDowell et al. (2002) both noted that it gives them
more confidence in their capabilities and in their code
while making them learn faster and better. Pair
programming could provide the teacher with a big
gain in time, as, in theory, the number of codes to
evaluate is divided by two.
In their article, L. Williams et al. (2001) offer a
perspective from the one implementing such a
method and discuss the different aspects pair-
programming has to offer.
This article is one of the very few found that helps
us understanding the advantages and disadvantages of
pair-programming from the point of view of the
teacher. In our case, this article shows us some
concrete evidence of pair-programming being a
realistic solution to alleviate the evaluation process
for the teacher. For example, multiple aspects
demonstrates that even if the student may take a little
more time to finish an exercise, the teacher will
significantly gain from this, by spending less time
grading and answering questions. But in a pair-
programming system, the student will be the biggest
winner, as they will gain confidence in their own
capabilities and will learn faster and better through
communication with their peers.
The last paragraph is especially valuable to us, as
it specifies multiple benefits that are exclusive to
teachers. Like the reduced number of cheating cases,
or the reduced number of “partner problems”
observed in comparison to other group methods.
However, pair-programming possess an obvious
shortcoming that could discourage a lot of teachers.
This being the fact that when pair-programming is
used on a class, technically, not every student is
evaluated the same. The fact is that when evaluating
a shared solution, it is almost impossible to know if
both the students contributed the same amount of
work.
In conclusion, pair-programming, while still
having an “operational cost” higher than the
traditional teaching methods, could be abstracted
from the teacher easily through a simple automatic
pairing of the students. It also provides better ways to
control the evaluation process, since only the amount
of evaluation will change but not the process. While
not the focus of this work, the students’ gains (better
confidence, better learning through their peers, etc…)
will indirectly benefit the teacher.
2.3 Code Metrics
Code metrics have a high helping potential for the
teachers. If properly implemented, they can help the
teacher determine more easily which concepts or
subject a class/group of students have trouble with or
is misunderstood as shown by J. Pantiuchina et al.
(2018). However, as shown by both P. Koyya et al.
(2013) and L. H. Rosenberg et al. (1997), most
metrics are designed to test advanced concepts and be
implemented in complex environments.
In their article, C. Boja et al. (2017) propose both
an architecture for a code evaluation platform and a
CSEDU 2024 - 16th International Conference on Computer Supported Education
598

set of metrics. Even if most of the metrics are
unusable due to our aimed students being too much of
beginners, some could be used, like the total number
of lines of code, or the number of operators. This kind
of metric is very basic, but it could be the only kind
applicable in our context of introductory classes.
The architecture proposed by the authors is the
strong point of the article, having an evaluation
platform completely abstracted from both the students
and teachers while separated in modules would solve
most of the problems regarding the code metrics.
If implemented, this system would provide useful
feedback to the teacher, while necessitating no
additional time spent on the exercise by the students.
However, it would still require the teacher to write
some unit tests with each new exercise. But, if the
metrics are correctly handled, the system could
provide an indication on whether the concepts taught
in the course are understood by the students.
Furthermore, it could be used to quickly identify
students who do not or poorly use the taught concepts
while still submitting a functional code.
In conclusion, while most of the proposed metrics
are useless in our case, the concept is very promising
and, with some modifications, could be implemented
in our platform. The biggest challenge will be to find
new appropriate metrics and manage to use them in a
way that can provide useful feedback to the teacher.
The idea of an “invisible and modular evaluation
system” will probably be implemented as it perfectly
fits our use-cases. The teacher needing to write unit
tests for each exercise constitutes the only
disadvantage of such a system.
2.4 Selected Method
As shown above, none of the known and proven
methods is satisfactory by itself. Therefore, we have
decided to combine these three methods in a way that
allows us to replace the disadvantages of each with
the advantages of another. Students will therefore
perform their exercises in the following way:
Two students, Alice, and Bob must perform an
exercise on our platform. They start by performing
the exercise on their own. Once their attempt is
submitted. These two students will be paired for the
second part of the process. This part is done in pairs,
each pair has access to three codes. Alice's code,
Bob's code, and a final code to produce. The goal is
for Alice and Bob to write a code together based on
their codes written in the previous phase. Thus, by
comparing their codes and communicating their
respective skills, they will produce together a "final"
code that will be better (in theory) because it is the
sum of their skills. Finally, once the joint code is
submitted, each member will have to answer a
questionnaire asking the student to rate the quality of
another pair's code. All submitted code will then be
evaluated and scored by unit tests. Several metrics, as
well as all attempts and their scores will then be
available to the course’s teachers.
Splitting the exercise into two submissions (one
single and one group) gets around the inherent
problem of pair programming that not all students are
evaluated equally. With this system and the metrics
and statistics provided, teachers will be able to
quickly see if a student has benefited greatly from
their pairing in an "unfair" way.
This process allows us to minimize teacher
workload while providing metrics and feedback that
will quickly gauge the state of knowledge from the
whole class level to an individual student.
3 THE TEACHING
FRAMEWORK
The teaching framework has been implemented as a
prototype platform, named "Splitcode". It is a web
application and is divided into two distinct parts.
The first part is dedicated to students. This part
has been designed with the aim of extreme simplicity,
the use of Splitcode should in no way increase the
workload of students significantly.
The part reserved for teachers is more complex. It
allows to create courses and exercises. The central
section of this part is the dashboard. This dashboard
allows to visualize metrics and statistics on the results
of the selected exercise. In addition, the teacher can
see and modify the grades given to the attempts by the
unit tests.
3.1 Student Usage Flow
The user flow for the student part was designed to be
simple and not require any specific learning. It is
Figure 1: Students’ user flow.
Designing a Framework to Support the Teaching of Programming Basics to Large Numbers of Novices
599

depicted in Figure 1. The goal is to be able to simply
direct students to the platform without the need for
any instruction.
The student must first authenticate himself. If
they do not have an account, they can create one.
Once the account is created, the student will be
presented with a screen allowing him to select a
course from his registered courses. The student can
register for any of the available courses at any time.
Once the course is selected, the exercises for that
course are displayed in the form of cards. Each card
contains the essential information of the course. The
name, the description, and if the exercise is open or
closed. In case the exercise is not yet completed, the
date of rendering is displayed.
Once the exercise is selected, the student is
directed to a page showing the exercise statement and
the two attempts to be made. For each attempt, a
countdown timer is displayed along with the status of
the attempt (submitted, not submitted). The group
attempt is only available if the solo attempt has been
submitted (Figure 2). During both attempts, students
code on an online editor integrated to the platform. A
chat is also available so that they can communicate.
Figure 2: The group attempt interface with initials in the
corner of the editor focused by each student with a dummy
code example.
Once the two attempts are completed and the time is
up, all students will have the opportunity to answer a
quick questionnaire (5 questions) asking them to
judge the quality of the code produced by another
pair.
3.2 Teacher Usage Flow
In the same way as students, teachers start their flows
with an authentication step. Note that student and
teacher accounts are different and that a teacher
cannot access the student part and vice versa. The
teacher can then create a course. A course is a
relatively simple object, it only contains a title, a
description, a semester of validity (spring/fall) and
the number of credits. The teacher can then create an
exercise.
An exercise contains a title, a statement, a starting
code (code that can be used as a starting template for
students, e.g. an empty class), an opening date, two
closing dates (one for the solo attempt and one for the
paired attempt) and a list of concepts to be used to
solve the exercise (e.g. if a loop is to be used, the
teacher should select "for").
Once the exercise is created, the teacher has
access to the heart of the teacher part: the dashboard.
The dashboard contains two sub-sections, the
visualization, and the list of attempts.
The visualization allows to display different
statistics and metrics in the form of graphs. Some of
these graphs allow to directly select the concerned
students.
The attempt list also has several features to speed
up and simplify the evaluation process. The teacher
can, for example, see and sort directly the attempts
that have received grades considered as failures. He
can also view the code of the attempts and reassign
the grades. The dashboard features will be explained
in more detail in the next section.
3.3 Teacher Specific Features
3.3.1 Metrics
The main tool to facilitate the correction process of
programming exercises is the use of metrics. Indeed,
a program is something that is testable and is
objectively right or wrong. This allows us to automate
several qualitative metrics so that we can provide
teachers with useful analyses that do not require
reading hundreds of programs.
The main difficulty was to find usable qualitative
metrics on extremely simple exercises. For the sake
of simplicity and consistency with the level of the
students, we chose a set of three surface metrics, the
goal being to provide teachers with an overview,
rather than a real complete analysis of the exercise
solutions.
The first metric is the number of lines written.
Although of little value on its own, this metric is
nevertheless very interesting when applied to many
attempts. It permits to highlight programs with an
abnormally large/small number of lines. In most
cases, this correlate either with an incorrect use of a
programming concept, or with a misunderstanding of
the instructions.
CSEDU 2024 - 16th International Conference on Computer Supported Education
600
The second metric used is the use of programming
concepts. As the platform is aimed at introductory
courses, the exercises are often relatively thematic
(e.g., an exercise dedicated to the use and
understanding of loops). This gave us the idea to
create a metric counting the keywords used. For
example, if the teacher indicates in the creation of the
exercise that the concepts "for", "while" and "do"
should be used in the exercise, this metric could
automatically indicate that the teacher has used these
concepts. This metric will then automatically indicate
the students who did not use the right concepts.
The third and last metric created is the
measurement of the time spent on the exercise. Since
the exercise is done on an online editor, it is easy to
retrieve the exact time that students spent on their
attempt. This metric is more abstract and less useful
than the other two, because a very long time does not
especially mean that the student had trouble, but
simply that the editor remained open for the time
recorded. However, at the level of a class of several
hundred students, this metric could give useful
feedback on the average time needed by students to
complete an exercise, and thus, allow for adjustments
to be made to exercises based on their duration.
While remaining on the surface, we believe that
these metrics, when combined, will allow teachers to
have an overview that is otherwise impossible to have
in the context of large classes. This view will allow
them to quickly identify struggling students without
having to read the code of all attempts. In addition,
these metrics will allow the teacher to more easily
identify concepts that have not been understood by
the class and thus adjust the lesson.
3.3.2 Visualization
One of our founding principles when designing the
teacher part of the platform was that everything
should be directly visible. The use of the platform
should be simple and should not require learning.
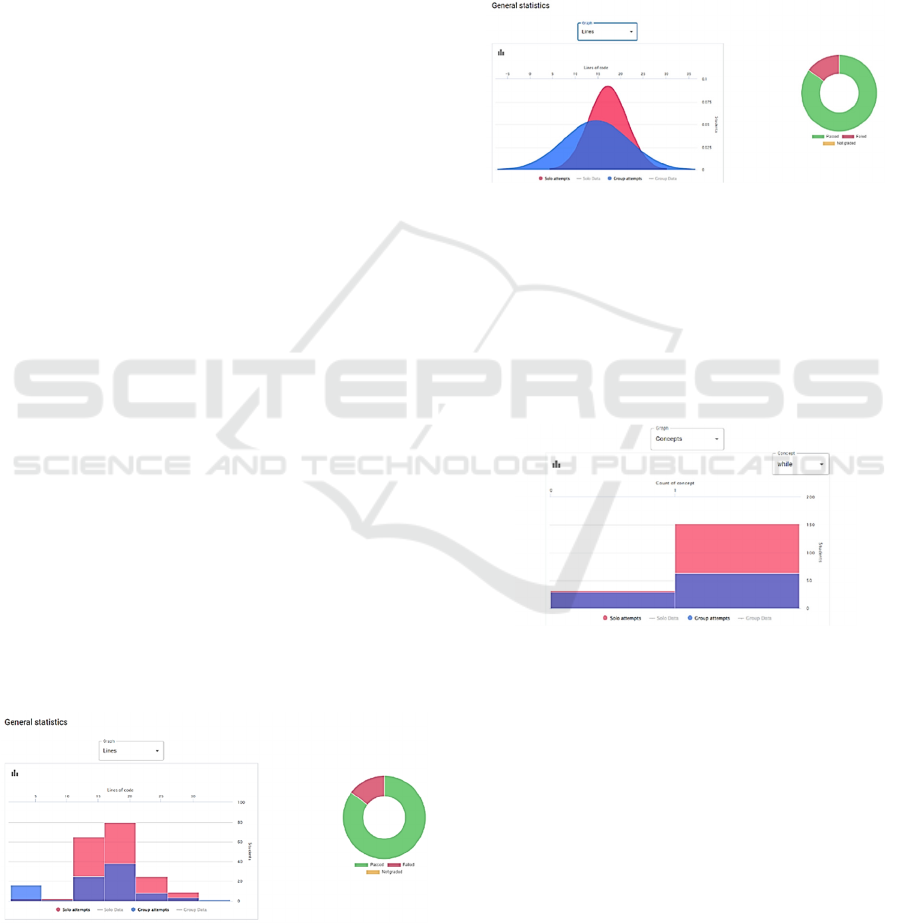
Figure 3: Visualization of the distribution of the metric
corresponding to the number of lines of code in the form of
a histogram.
That's why all information is accessible with a
minimum of clicks. For example, the number of
students who have made their attempt is displayed
directly on the exercise card.
The dashboard, which is the central part for
teachers, was developed with the same principle.
Divided in two parts, the dashboard contains a part
dedicated to graphs allowing to quickly visualize the
metrics mentioned earlier. The other part contains the
list of attempts and will be discussed below.
Figure 4: Visualization of the distribution of the metric
corresponding to the number of lines of code in Gaussian
form.
The visualization part contains two graphs. The
first and simplest one, displays in the form of a
"donut" the number of successful, failed, or
unsubmitted attempts. This graph allows the teacher
to know immediately if the exercise went well overall
(Figure 3 and 4, right).
Figure 5: Visualization of the distribution of the metric
corresponding to the number of programming concepts
used, in the form of a histogram.
The second graph displays the three metrics
discussed above. Thanks to a selector, you can choose
which metric to display (Figure 3 and 4, left, shows
the lines metric; Figure 5 shows the concepts metric).
It also gives the possibility to be displayed as a
Gaussian curve (Figure 4) or a histogram (Figure 3).
This allows the teacher to see all the metrics while
keeping the interface simple and readable. When the
graph is in histogram form, the teacher can click on a
column to display the list of students involved. Both
the solo and paired attempts are displayed at the same
time on the graph, with solo attempts in red and paired
attempts in blue.
Designing a Framework to Support the Teaching of Programming Basics to Large Numbers of Novices
601
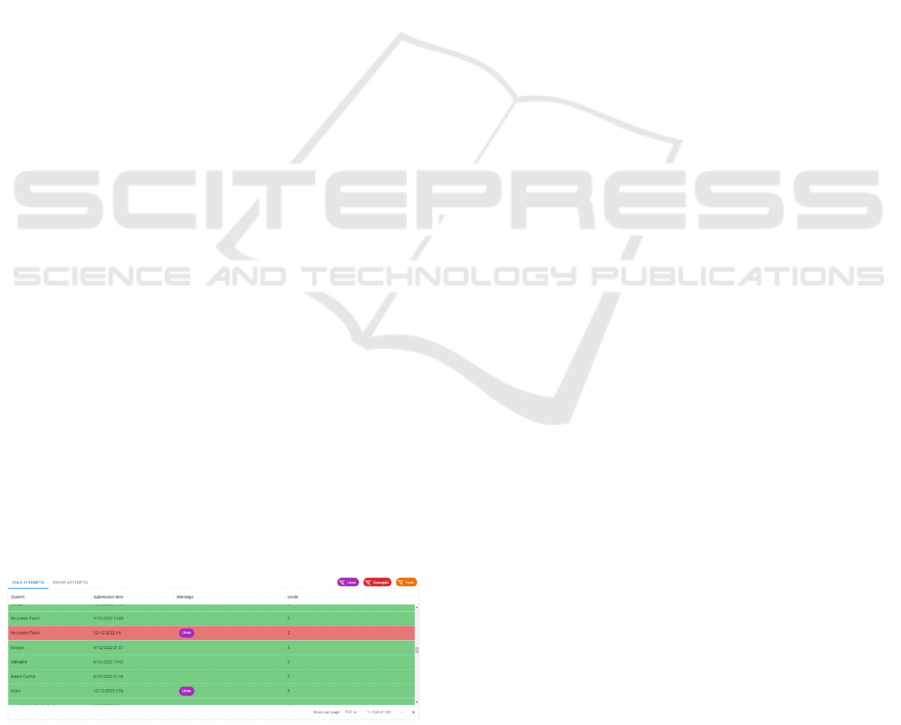
3.3.3 Attempt List
The list of attempts has been given special attention.
Since a list of several hundred lines can quickly
become unreadable. Our goal was to make it as easy
to use as possible.
Each column (student name, submission date,
warnings, and grade) can be filtered and sorted. That
is to say that in addition to being able to sort them in
ascending/descending order, it is also possible to
search for values directly in the desired column. The
goal was to be inspired by the flexibility of Excel. In
addition, the colour of the row indicates whether the
attempt was scored as successful or not.
In addition to these "classic" list functionalities,
we implemented a so-called "warning" system. There
is a warning for each of the three metrics. These
warnings are displayed when the attempt is in the
15% of attempts at either end of the gauss curve of
the corresponding metric. In short, if an attempt is in
the 15% of attempts with the highest number of lines,
it will be marked with a warning in the list. It is
possible to display only the attempts with a warning.
This feature should allow teachers to quickly identify
potentially problematic code, whether it is due to an
abnormal number of lines, poor use of concepts or too
much/short time spent on the exercise.
This set of features allowed us to turn a simple list
of attempts into a tool that can easily reduce the time
a teacher spends reading and analysing student code.
With this list, a teacher can quickly identify
potentially problematic attempts, and, if he or she is
confident in his or her unit tests, ignore many of the
attempts deemed "safe".
By selecting an attempt from the list, the teacher
can perform two actions. First, he can, at any time,
and for any attempt, change the grade given by the
unit tests. This allows the teacher to always keep
control over the evaluation of an exercise. Secondly,
the teacher has a button to view the code of the
attempt. This is obviously an essential feature, as the
teacher might want to check for himself a code
identified as "suspicious" by our metrics.
Figure 6: List of attempts with warnings about abnormal
values for the 3 metrics indicated in the 3rd column.
4 FRAMEWORK EVALUATION
To test our platform, we introduced it in an
introductory programming course. This course is
given at the Faculty of Economics and Management.
Most of the students have no programming skills.
There are about 500 students enrolled in this course,
which allowed us to perform a test in optimal
conditions.
4.1 Sample
Of the 500 students enrolled in the course, 191
decided to participate in our test. We thought we were
dealing with a representative sample of the class,
however, based on our survey at the end of the
experiment (92 respondents), it appears that we have
an overrepresentation of students with programming
experience. This could be explained by the fact that
more students with a prior interest in computer
science were willing to participate.
4.2 Procedure
The test consisted in the realization of an exercise
following the method we have elaborated (a part
alone, then a part in pairs). In order not to take too
much time from the students, a simple exercise was
chosen. For the students to understand our approach
and the functioning of the platform, a short
presentation was given to them.
The test period lasted about two weeks, with a
deadline for the individual part halfway through. The
test went on without major incident, with relatively
few questions asked by the students (less than a
dozen). Only a few chat-related problems were
observed.
4.3 Limitations
Although the number of students and their experience
in programming is in line with the problematic of this
work, to have truly significant results, this test should
have been carried out several times on several
different classes, to be able to collect the opinions of
several teachers. Moreover, the exercise was
probably too simple and short for our method to really
be useful. Finally, the whole teacher workflow could
not be tested. Indeed, the whole part of the unit test
creation being still in the prototype state, we had to
implement them ourselves directly in the back end.
CSEDU 2024 - 16th International Conference on Computer Supported Education
602
4.4 Results
4.4.1 From the Teacher’s Point of View
After the end of the test, the teacher was able to use
the dashboard. The analysis below is taken from his
feedback.
Our metrics and functionalities allow to quickly
obtain a global vision of the state of the class and
general feedback on the notions assimilated or not by
the whole class. Such feedback would not normally
be possible unless the teaching team was significantly
enlarged, as it would require spending too much time
analysing all the codes individually. The pair system
also allows students to support each other, which
frees up the teaching team's time.
The time metric allows one to realize the
difficulty of the exercise, something relatively
difficult for teachers to do usually. The concept count
metric allows us to gauge the mastery of the notions
taught in the course and could allow us to do
remediation more easily. The line count metric, while
useful when combined with the other two, lacks
finesse in the way it counts. Indeed, the metric counts
the total number of lines. However, in programming
it is common to have "useless" lines. For example,
lines containing only a brace or a comment, or simply
empty lines. In the future, such lines should not be
counted, to keep only "useful" lines.
The aspect lacking the most functionalities is that
of individual visualisation. There is currently no way
to compare a student to the rest of the class. There is
also no way to compare a student's solo attempt to
their group attempt, a view showing the difference
between the two could be useful. So, we are missing
an "analysis layer" that would be between the
warnings and the code, which would allow us to see
where a student stands in relation to the class and his
pair.
The most useful feature is the individual warning
system. These are quite good at identifying students
in trouble, which is difficult in such large classes.
Several additions could make these warnings even
more effective, such as: a way to see directly on the
warning what the cause is (too many/not enough
lines), or a way to adjust when warnings are triggered
for each metric.
To conclude, our system has the potential to
improve the course experience for both teachers and
students. The feedback provided through our metrics,
as well as the ability to more easily detect students
who are struggling, frees up valuable teaching staff
time that can be invested in remediation and support
for struggling students. In addition, the pair system
allows students to support each other more easily.
However, if such a system were to be implemented
over time, it might be prudent to provide for
orientation during the formation of the pairs. To
optimize the pairings and to avoid some undesirable
pairs.
4.4.2 From the Students’ Point of View
To obtain the opinion of the students participating in
the test, a survey was conducted.
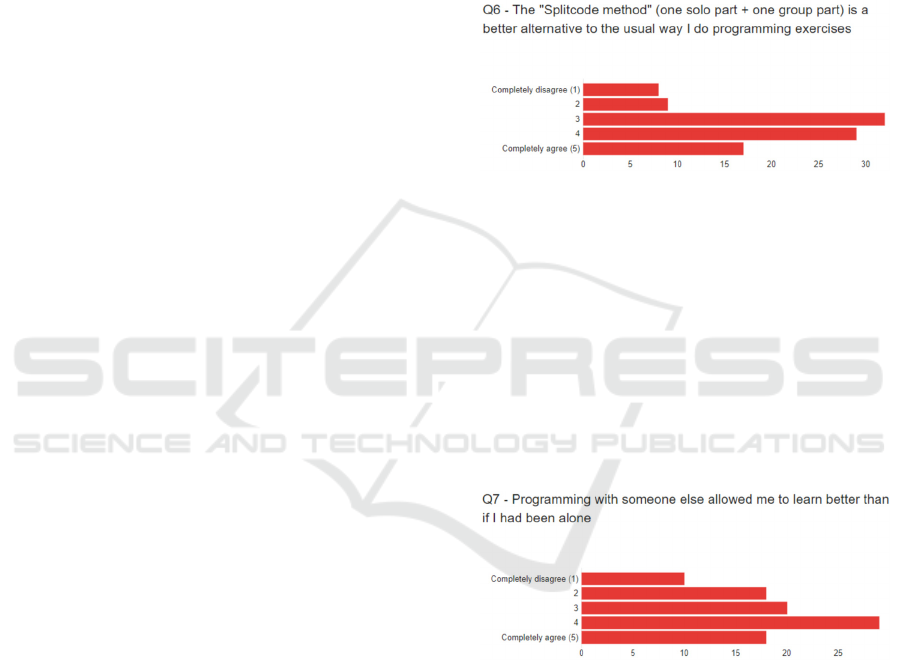
Figure 7: Resultats of question 6 of the survey.
This survey consisted of eight questions that were
designed to evaluate the effectiveness of the platform
and our assessment method. This survey was sent to
the 160 students who made the effort to provide a
complete solution (some students had only turned in
a blank code). Of these 160, 103 completed the
survey. Below, we will briefly analyse some of the
responses to get an overall feeling for our solution.
The purpose of question 6, the results of which are
shown in Figure 7, was to compare our method to the
usual way students perform programming exercises.
Figure 8: Results of question 7 of the survey.
We can see that even if answer 3 (which
corresponds to a "neutral" answer) is the one that
received the most answers, the majority of the
respondents think that our method is superior (49.5%
answered 4 or 5). Moreover, if we add all the people
who voted 3 in order to visualize the number of
people who think that, at worst, our method does not
differ from the usual method, we can deduce that only
17% of the voters found our method inferior to the
usual method.
The results for the question 7, the results of which
are shown in Figure 8, asking whether pair
Designing a Framework to Support the Teaching of Programming Basics to Large Numbers of Novices
603

programming allowed for better learning were more
mixed, although positive. Indeed, 28% of respondents
submitted a strictly negative answer (1 or 2).
However, this question seems to be more divisive
than the previous one as only 20% of respondents
submitted a "neutral" answer (compared to 33% for
the previous question). Although still in the minority,
a result of 28% negative opinions on the pairing
system is far from marginal. Further experience and
feedback from students would be necessary to
correctly identify the cause of this resentment.
Finally, to get feedback on our interface and user
experience, we asked respondents if our platform was
easy to use, as depicted in Figure 9. The results are
unequivocal, 80% of the answers were 4 or 5. This
indicates that our platform was quite easy to use.
Figure 9: Results of question 8 of the survey.
5 CONCLUSIONS
The state of the art shows how much there was a lack
of complete solutions dedicated to help the work of
the programming teacher, particularly for large
classes of novice students. Based on this observation,
we imagined and developed a platform and a set of
metrics and tools to facilitate the evaluation of
programming exercises. We then tested this platform
in real conditions and collected results on its
usefulness and the effectiveness of the implemented
method. However, it appeared to us afterwards that
the test submitted was too simple and that it did not
allow our method to fully show its qualities or
defects. The results do show that it has a positive
influence on the students, but more tests should be
planned to discover its magnitude.
In conclusion, thanks to the platform we have
developed, we have been able to see a solution to our
problem. Our test as well as the feedback from the
teacher and student participants showed that our
method was beneficial for both students and lecturers.
In addition, the metrics and related features
implemented proved to be very effective, both in
getting a global view and better understanding of the
class's comprehension of the course, and in quickly
identifying students with difficulties. We believe that
this platform and its assessment method could be a
first step towards the development of a
comprehensive system aimed at improving
programming instruction in a unified and modular
way.
REFERENCES
C. D. Hundhausen, A. Agrawal, and P. Agarwal (2013).
Talking about code: Integrating pedagogical code
reviews into early computing courses. ACM
Transactions on Computing Education.
C. Kulkarni, K. P. Wei, H. Le, D. Chia, K. Papadopoulos,
J. Cheng, D. Koller, and S. R. Klemmer (2013). Peer
and self-assessment in massive online classes. ACM
Transactions on Computer-Human Interaction.
K. Reily, P. L. Finnerty, and L. Terveen (2009). Two peers
are better than one: Aggregating peer reviews for
computing assignments is surprisingly accurate. In
Proceedings of the ACM International Conference on
Supporting Group Work.
H. Hämäläinen, V. Hyyrynen, J. Ikonen, and J. Porras
(2011). Applying peer-review for programming
assignments. International Journal on Information
Technologies & Security, vol. 1, pp. 3–17.
C. Mcdowell, L. Werner, H. E. Bullock, and J. Fernald
(2003). The impact of pair programming on student
performance, perception, and persistence. In 25th
International Conference on Software Engineering, pp.
602–607.
C. McDowell, L. Werner, H. Bullock, and J. Fernald
(2002). The effects of pair-programming on
performance in an introductory programming course. In
Proceedings of the 33rd SIGCSE technical symposium
on Computer science education - SIGCSE ’02, p. 38.
L. Williams and R. L. Upchurch (2001). In support of
student pair-programming, SIGCSE Bull., vol. 33, no.
1, pp. 327–331.
J. Pantiuchina, M. Lanza, and G. Bavota (2018). Improving
Code: The (Mis) Perception of Quality Metrics, in 2018
IEEE International Conference on Software
Maintenance and Evolution (ICSME).
P. Koyya, Y. Lee, and J. Yang (2013). Feedback for
Programming Assignments Using Software-Metrics
and Reference Code. ISRN Software Engineering, vol.
2013, pp. 1–8.
L. H. Rosenberg and L. E. Hyatt (1997). Software Quality
Metrics for Object-Oriented Environments. Crosstalk
journal, Vol. 10.
C. Boja, M. Zurini, M. Popa, and C. Toma (2017). Code
quality metrics evaluation platform in software
engineering education. 16
th
international conference on
informatics in economy.
CSEDU 2024 - 16th International Conference on Computer Supported Education
604
