FaRS: A High-Performance Automorphism-Aware Algorithm for Graph
Similarity Matching
Fan Wang
1
, Weiren Yu
2
, Hai H. Wang
1
and Victor Chang
1
1
Aston University, Birmingham B4 7ET, U.K.
2
University of Warwick CV4 7AL, U.K.
Keywords:
Web Search, Similarity Search, Link Analysis.
Abstract:
Role-based similarity search, predicated on the topological structure of graphs, is a highly effective and widely
applicable technique for various real-world information extraction applications. Although the prominent role-
based similarity algorithm, RoleSim, successfully provides the automorphic (role) equivalence of similarity
between pairs of nodes, it does not effectively differentiate nodes that exhibit exact automorphic equivalence
but differ in terms of structural equivalence within a given graph. This limitation arises from disregarding most
adjacency similarity information between pairs of nodes during the RoleSim computation. To address this
research gap, we propose a novel single-source role similarity search algorithm, named FaRS, which employs
the top Γ maximum similarity matching technique to capture more information from the classes of neighboring
nodes, ensuring both automorphic equivalence and structural equivalence of role similarity. Furthermore, we
establish the convergence of FaRS and demonstrate its adherence to various axioms, including uniqueness,
symmetry, boundedness, and triangular inequality. Additionally, we introduce the Opt FaRS algorithm, which
optimizes the computation of FaRS through two acceleration components: path extraction tracking and pre-
computation (P-speedup and Out-speedup approach). Experimental results on real datasets demonstrate that
FaRS and Opt FaRS outperform baseline algorithms in terms of both accuracy and efficiency.
1 INTRODUCTION
In the era of information technology, the research con-
cerning the extraction of valuable information from
topological structures has witnessed a substantial in-
crease (Rao et al., 2009; Shahabi et al., 2001; Yang,
2022; Wang et al., 2018; Li et al., 2015). Role simi-
larity analysis (Everett, 1985) is one of the significant
techniques for analyzing complex graph structures,
particularly social networks. It enables the accurate
identification of role equivalence, also known as auto-
morphic equivalence, of pairwise nodes within a net-
work. The basic principle of role similarity search is
that two nodes have a similar role only if they inter-
act with similar objects. To demonstrate the practical
application and importance of role and role similarity
detection based on graph topology in our daily life,
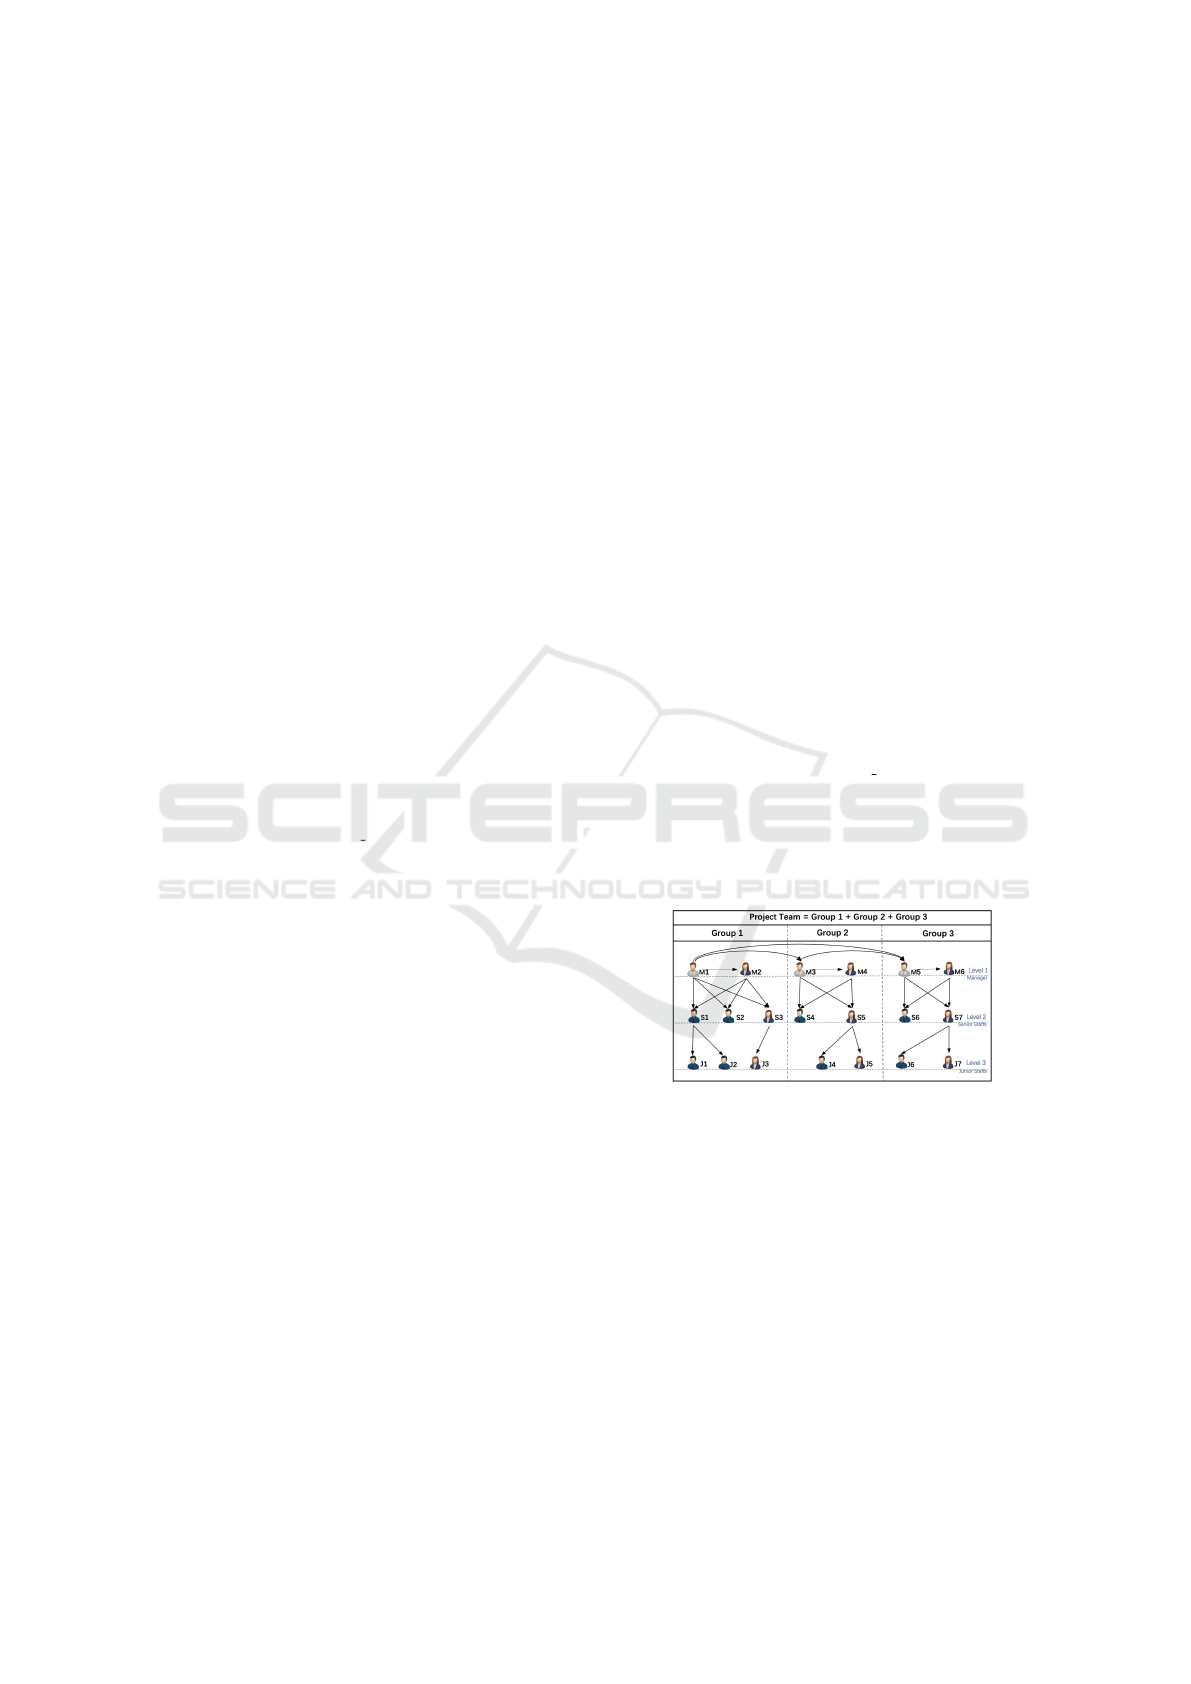
we present an example below. Figure 1 illustrates a
social network representing a project team, where the
nodes correspond to the employees involved in the
project, and the edges denote their interactions and
connections. The team is organized into three groups
based on their assigned tasks, and each group further
Figure 1: A Social Network of A Project Team.
comprises three job levels: project managers (level 1),
senior employees (level 2), and junior staffs (level 3).
An employee’s role within the project is determined
by his/her position.
The primary objective of a role similarity detec-
tion algorithm is to efficiently and accurately iden-
tify nodes in a social network that fulfill similar roles
as a given query node. This algorithm takes a spe-
cific node as the query and computes role similar-
ity scores between that node and all other nodes
in the graph, which is commonly referred to as a
single-source role similarity search algorithm. For
instance, if node J3 is selected as the query node,
Wang, F., Yu, W., Wang, H. and Chang, V.
FaRS: A High-Performance Automorphism-Aware Algorithm for Graph Similarity Matching.
DOI: 10.5220/0012724000003708
Paper published under CC license (CC BY-NC-ND 4.0)
In Proceedings of the 9th International Conference on Complexity, Future Information Systems and Risk (COMPLEXIS 2024), pages 17-29
ISBN: 978-989-758-698-9; ISSN: 2184-5034
Proceedings Copyright © 2024 by SCITEPRESS – Science and Technology Publications, Lda.
17

nodes [J4, J5, J6, J7, J1, J2] are expected to exhibit
higher role similarity scores with J3 compared to
other nodes like S1 or M1, as they share simi-
lar roles within the project, specifically as junior
staff. Role similarity detection finds practical appli-
cations in diverse domains, including co-authorship
networks (Lee, 2012) and e-commerce website rec-
ommendation systems (Diao et al., 2019).
The RoleSim algorithm, developed by Jin (2014?),
computes role similarity scores by taking the mean
of the maximum matchings between a node’s in-
neighbors (Rothe and Sch
¨
utze, 2014). However, de-
spite successfully addressing pairwise automorphic
equivalence, Jin’s RoleSim algorithm has several lim-
itations, including limited accuracy and poor perfor-
mance on large networks (Section 4).
To overcome the limitations of RoleSim, we
present a novel model, namely FaRS, for conducting
single-source role similarity searches based on graph
topology. FaRS exhibits the capability to efficiently
generate more accurate role similarity scores, even for
large graphs. Additionally, we introduce Opt FaRS,
an optimization algorithm for FaRS that significantly
reduces computational costs further by minimizing
the number of calls to the maximum matching algo-
rithm. In summary, FaRS and Opt FaRS have the fol-
lowing distinctive characteristics:
• Accuracy: They can provide more precise role
classification results compared to the best-known
existing competitors.
• Efficiency: FaRS is capable of efficiently com-
puting single-source role similarity search results
over extensive graphs. The performance is further
enhanced by Opt FaRS.
• Index-free: No additional disk space is required
to store indexing results, thereby minimizing the
cost of RAM usage.
This paper is organized as follows. In Section 2,
we provide a comprehensive review of the current
RoleSim algorithm (Rothe and Sch
¨
utze, 2014). Sec-
tion 3 presents an in-depth analysis of the limita-
tions associated with RoleSim-like algorithms when
applied to graphs. In Section 4, we introduce a
novel role similarity search algorithm, FaRS, and pro-
vide proofs of its convergence, uniqueness, symmetry,
boundedness, and triangular inequality. Furthermore,
Section 5 presents the Opt FaRS algorithm, which op-
timizes the performance of FaRS. Finally, in Sec-
tion 6, we conduct experiments using real datasets
to demonstrate the superior performance of our FaRS
and Opt FaRS algorithms in terms of both accuracy
and efficiency when compared to state-of-the-art sim-
ilarity search algorithms.
2 RELATED WORK
Several related researches have been derived based on
the RoleSim (Shao et al., 2019; Chen et al., 2021;
Chen et al., 2020). (Shao et al., 2019) proposed a
seedless de-anonymization method called RoleMatch,
which consists of two parts: the novel role similar-
ity detection algorithm RoleSim++, and the Neigh-
borMatch matching algorithm based on the calculated
role similarity score. RoleSim++ calculates the role
similarity value of a node pair based on the maxi-
mum matching value extracted from the in-neighbors’
and out-neighbors’ role similarity value matrix of the
node pair, which is different from the RoleSim al-
gorithm. To improve the computational efficiency
of RoleSim++, they proposed the α-RoleSim++ al-
gorithm, which extracts information only from node
pairs’ role similarity scores greater than the threshold,
and ignores other pairs.
Currently, StructSim (Chen et al., 2020) is the
most state-of-the-art algorithm for role similarity
search. StructSim calculates the role similarity scores
through the maximum matching value of the horizon-
tal similarity between each k-neighborhood subgraph.
To improve the computational efficiency of the Struct-
Sim algorithm, the maximum match in the algorithm
is replaced with the BinCount match. In the BinCount
matching algorithm, the index of the nodes of each
layer needs to be recorded. To create the index of the
nodes of each layer more efficiently, Flajolet-Martin
Sketch was proposed.
3 PRELIMINARY
Here, we provide an overview of the formulae and
properties of the RoleSim algorithm. In the context
of network similarity analysis, there are four types
of equivalence that are considered: structural equiv-
alence, automorphic equivalence, exact coloration,
and regular equivalence (Rothe and Sch
¨
utze, 2014).
Among these, automorphic equivalence is the most
fundamental type of equivalence for role similarity.
The RoleSim algorithm (Rothe and Sch
¨
utze, 2014) fo-
cuses on exploring the role similarity between pairs of
nodes in networks (graphs) and provides a real-valued
measure of role similarity that verifies automorphic
equivalence. The algorithm is based on the recur-
sive principle that “two nodes share the same role if
they interact with equivalent sets of neighbors”. By
evaluating the role similarity scores and performing
role classification based on how node pairs interact
with other nodes, the algorithm effectively captures
the role similarities. Before delving into the details
COMPLEXIS 2024 - 9th International Conference on Complexity, Future Information Systems and Risk
18

of RoleSim, we present the fundamental intuition and
various notations used throughout this paper.
In a directed graph G = (V, E), V and E denote
the vertices and edges in G, respectively. A node
u is an in-neighbor of node v if (u, v) ∈ E. Simi-
larly, an out-neighbor can be defined as a node that
has an outgoing edge to another node. The sets of in-
neighbors and out-neighbors of a node v in the graph
are denoted by I (v) and O(v), respectively. The in-
degree and out-degree of a node v in the graph rep-
resent the number of in-neighbors and out-neighbors
of v and are denoted by deg
−
v
and deg
+
v
, respectively.
Furthermore, mindeg
−
(u, v) is the smaller in-degree
between node u and node v, which can be expressed
mathematically as mindeg
−
(u, v) = min(deg
−
u
, deg
−
v
).
Similarly, maxdeg
−
(u, v) is the larger in-degree be-
tween node u and node v, i.e., maxdeg
−
(u, v) =
max(deg
−
u
, deg
−
v
). For example, consider the node
pair (S1, J1) in Figure 1. The in-degree of node
S1 is 2, and mindeg
−
(S1, J1) = min(2, 1) = 1 and
maxdeg
−
(S1, J1) = max(2, 1) = 2.
The RoleSim algorithm is founded upon the con-
cept of maximal matching of neighbors’ similarity,
which recursively establishes the similarity between
nodes as the mean similarity of the maximum weight
matching among their neighbors. Maximum Weighted
Matching (MWM) is a well-known problem in graph
theory where the objective is to find, in a weighted
graph, a matching that has the highest possible sum
of weights. The RoleSim algorithm calculates the role
similarity rs(u, v) between nodes u and v using the
following formula. The complete matrix of pairwise
similarity values between all nodes is referred to as R:
rs(u, v) = (1 −C) max
M A(u,v)
∑
(x,y)∈M A(u,v)
rs(x, y)
deg
−
u
+ deg
−
v
− mindeg
−
(u, v)
+C
(1)
Here, x ∈ I(u), y ∈ I(v), M A(u, v) denotes a
matching between I(u) and I(v), C signifies the decay
factor (0 < C < 1), and deg
−
u
+ deg
−
v
−mindeg
−
(u, v)
is equivalent to maxdeg
−
(u, v).
A weighted bipartite matching of M A (u, v) can
be defined using rs(x, y) scores as the weights. The
weight of the matching is given by the sum of the
rs(x, y) scores for all (x, y) pairs in M A(u, v), de-
noted by w(M A(u, v)). Mathematically, it means
w(M A(u, v)) =
∑
(x,y)∈M A (u,v)
rs(x, y). A matching
M A(u, v) is said to be maximal if its weight is the
maximum among all possible matchings, denoted as
f
M (u, v), and the weight of
f
M (u, v) is denoted by
M(u, v), i.e., M(u, v) = w(
f
M (u, v)).
Using the notation of
f
M (u, v) and M(u, v), the
definition of rs(u, v) from Equation 1 can also be ex-
pressed as follows (Rothe and Sch
¨
utze, 2014):
rs(u, v) = (1 −C)
M (u, v)
maxdeg
−
(u, v)
+C
(2)
The matching selection process used by RoleSim
is explained using the following example.
Example 3.1. Consider a directed graph G = (V, E),
where (u, v) ∈ V are two nodes. The set of in-
neighbors of node u is denoted as I(u) = {a, b, c},
while the set of in-neighbors of node v is denoted as
I(v) = {d, e, f , g, h} in G. A subset of the RoleSim
matrix of values (R) is presented in Figure 2, where
each value represents the similarity of the pairings of
neighbors between these two vertices. Assume that
these values have the following ordering: rs(a, d) =
max(rs(a, :)), rs(b, f ) = max(rs(b, :)), and rs(c, e) =
max(rs(c, :)).
In RoleSim, a matching involves selecting a single
cell from each row and column. When the number of
rows is different from the number of columns, the size
of the matching is limited to mindeg
−
(u, v). In this ex-
ample, the matching size is restricted to 3. A maximal
matching is a matching where the sum of the selected
cells is maximized. As depicted in Figure 2, follow-
ing the principle of maximum weighted matching, the
maximal matching results of the in-neighbor similar-
ity matrix are enclosed by a solid square and can be
expressed as M (u, v) = rs(a, d) + rs(b, f ) + rs(c, e).
In the subsequent sections of this paper, M
1
(u, v) will
be used to refer to this maximal weighted matching re-
sult of the in-neighbor similarity matrix for the node
pair (u, v) generated by the RoleSim algorithm, and
it is referred to as the first-order maximal weighted
matching result. This distinction is made to differen-
tiate it from the higher Γ
th
order maximal weighted
matching used in the proposed FaRS algorithm (Sec-
tion 5). For instance, M
2
(u, v) denotes the second-
largest weighted matching result.
Figure 2: In-Neighbour Similarity Matrix of Node-Pair
(u, v).
The RoleSim algorithm, which follows an iterative
process to calculate the role similarity score between
node pairs (u, v) ∈ V, consists of two phases. First,
the role similarity search scores matrix R is initial-
ized. In the second phase, during the k
th
iteration,
the role similarity score between the node pair (u, v)
is computed based on the role similarity scores from
the previous (k − 1)
th
iteration. This computation is
performed using the following equation:
FaRS: A High-Performance Automorphism-Aware Algorithm for Graph Similarity Matching
19

rs
k
(u, v) = (1 −C)
M
1
k−1
(u, v)
maxdeg
−
(u, v)
+C
(3)
The task of retrieving similarity relationships be-
tween a given node q and all other nodes of graph is
known as single-source similarity search and is de-
noted as rs(:, q), which is a vector of similarity scores
between q and rest nodes. It can be calculated as:
rs
k
(:, q) = (1 −C)M
1
k−1
(:, q) ⊘ MAXDEG
−
(:, q) + C
n×1
(4)
⊘ is element-wise division of the respected posi-
tions of two vectors, and n is the number of nodes
in the graph. The vector M
1
k−1
(:, q) contains the
first order maximum weighted matching of node-pair
((i, q)|i ∈ V), while the vector MAXDEG
−
(:, q) con-
tains the maximum in-degree of node-pair ((i, q)|i ∈
V).
The RoleSim algorithm satisfies the following
properties (Rothe and Sch
¨
utze, 2014). In Section 5.2,
we will demonstrate that these properties also held in
our algorithm FaRS and Opt FaRS.
1. Boundedness: The similarity score rs(∗, ∗) al-
ways exists and is unique, and C ≤ rs(∗, ∗) ≤ 1.
2. Monotone Convergence: The value of rs
0
(∗, ∗)
is the upper bound of rs
k
(∗, ∗), that is, rs
k
(∗, ∗) ≥
rs
k+1
(∗, ∗).
3. Convergence: The result of rs
k
(∗, ∗) converges
to rs(∗, ∗), that is, as k approaches infinity,
lim
k→∞
rs
k
(∗, ∗) = rs(∗, ∗).
4. Triangle inequality: The RoleSim algorithm sat-
isfies the triangle inequality.
4 LIMITATIONS OF RoleSim
Despite its usefulness, the RoleSim algorithm suffers
from two main limitations, namely inaccuracy and
computational inefficiency. We provide a detailed
analysis of the causes of these limitations here.
4.1 Limitation 1 (Inaccuracy)
The role similarity score in RoleSim is determined by
computing the maximum matching from the neigh-
bor similarity score matrix (Gabow et al., 2001). As
mentioned earlier, the maximum matching refers to
selecting the highest sum value of one cell from each
row and column in the in-neighbor similarity ma-
trix. If the number of rows differs from the num-
ber of columns, the matching size is constrained to
be the minimum of the two. It means that RoleSim
excludes the in-neighbor nodes that represent the sur-
plus rows/columns in the similarity matrix from the
matching selection process. Moreover, even when
an in-neighbor row/column is included in the match-
ing selection, most similarity scores associated with
it are disregarded. This is because RoleSim only
considers one value from each row and column of
the in-neighbor score matrix (the first-order maximal
weighted matching). Consequently, these two factors
can compromise the accuracy of RoleSim and result
in ambiguous role classification. To demonstrate the
limitations of the RoleSim algorithm, we employ Ex-
ample 3.1 once again and refer to Figure 3.
Figure 2 demonstrates a limitation of the RoleSim
algorithm, where it only captures information from a
specific column (green area) while disregarding an-
other column (red area). This is due to the algo-
rithm’s focus on maximizing the matching based on
the smaller in-degree between the compared nodes.
As a result, the algorithm neglects the in-neighbors’
information that corresponds to the difference in in-
degrees between the nodes. Additionally, beyond the
first-order maximal matching (the three solid square
cells), all information from the column (d, e, f ) is ig-
nored. These contribute to the inaccuracy of RoleSim.
In Figure 1, we compare the role similarity search
results of RoleSim with our proposed FaRS algorithm
(J3 as a query). The right table in Figure 3 shows
the results obtained from RoleSim, where all nodes
[M6, J3, J5, J7, J1, J2, J4, J6] have the same role simi-
larity scores with node J3. It suggests that these nodes
belong to the same role classification. However, in
reality, [J3, J5, J7, J1, J2, J4, J6] are part of the junior
staff classification (level 3), whereas M6 belongs to
the manager classification (level 1). Thus, the results
of RoleSim may contain errors that require correction.
The left table in Figure 3 displays the results pro-
duced by our proposed algorithm, FaRS, which can
correctly reflect this fact.
Moreover, the RoleSim algorithm suffers from an
accuracy problem in recognizing the structural equiv-
alence (group classification in Figure 1). In con-
trast, the scores produced by FaRS in the left table
are different from those of RoleSim, and thus, the
similarity levels can be ordered and ranked. For in-
stance, the role similarity scores between node J3
and nodes [J4, J5] are 0.4, and both [J4, J5] belong
to group 2. Similarly, we can identify [J6, J7] and
[J3, J1, J2] as belonging to group 1 and group 3, re-
spectively. Note that although J3 and [J1, J2] have
different in-neighbors (the in-neighbor of node J3 is
node S3, and the in-neighbor of [J1, J2] is node S1),
both nodes S3 and S1 belong to group 1. Thus, J3 and
[J1, J2] are more structurally related. FaRS recog-
COMPLEXIS 2024 - 9th International Conference on Complexity, Future Information Systems and Risk
20

Figure 3: Role similarity search results of RoleSim & FaRS.
nizes this fact, which is evident in the results of FaRS
(FaRS(J1, J3) = FaRS(J2, J3) = FaRS(J3, J3)).
This example illustrates that FaRS not only cor-
rects the errors in RoleSim, improves the accuracy
of automorphic equivalence, but also yields structural
equivalence, which RoleSim entirely overlooked.
Limitation 2 (Computational Inefficiency). The
single-source similarity search in RoleSim is compu-
tationally expensive due to redundant computations
and repeated use of the maximum matching algo-
rithm. In contrast, FaRS improves computational
efficiency by minimizing the number of maximum
matching calls and focusing on shared information,
resulting in faster processing times.
5 PROPOSED SCHEMA
This section introduces FaRS, a new role-based sim-
ilarity search algorithm that surpasses existing algo-
rithms such as RoleSim in identifying and categoriz-
ing nodes in graphs.
5.1 FaRS
Most existing role-based similarity algorithms, in-
cluding RoleSim, have limitations (as discussed in
Section 4) when applied to real-life applications. To
overcome these limitations and improve role-based
similarity search, we propose the FaRS algorithm.
FaRS selects the top Γ best matching pairs in the max-
imum matching process, providing more accurate role
similarity scores. We denote the role similarity score
vector between a single query q and node set set
A
as
RS
Γ
(set
A
, q), the role similarity score matrix between
node sets set
A
and set
B
as RS
Γ
(set
A
, set
B
), and the role
similarity score between node pair (u, v) as RS
Γ
(u, v).
Γ
th
maximum weighted matching is defined as the
maximum weighted matching of the matrix exclud-
ing the top (Γ− 1) largest weighted matching (Murty,
1968). In Section 7, we show that setting Γ equal to
3 can achieve the best balance between accuracy and
efficiency of FaRS.
Definition 1 (FaRS). Given a directed graph G =
(V, E), a query q ∈ V , and |V | = n, the single-source
FaRS role similarity scores w.r.t. q, denoted by RS
Γ
(:
, q), are defined as follows:
RS
Γ
(:, q) = (1 −C)( max
MA
1
(:,q)
∑
(x,y)∈MA
1
(:,q)
RS
Γ
(x, y)+
λ · max
MA
2
(:,q)
∑
(x,y)∈MA
2
(:,q)
RS
Γ
(x, y)+
··· + λ
(Γ−1)
· max
MA
Γ
(:,q)
∑
(x,y)∈MA
Γ
(:,q)
RS
Γ
(x, y))
⊘(1 + λ + · · · + λ
(Γ−1)
)(DEG
−
i=1:n
+ [deg
−
q
]
n×1
− MINDEG
−
(:, q)) + C
n×1
(5)
where MA
Γ
(:, q) is the top Γ
th
order matching of the
in-neighbour similarity matrix of nodes (i = 1 : n) and
query q, and the corresponding maximum weighted
matching values can be represented M
Γ
(:, q). The
normalization coefficient for the match of each or-
der is denoted by λ
γ
(0 ≤ λ
γ
≤ 1 and 1 ≤ γ ≤ Γ). ⊘
denotes the element-wise division of the correspond-
ing positions of two vectors. The vector DEG
−
i=1:n
is the in-degree of all the nodes i(i ∈ V). [deg
−
q
]
n×1
is a vector whose values are the in-degree of node
q. MINDEG
−
(:, q) is a vector, and the values
of this vector are the minimum value of node-pair
[(deg
−
i
, deg
−
q
)|i ∈ V]. C is the decay factor (0 < C <
1).
Definition 4.1 presents the FaRS algorithm for
role similarity which captures the top Γ maximum
weighted matching values from a node pair’s in-
neighbour similarity matrix. In order to prevent divi-
sion by zero in the numerator of Eq. 5, the following
special cases are incorporated into the equation.
(
RS
Γ
(u, q) = C deg
−
u
= 0 or deg
−
q
= 0
RS
Γ
(:, q) = C
n×1
deg
−
q
= 0
Lemma 5.1. Given the in-neighbor similarity matrix
of a node pair (u, v) in G, the value of mindeg
−
(u, v)
is the upper bound for the various orders of maxi-
mal weighted matching M
γ
(u, v) (where 1 ≤ γ ≤ Γ).
These matching values are arranged in descending
order, i.e., mindeg
−
(u, v) ≥ M
1
(u, v) ≥ M
2
(u, v) ≥
··· ≥ M
Γ
(u, v) ≥ 1.
The proof of this lemma is omitted from this paper
due to space limitations and it can be found from the
technical report [removed].
Computation Of FaRS. Given a graph G = (V, E),
the computation of the single-source FaRS role sim-
ilarity scores with respect to the query q, denoted as
RS
Γ
(:, q), follows an iterative process until conver-
gence. The total number of iterations in the algorithm
is denoted as K, with each iteration represented by k
(K = max(k)). Initially, the matrix RS
Γ
0
(V,V ) is ini-
tialized as ones
n×n
. Then, the role similarity scores
RS
Γ
(:, q) at iteration k are computed using the fol-
lowing equation. The second phase is repeated until
convergence is reached.
FaRS: A High-Performance Automorphism-Aware Algorithm for Graph Similarity Matching
21

RS
Γ
k
(:, q) = (1 −C)(M
1
k−1
(:, q) + λ · M
2
k−1
(:, q) + ··· + λ
(Γ−1)
· M
Γ
k−1
(:, q))
⊘(1 + λ + · · · + λ
(Γ−1)
)MAXDEG
−
(:, q) + C
n×1
(6)
Theorem 5.2. Convergence: For a directed graph
G = (V, E), and any query q ∈ V , the FaRS role sim-
ilarity search algorithm is converged with the initiali-
sation of RS
Γ
k=0
= Ones
n×n
, and the iterative compu-
tation of the FaRS algorithm w.r.t. query q at iteration
k satisfies lim
k→∞
RS
Γ
k
(:, q) = RS
Γ
(:, q).
Proof. To save space, we set Γ = 2 without loss of
generality. We aim to demonstrate the convergence of
the role similarity scores RS
2
k
(:, q) to RS
2
(:, q) as k
approaches infinity. This requires proving the con-
vergence of node-pair role similarity search scores.
Specifically, we need to show that lim
k→∞
RS
2
k
(i, q) =
RS
2
(i, q) holds for a randomly selected node i from V.
When k = 0, according to the initialisation, RS
2
0
=
Ones
n×n
, and the definition of FaRS (Eq. 5), RS
2
1
(:, q)
can be calculated as follows:
RS
2
1
(i, q) = (1 − c)
∑
(x,y)∈M
1
0
(i,q)
RS
2
0
(x, y) + λΣ
(
x
′
,y
′
)
∈M
2
0
(i,q)
RS
2
0
(x
′
, y
′
)
(1 + λ) maxdeg
−
(i, q)
+C
= (1 − c)
(1 + λ) mindeg
−
(i, q)
(1 + λ) maxdeg
−
(i, q)
| {z }
≤1
+C = 1 = RS
2
0
(i, q)
Next we assume that RS
2
k
(∗, ∗) ⩽ RS
2
k−1
(∗, ∗) holds
for any node pair in the graph , we will proof
RS
2
k+1
(∗, ∗) ⩽ RS
2
k
(∗, ∗) holds next. Refer to the com-
putation of FaRS (Eq. 6), RS
2
k+1
(:, q) can be gener-
ated as follows:
RS
2
k+1
(i, q) = (1 −C)
M
1
k
(i, q) + λM
2
k
(i, q)
(1 + λ) maxdeg
−
(i, q)
+C
= (1 − c)
Σ
(x,y)∈M
1
k
(i,q)
RS
2
k
(x, y) + λΣ
(x
′
,y
′
∈M
2
k
(i,q)
RS
2
k
(x
′
, y
′
)
(1 + λ) maxdeg
−
(i, q) +C
⇕ hypothesisRS
2
k
(∗, ∗) ⩽ RS
2
k−1
(∗, ∗)
≤ (1 −C)
∑
(x,y)∈M
1
k−1
(i,q)
RS
2
k−1
(x, y) + λΣ
(
x
′
,y
′
)
∈M
2
k−1
(i,q)
RS
2
k−1
(x
′
, y
′
)
(1 + λ) maxdeg
−
(i, q)
+C
= (1 −C)
M
1
k−1
(i, q) + λM
2
k−1
(i, q)
(1 + λ) maxdeg
−
(i, q)
+C
| {z }
refer to Eq. 6
= RS
2
k
(i, q)
Thus we conclude RS
2
k+1
(∗, ∗) ⩽ RS
2
k
(∗, ∗) holds for
any node-pair in the graph, when the assumption
RS
2
k
(∗, ∗) ⩽ RS
2
k−1
(∗, ∗) holds.
We have demonstrated that lim
k→∞
RS
2
k
(i, q) =
RS
2
(i, q) for any randomly chosen node i in the net-
work V. This result holds true for all nodes in
V. Consequently, as the number of iterations k in-
creases towards infinity, the role similarity scores of
FaRS eventually converge. Specifically, we have
lim
k→∞
RS
Γ
k
(:, q) = RS
Γ
(:, q).
5.2 The Axiomatic Properties of FaRS
In this subsection, we establish that FaRS preserves
the crucial axiomatic properties of RoleSim. Note
that, for brevity, without loss of generality, we assume
that Γ in the FaRS algorithm is fixed at 2 in all proofs.
In the following, let G = (V, E) be a graph, q be a ran-
domly selected query, and k be an iteration number.
Theorem 5.3. Symmetry: The role similarity scores
generated by Eq. 6 satisfy RS
Γ
k
(:, q) = RS
Γ
k
(q, :),
where RS
Γ
k
(q, :) denotes the q
th
row of the role sim-
ilarity matrix.
Theorem 5.4. Monotone Convergence: The role
similarity scores generated by Eq. 6 satisfy RS
Γ
k
(:
, q) ≤ RS
Γ
k−1
(:, q).
For the detailed proof of Theorem 5.3 and Theo-
rem 5.4, please refer to the technical report [removed]
due to limited space.
Theorem 5.5. Boundedness: The role similarity
scores generated by Eq. 6 satisfy C
n×1
≤ RS
Γ
k
(:, q) ≤
1
n×1
. Here C
n×1
is a vector whose values are all C,
and 1
n×1
= ones(n, 1).
Proof. We prove Theorem 5.5 by showing that for
any node u ∈ V, C ≤ RS
2
k
(u, q) ≤ 1. We begin by
initializing RS
2
k
= ones(n, n), where n is the number
of nodes of the graph. Eq. 6 is as follows:
RS
2
k
(u, q) = (1 −C)
M
1
k−1
(u, q) + λM
2
k−1
(u, q)
(1 + λ)maxdeg
−
(u, q)
+C
≤ (1 −C)
(1 + λ)mindeg
−
(u, q)
(1 + λ)maxdeg
−
(u, q)
| {z }
0≤∗≤1
+C ≤ 1
And
M
1
k−1
(u,q)+λM
2
k−1
(u,q)
(1+λ)maxdeg
−
(u,q)
is a non-negative number.
If the in-degree of node pair (u, q) equals zero, then
RS
2
k
(u, q) = C. Therefore, C ≤ RS
2
k
(u, q) ≤ 1 is satis-
fied. Since u ∈ V is a random node, we can infer that
C
n×1
≤ RS
2
k
(:, q) ≤ 1
n×1
.
Theorem 5.6. Triangle inequality: For any nodes
(a, b) ∈ V, the role similarity scores satisfy the follow-
ing inequality: d
k
(a, b) ≤ d
k
(a, q) + d
k
(b, q) where
d
k
(a, q) = 1 − RS
Γ
k
(a, q).
Proof. The proof of Theorem 5.6 employs the math-
ematical induction method. Since d
k
(a, q) = 1 −
RS
2
k
(a, q), Eq. (6) can be rewritten as follows:
d
k
(a, q) + d
k
(b, q) ≤ d
k
(a, b)
⇕ d
k
(a, q) = 1 − RS
2
k
(a, q)
1 − RS
2
k
(a, q) + 1 − RS
2
k
(b, q) − 1 + RS
2
k
(a, b) ≤ 0
⇕
RS
2
k
(a, q) + RS
2
k
(b, q) − RS
2
k
(a, b) ≤ 1
(7)
COMPLEXIS 2024 - 9th International Conference on Complexity, Future Information Systems and Risk
22
To ensure that Eq. 7 is satisfied, we first initialise
the role similarity scores at the iteration k = 0, as
RS
2
0
= Ones
n×n
, where n denotes the number of nodes
in the graph. At iteration k = 0, Eq. 7 can be written
as: RS
2
0
(a, q) + RS
2
0
(b, q) − RS
2
0
(a, b) = 1 +1 − 1 ≤ 1.
Thus, at iteration k = 0, Eq.7 holds. Next, assuming
that Eq.7 is satisfied at iteration k, we need to prove
that it also holds at the k + 1 iteration.
RS
2
k+1
(a, q) + RS
2
k+1
(b, q) − RS
2
k+1
(a, b)
=
(1 −C)
(1 + λ)
∑
(x,y)∈M
1
k
(a,q)
RS
2
k
(x, y)
maxdeg
−
(a, q)
+
∑
(y,z)∈M
1
k
(b,q)
RS
2
k
(y, z)
maxdeg
−
(b, q)
−
∑
(x,z)∈M
1
k
(a,b)
RS
2
k
(x, z)
maxdeg
−
(a, b)
| {z }
β1
+λ
∑
(
x
′
,y
′
)
∈M
2
k
(a,q)
RS
2
k
x
′
, y
′
maxdeg
−
(a, q)
+
∑
(
y
′
,z
′
)
∈M
2
k
(b,q)
RS
2
k
y
′
, z
′
maxdeg
−
(b, q)
−
∑
(
x
′
,z
′
)
∈M
2
k
(a,b)
RS
2
k
x
′
, z
′
maxdeg
−
(a, b)
|
{z }
β2
+C
For general purposes, we assume deg
−
a
≤ deg
−
q
≤
deg
−
b
. The equation β1 can be generated as follows:
β1 = (
1
deg
−
q
−
1
deg
−
b
)
∑
(x,y)∈M
1
k
(a,q)
RS
2
k
(x, y)
+
1
deg
−
b
(
∑
(x,y)∈M
1
k
(a,q)
RS
2
k
(x, y) +
∑
(y,z)∈M
1
k
(b,q)
RS
2
k
(y, z) −
∑
(x,z)∈M
1
k
(a,b)
RS
2
k
(x, z))
Then we define a matching M A
1
k
(b, q) =
{(y, z)|(x, y) ∈ M
1
k
(a, q)
V
(x, z) ∈ M
1
k
(a, b)}. I(q) can be devided into
two parts I(q1) and I(q2), where I(q1)
−
=
{y|y ∈ M
1
k
(a, q)} and I(q2) = I(q) − I(q1). So
M A
1
k
(b, q) = M AI
1
k
(b, q) + M A II
1
k
(b, q), where
M AI
1
k
(b, q) = {(y, z)|y ∈ I(q1), z ∈ I(b)}, and
M AII
1
k
(b, q) = {(y, z)|y ∈ I(q2), z ∈ I(b)}. Accord-
ing to the Lemma 5.1, we have:
β1 ≤ (
1
deg
−
q
−
1
deg
−
b
)deg
−
a
+
1
deg
−
b
(
∑
(x,y)∈M
1
k
(a,q)
RS
2
k
(x, y) +
∑
(y,z)∈M A I
1
k
(b,q)
RS
2
k
(y, z)
+
∑
(y,z)∈M A II
1
k
(b,q)
RS
2
k
(y, z) −
∑
(x,z)∈M
1
k
(a,b)
RS
2
k
(x, z))
≤ (
1
deg
−
q
−
1
deg
−
b
)deg
−
a
+
1
deg
−
b
(deg
−
a
+ deg
−
a
+ deg
−
q
− deg
−
a
− deg
−
a
) ≤ 1
β2 has the similar trend as β1, which is
β2 ≤ 1. RS
2
k+1
(a, q) + RS
2
k+1
(b, q) − RS
2
k+1
(a, b) ≤
(1−C)
(1+λ)
(1 + λ) + C ≤ 1 The proof shows that
RS
2
k+1
(a, q) + RS
2
k+1
(b, q) − RS
2
k+1
(a, b) ≤ 1, which
implies RS
2
k
(a, q) + RS
2
k
(b, q) − RS
2
k
(a, b) ≤ 1 holds
with random choose k. This in turn implies d
k
(a, q) +
d
k
(b, q) ≤ d
k
(a, b).
6 COMPUTATION
OPTIMIZATION
This section introduces two techniques aimed at ac-
celerating the computation of FaRS. These tech-
niques effectively reduce the number of calls made
to the maximum matching algorithm and exploit
“shared” information to minimize repetitive opera-
tions. The resulting accelerated algorithm is referred
to as Opt FaRS.
6.1 Pruning Approach
The methodology of Opt FaRS comprises two stages:
the pre-processing phase and the iterative computa-
tion phase. In the pre-processing phase, the algorithm
involves extracting the tracking path and comput-
ing the candidate pool.
Definition 2 (Multi-Hop Backward Tracking
Path). Given a connected graph G = (V, E), a query
q ∈ V, and the number of total iterations K defined in
FaRS, the tracking path P with respect to query q is
denoted as P(q) =< p
1
, p
2
. . . , p
L
>, where p
i
repre-
sents the set of i
th
-hop backward tracking nodes with
respect to query q, and L is the actual number of itera-
tions performed by the FaRS algorithm before conver-
gence, which is also known as the level of the tracking
path. It satisfies the condition 1 ≤ L ≤ K. P is itera-
tively defined as follows and any repeated nodes in p
l
are e removed from the set to ensure uniqueness:
(
p
1
= {q}
p
l
= I (x
1
)
S
I (x
2
)···
S
I (x
|p
l−1
|
)where x
1
, x
2
, . . . , x
|p
l−1
|
∈ p
l−1
(8)
The tracking path is determined by the query node
and the structure of the graph. This calculation can be
illustrated using the following example.
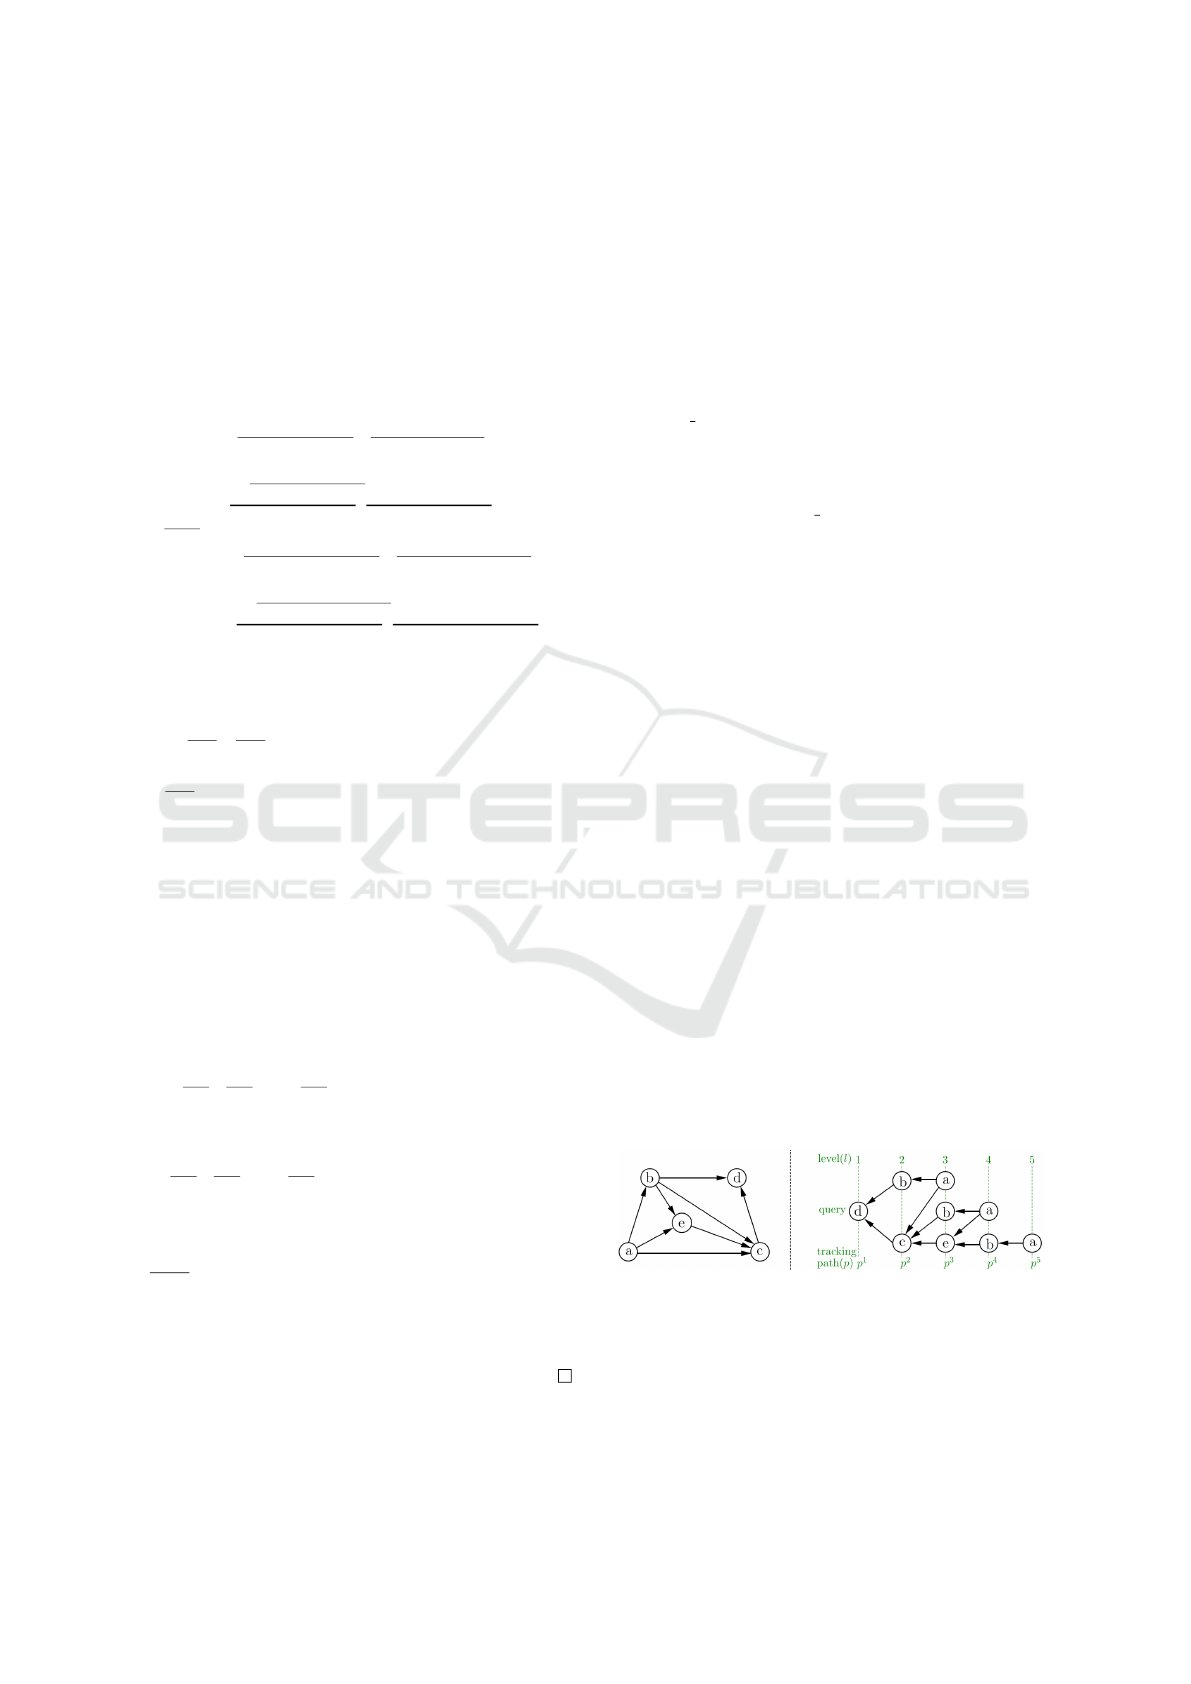
Example 6.1. Consider a graph G with five nodes,
a query q = d, and the number of iterations K = 6 in
FaRS, as shown in the left side of Figure 4. The track-
ing paths generated according to Eq. (8) are depicted
on the right side of Figure 4.
Figure 4: Left side: Example of Graph G. Right side:
Multi-Hop Backward Tracking Path of the Graph G.
In Figure 4, the track path represents a traverse
starting from the query node d. As per Definition 2,
the second element in the track path represents the in-
neighbour nodes of the query node d; thus, we ob-
tain p
2
= {b, c}. To generate p
3
, we apply Eq.(8)
FaRS: A High-Performance Automorphism-Aware Algorithm for Graph Similarity Matching
23

and obtain the following: p
3
= I (p
2
) = I (b)∪ I (c) =
{a, a, b, c}. After eliminating the repeated elements,
the final result is p
3
= {a, b, c}. p
4
and p
5
can be cal-
culated in a similar way. It is worth mentioning that
the tracking path terminated at p
5
= a and where a
has an in-degree of zero, ensuring convergence.
The objectives of extracting the tracking path P of
a graph G in relation to q are twofold: firstly, it can
significantly reduce the computation of redundant in-
formation; secondly, it can decrease the number of
iterations required for FaRS. When the level number
L of the tracking path is less than the given iteration
number K, it suffices to perform only L times itera-
tions. This is because, based on the structure of the
graph, the role similarity scores converge after L iter-
ations, implying that FaRS
Γ
k
= FaRS
Γ
L
(L ≤ k ≤ K).
Given the definition of the graph’s tracking path,
we can explain how to generate candidate pools (CP)
by using the tracking path elements as indices.
Definition 3 (Candidate pool). Given P =<
p
1
, p
2
. . . , p
L
> as a track path of a connected graph
G, a candidate pool is defined for each p
l
in P. Each
candidate pool is a subset of the similarity matrix,
consisting of a fixed number of rows that include
all the nodes in G with out-neighbors. These nodes
are denoted as out, defined as out = {x ∈ V|O(x) ̸=
/
0}. The columns of each candidate pool are deter-
mined by the corresponding tracking path element p
l
.
During the kth iteration of the FaRS algorithm, the
candidate pool CP
Γ
k
can be represented as: CP
Γ
k
=
RS
Γ
k
(out, p
l
) (l = K − k + 1, 1 < k ≤ L).
Here, RS
Γ
k
denotes the role similarity score matrix
of all node pairs in the graph generated by the FaRS
algorithm, and CP
Γ
k
is the candidate pool for the kth
iteration.
It can be observed that during the computation of
RS
Γ
k
, only those similarity values from CP
Γ
k
would be
updated at each iteration. The size of CP
Γ
k
is typi-
cally much smaller than RS
Γ
k
because the number of
nodes with out-neighbors (i.e., the candidate pool’s
row) is smaller or equal to the total number of nodes
in the graph, and the length of each element in the
track path (i.e., the candidate pool’s column) is much
smaller than the total number of nodes in the graph
(i.e., |out| ≤ n and |p
l
| ≪ n, where n is the total num-
ber of nodes in the graph). In previous studies on
RoleSim, all node pairs’ (n × n) role similarity scores
had to be computed at each iteration. In contrast,
our proposed Opt FaRS algorithm leverages the can-
didate pool concept to reduce the computation cost
of each iteration to the information retrieval range
(|out| × |p
l
|).
Based on the computation formula of FaRS
(Eq. 6) and the candidate pool definition, we propose
an efficient single-source similarity search algorithm
called Opt FaRS, which can be expressed mathemati-
cally as follows:
Theorem 6.1. Let G = (V, E) be a connected graph,
and let q be a random query with corresponding track
path P =< p
1
, p
2
. . . , p
L
>. Then, the candidate pool
at iteration k can be updated as follows:
RS
Γ
k
(out, j) = CP
Γ
k
(:, j) =
(1 −C)(M
1
k−1
(:, j) + λM
2
k−1
(:, j) + · · · + λ
Γ−1
M
Γ
k−1
(:, j))
⊘ (1 + λ + · · · + λ
Γ−1
)MAXDEG
−
(:, j) +C
|out|×1
j ∈ p
L−k+1
(9)
Here, j represents a node in track path p
L−k+1
.
The track path p
L−k+1
determines the column index
of the candidate pool, so the candidate pool at it-
eration k is given by RS
Γ
k
(out, p
L−k+1
) = CP
Γ
k
. The
vector MAXDEG
−
(:, j) represents the maximum in-
degree between node j and each node in out, respec-
tively. The vector M
Γ
k−1
(:, j) represents the top Γ max-
imum weighted matching of the node pair (i, j) in-
neighbour similarity matrix, where i ∈ out at iteration
(k −1).
The Opt FaRS algorithm comprises two key steps.
Firstly, the algorithm retrieves the tracking path P of
the connected graph G starting from the query node
q. Secondly, the algorithm generates the candidate
pool for the tracking path at iteration k. Finally, the
role similarity scores with respect to the query node
q are computed as follows: Opt FaRS(:, q) = RS
Γ
K
(:
, q) = CP
Γ
K
. Here, the size of CP
Γ
K−1
is |out| × p
2
,
and the size of CP
Γ
K
is n × 1 (|out| ≤ n). Next, we
set the value of the difference index between n and
out to C to ensure that the sizes of CP
Γ
K
and RS
Γ
K
(:
, q) are consistent. It is important to note that when
MAXDEG
−
(out, j) = 0, the result of Eq. 9 is equal
to C
out×1
. The proof of this method is omitted here to
save space.
In addition to Theorem 6.1, in the next, we present
exceptional cases that contribute positively to the
speed-up of the Opt FaRS algorithm. We introduce
two speed-up approaches to reduce the computational
complexity of Opt FaRS for candidate pool compu-
tation. One approach optimizes column generation,
while the other optimizes row generation.
6.2 P-Speedup Approach
Based on Eq. 9, the column indexes of candidate
pools are determined by the corresponding track path.
Therefore, we have named our speed-up approach on
column generation the P-Speedup Approach.
There are two exceptional cases of the Fast Role
Selection (FRS) algorithm, where FRS can retrieve
COMPLEXIS 2024 - 9th International Conference on Complexity, Future Information Systems and Risk
24

the role similarity scores without the need to use the
maximum matching algorithm.
Definition 4 (Exceptional cases). Given a graph
G(V, E), we define two special sets of nodes:
• One-hop. This set consists of all the nodes in G
with in-degrees equal to zero. We denote this set
as V
(1)
, and it can be formally defined as: V
(1)
=
{i | deg
−
i
= 0, i ∈ V }.
• Two-hop. This includes all the nodes in G where
all their in-neighbors have in-degrees equal to
zero. We define the two-hop node set (denoted
as V
(2)
) mathematically as: V
(2)
= {i | deg
−
I (i)
= 0, i ∈ V },
where I (i) is the set of in-neighbours of node i in
the graph.
We observe that in the presence of exceptional cases
in a graph node, such as belonging to the one-hop set
or two-hop set, the candidate pool value can be gen-
erated directly.
Lemma 6.2. Given a graph G is a connected graph,
and let j be a query column ( j ∈ p
k
).
• If node j belongs to the one-hop set V
(1)
, then the
candidate pool value CP
Γ
k
(:, j) can be generated
as follows: CP
Γ
k
(:, j) = C
out×1
, where C
out×1
is a
column vector (with length equal to the number of
|out|) containing Cs in all entries. Note that the
role similarity scores of CP
Γ
k
(:, j) will not change
in the subsequent iteration.
• If node j belongs to V
(2)
, then the candidate
pool value CP
Γ
k
(:, j) can be generated as follows:
CP
Γ
k
(:, j) = (1 − C)(C · MINDEG
−
(out, j) ⊘
MAXDEG
−
(out, j) + 1
out×1
). Here, 1
out×1
is a
column vector (with size equal to |out|, containing
all 1s. In this exceptional case, the role similarity
scores converge at iteration k = 2.
6.3 Out-Speedup Approach
Lemma 6.2 indicates that optimizing the computation
of CP
Γ
k involves considering column index nodes
that belong to exceptional cases. In this subsection,
we further enhance the computation of CP
Γ
k by fo-
cusing on specific rows of the CP
Γ
k
matrix. The row
indices for each candidate pool are determined by out,
and thus we refer to the method of accelerating the
row nodes as the out-speedup approach. This opti-
mization is based on the observation that it is unnec-
essary to compute a similarity score using the com-
putationally expensive maximum weighted matching
algorithm if a node can reach a root node of the graph
(a node with no incoming edges) within two hops of
traversal. This observation enables us to propose an
optimization strategy that accelerates the computation
of FaRS by avoiding unnecessary calls to the maxi-
mum weighted matching algorithm for certain node
pairs, as described in Lemma 6.3.
Lemma 6.3. Given a graph G(V, E), an iteration
number k, a query column j ( j ∈ p
k
), and any node
i(i ∈ out), we have the following:
1. If node i belongs to the one-hop set V
(1)
, then
M
Γ
k
(i, j) = 0.
2. If node i belongs to the two-hop set V
(2)
, then
M
Γ
k
(i, j) = C.
3. Otherwise, the maximum weighted matching of
CP
Γ
k−1
is generated. Before introducing the com-
putation method, we define several notions. The
maximum matching result of CP
Γ
k−1
is denoted as
M [CP
Γ
k−1
], and the matched set of the maximum
matching on CP
Γ
k−1
is represented by
f
M [CP
Γ
k−1
].
The in-neighbor similarity matrix of the node pair
(i, j) is defined as Bi j. The maximum match-
ing result of B i j is denoted as M [B i j], and the
matched set of the maximum matching on Bi j
is denoted as
f
M [Bi j]. The matched values of
CP
Γ
k−1
in Bi j are defined as M [B
i j
, CP
Γ
k−1
], and
the number of matched values of CP
Γ
k−1
in B
i j
is
denoted as |M [B
i j
, CP
Γ
k−1
]|.
- If the minimum value between deg
−
i
and deg
−
j
is equal to |M [B
i j
, CP
Γ
k−1
]|, then we can assert
that M
Γ
k
(i, j) = M [CP
Γ
k−1
].
- If the minimum value between deg
−
i
and deg
−
j
exceeds |M [B
i j
, CP
Γ
k−1
]|, then we can decom-
pose this into two cases:
- The matched values in |M [B
i j
, CP
Γ
k−1
]| are
the maximum value of both the column and the
row of the bipartite matrix B
i j
. We can then
calculate the value of M
1
k
(i, j) by M
1
k
(i, j) =
sum(M [B
i j
, CP
Γ
k−1
]) + M (B
rem
i j
) . Here, the operation
sum denotes the sum of the matched values be-
tween the bipartite graph B
i j
and M [CP
Γ
k−1
].
We then eliminate the matched elements’ rows
and columns from the bipartite graph, which
we define as B
rem
i j
. The value M (B
rem
i j
) repre-
sents the maximum matching score of the re-
maining bipartite graph.
- otherwise, the value of M
1
k
(i, j) is as follows:
M
1
k
(i, j) = M [B
i j
], where M [B
i j
] is the max-
imum matching value of the in-neighbour sim-
ilarity matrix B
i j
.
In summary, our research has revealed that not all
node pairs in each iteration have a significant im-
pact on the final role similarity scores of column
q. Building upon this insight, the Opt FaRS algo-
rithm efficiently extracts the influential information
FaRS: A High-Performance Automorphism-Aware Algorithm for Graph Similarity Matching
25

during each iteration, eliminating the calculation of
unnecessary scores. These optimization techniques
greatly reduce the number of calls to the maximum
matching algorithm, which is particularly beneficial
for large graphs where this algorithm can be com-
putationally expensive. Furthermore, Opt FaRS cap-
tures and reuses the “shared” information, avoiding
redundant computations. The key advantage of the
Opt FaRS algorithm is its significant improvement in
computational efficiency without compromising ac-
curacy.
7 EXPERIMENTAL EVALUATION
We empirically evaluate the performance of our pro-
posed algorithms, FaRS and Opt FaRS, on real-world
datasets. We compare them with baseline algorithms
and assess their efficiency using three metrics: the im-
pact of coefficient choices on FaRS accuracy, as well
as accuracy and time efficiency.
7.1 Experimental Settings
Datasets. We evaluate our algorithms using the
publicly available email-Eu-core-temporal dataset
(EU) obtained from SNAP (https://snap.stanford.edu/
index.html). This dataset consists of anonymized
email data from a research organization, represent-
ing the network of incoming and outgoing emails be-
tween members. The dataset sizes are summarized in
Table 1.
Table 1: Description of Datasets.
Datasets #-Nodes #-Edges Type
email-Eu-core 986 24,929 Directed
(EU)
Department 1 309 3,031 Directed
(Dept-1)
Department 2 162 1,772 Directed
(Dept-2)
Department 3 89 1,506 Directed
(Dept-3)
Department 4 142 1,375 Directed
(Dept-4)
Compared Algorithms. We evaluated FaRS and
Opt FaRS on the aforementioned real-life datasets,
comparing them with three state-of-the-art similar-
ity search competitors (CSR, RoleSim, and FaRS N).
CSR (Rothe and Sch
¨
utze, 2014) calculates the
CoSimRank score using the dot product of Person-
alized PageRank vectors. RoleSim (Lee, 2012) is a
state-of-the-art role similarity search algorithm based
on average maximum matching. FaRS N is an al-
ternative version of FaRS that computes the aver-
age maximum matching of the remaining in-neighbor
similarity matrix instead of using the top Γ maximum
matching.
Parameters. We use the following default parame-
ters: (a) the decay factor C = 0.2; (b) the number of
iterations K = 5; (c) the order of maximum matching
Γ = 3; and (d) the relative weight λ = 0.7.
Evaluation Metrics. The evaluation of role similar-
ity ranking on real-life datasets was performed using
k-means clustering (Arthur and Vassilvitskii, 2006;
Lloyd, 1982; Bock, 2007). To establish the ground
truth, we initially computed the role similarity score
matrix using our algorithms and other baseline al-
gorithms. Subsequently, k-means clustering was ap-
plied to the various role similarity score matrices to
group the data into multiple clusters. According to the
inherent characteristics of k-means clustering, nodes
within the same cluster exhibit higher role similarity
scores. For each query, we extracted the top 20 nodes
that displayed the greatest similarity to the query node
in each algorithm. The cluster to which the query
node belonged was identified through k-means clus-
tering. Finally, we determined the number of nodes
that were common between the top 20 nodes most
similar to the query in each algorithm and the nodes
within the query cluster. A higher overlap ratio signi-
fies greater accuracy.
Experiments were carried out on a PC with an In-
tel Core i7-6700 3.40GHz CPU, 64GB of memory,
and Windows 10. Each experiment was repeated five
times, and the average results are reported.
7.2 Experimental Results
The experimental results consist of three parts: pa-
rameter evaluation, accuracy assessment, and time ef-
ficiency analysis.
Hyper-Parameter Evaluation. For demonstrate the
effectiveness of the FaRS approach, we first apply it
to a real-life dataset to determine the optimal values of
two parameters, namely λ and Γ. We implement our
algorithm on the Dept-3 dataset and evaluate its accu-
racy using different parameter values. To assess ac-
curacy, we generate a role similarity score matrix for
the graph and utilize the k-means clustering method.
Figure 5 shows the accuracy of the FaRS algo-
rithm on the Dept-3 dataset for various λ values. The
y-axis represents the accuracy ratio, calculated based
on the number of duplicate nodes between two sets.
One set consists of the top 20 nodes with the high-
COMPLEXIS 2024 - 9th International Conference on Complexity, Future Information Systems and Risk
26
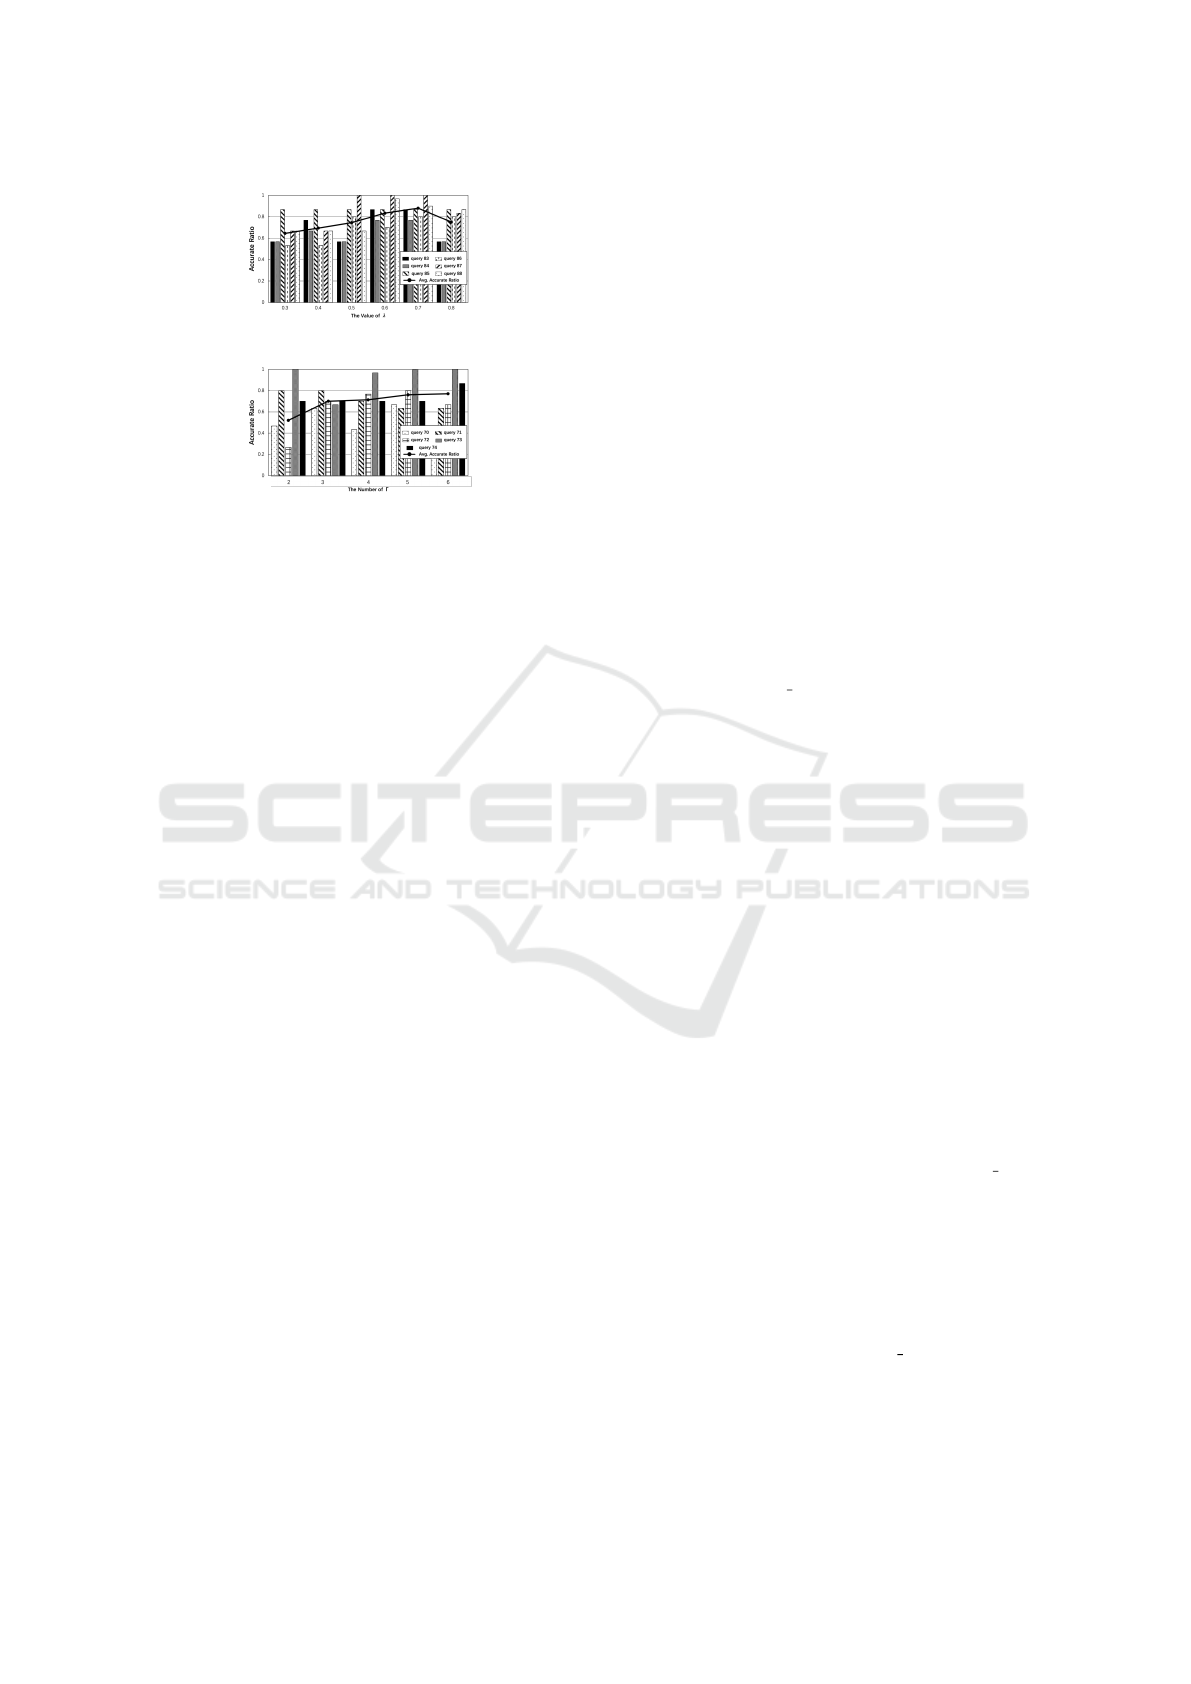
Figure 5: Hyper-Parameter Evaluation( λ).
Figure 6: Hyper-Parameter Evaluation( Γ).
est role similarity scores to the query node, while the
other set consists of nodes in the same k-means group
as the query node. We selected six different λ val-
ues (λ = [0.3, 0.4, 0.5, 0.6, 0.7, 0.8]) and query nodes
(Q = [83, 84, 85, 86, 87, 88]). Figure 5 shows that λ =
[0.6, 0.7] yield relatively high accuracy ratios, partic-
ularly for query 87. The line chart in Figure 5 repre-
sents the average accuracy ratio for different λ values.
It can be observed the FaRS algorithm achieves the
highest accuracy ratio when λ = 0.7. Similar results
were obtained for other datasets, confirming the se-
lection of λ = 0.7 for future experiments.
Similarly, Figure 6 presents the accuracy of the
FaRS algorithm on the Dept-3 dataset for different Γ
values. We selected five Γ values (Γ = [2, 3, 4, 5, 6])
and query nodes Q = [70, 71, 72, 73, 74]. The accu-
racy for each Γ value is the average of five trials due
to the varying k-means clustering groups. The bar
chart in Figure 6 displays the accuracy of different
queries for each Γ value, while the line chart shows
the average accuracy ratio for the five queries. The al-
gorithm achieves improved accuracy as Γ increases,
with a significant enhancement at Γ = 3. Beyond
Γ = 3, the accuracy improvement becomes less pro-
nounced. Hence, the optimal performance is achieved
with Γ = 3, providing high accuracy with minimal
time consumption.
Accuracy Evaluation. The accuracy of the algo-
rithms is assessed using two methods: k-means clus-
tering and evaluation based on the network’s char-
acteristics. We evaluate the performance on the EU
dataset, which represents the communication network
within an organization. The dataset includes four
departments: Department 1 (Dept-1), Department 2
(Dept-2), Department 3 (Dept-3), and Department 4
(Dept-4), and the remaining employees. Given the
network structure, employees within the same depart-
ment exhibit higher role similarity compared to those
from different departments. Consequently, we divide
the EU dataset into five partitions based on the depart-
ments and the remaining employees.
To evaluate the accuracy of the algorithms, we
randomly select a node from each part of the dataset
as a query and test the number of nodes in the corre-
sponding department among the top 20 similar nodes
to the query in different algorithms. This approach
justifies our choice of datasets for evaluating the al-
gorithms.
We evaluate the algorithms using k-means clus-
tering on the mail exchange network of each depart-
ment individually. With a partition number of k = 6
and a list of 20 ordered nodes for each query, we as-
sess the accuracy ratios of the different algorithms
on the four datasets. Figure 7a illustrates the results.
We observe that the CSR algorithm exhibits relatively
low accuracy in role similarity search on each dataset.
The RoleSim algorithm achieves higher accuracy than
CSR but falls short of the FaRS algorithm. Notably,
the FaRS algorithm consistently outperforms all other
algorithms in role similarity detection on the four
datasets. The FaRS N algorithm demonstrates bet-
ter accuracy than RoleSim and CSR, but it does not
match the performance of the FaRS algorithm.
Next, we evaluate the accuracy of our algorithms
and other baselines on the EU dataset. Four nodes
are randomly selected from each department to form
the query set, with each query corresponding to its re-
spective department. The top 20 nodes are ranked,
and we assess the highest role similarity scores of
each algorithm with respect to the query. The number
of nodes belonging to the query’s department among
the top 20 nodes is determined to measure the al-
gorithm’s accuracy. Figure 7b presents the results.
The FaRS algorithm consistently achieves a high
level of accuracy, followed by the RoleSim algorithm.
Conversely, the CSR algorithm consistently exhibits
lower accuracy in role similarity search. Consider-
ing the findings from Figure 7a and Figure 7b, we
can conclude that the FaRS algorithm outperforms the
well-known algorithms, CSR and RoleSim, on the five
real-life datasets.
Lastly, we assess the accuracy of the Opt FaRS
algorithm on the EU dataset, which is an accelerated
method based on FaRS. To compare its accuracy with
that of FaRS, we focus on the Dept-4 dataset. Random
query sets are selected, varying in size from 10 to 30.
For each query set Q, we measure the similarity rank-
ing results using Normalized Discounted Cumulative
Gain (NDCG) (Wang et al., 2013) based on the role
similarity scores obtained from Opt FaRS. An NDCG
score of 1 indicates that the results of the compared al-
gorithm perfectly match those of FaRS, without any
loss in accuracy. Figure 7c illustrates the NDCGs of
FaRS: A High-Performance Automorphism-Aware Algorithm for Graph Similarity Matching
27
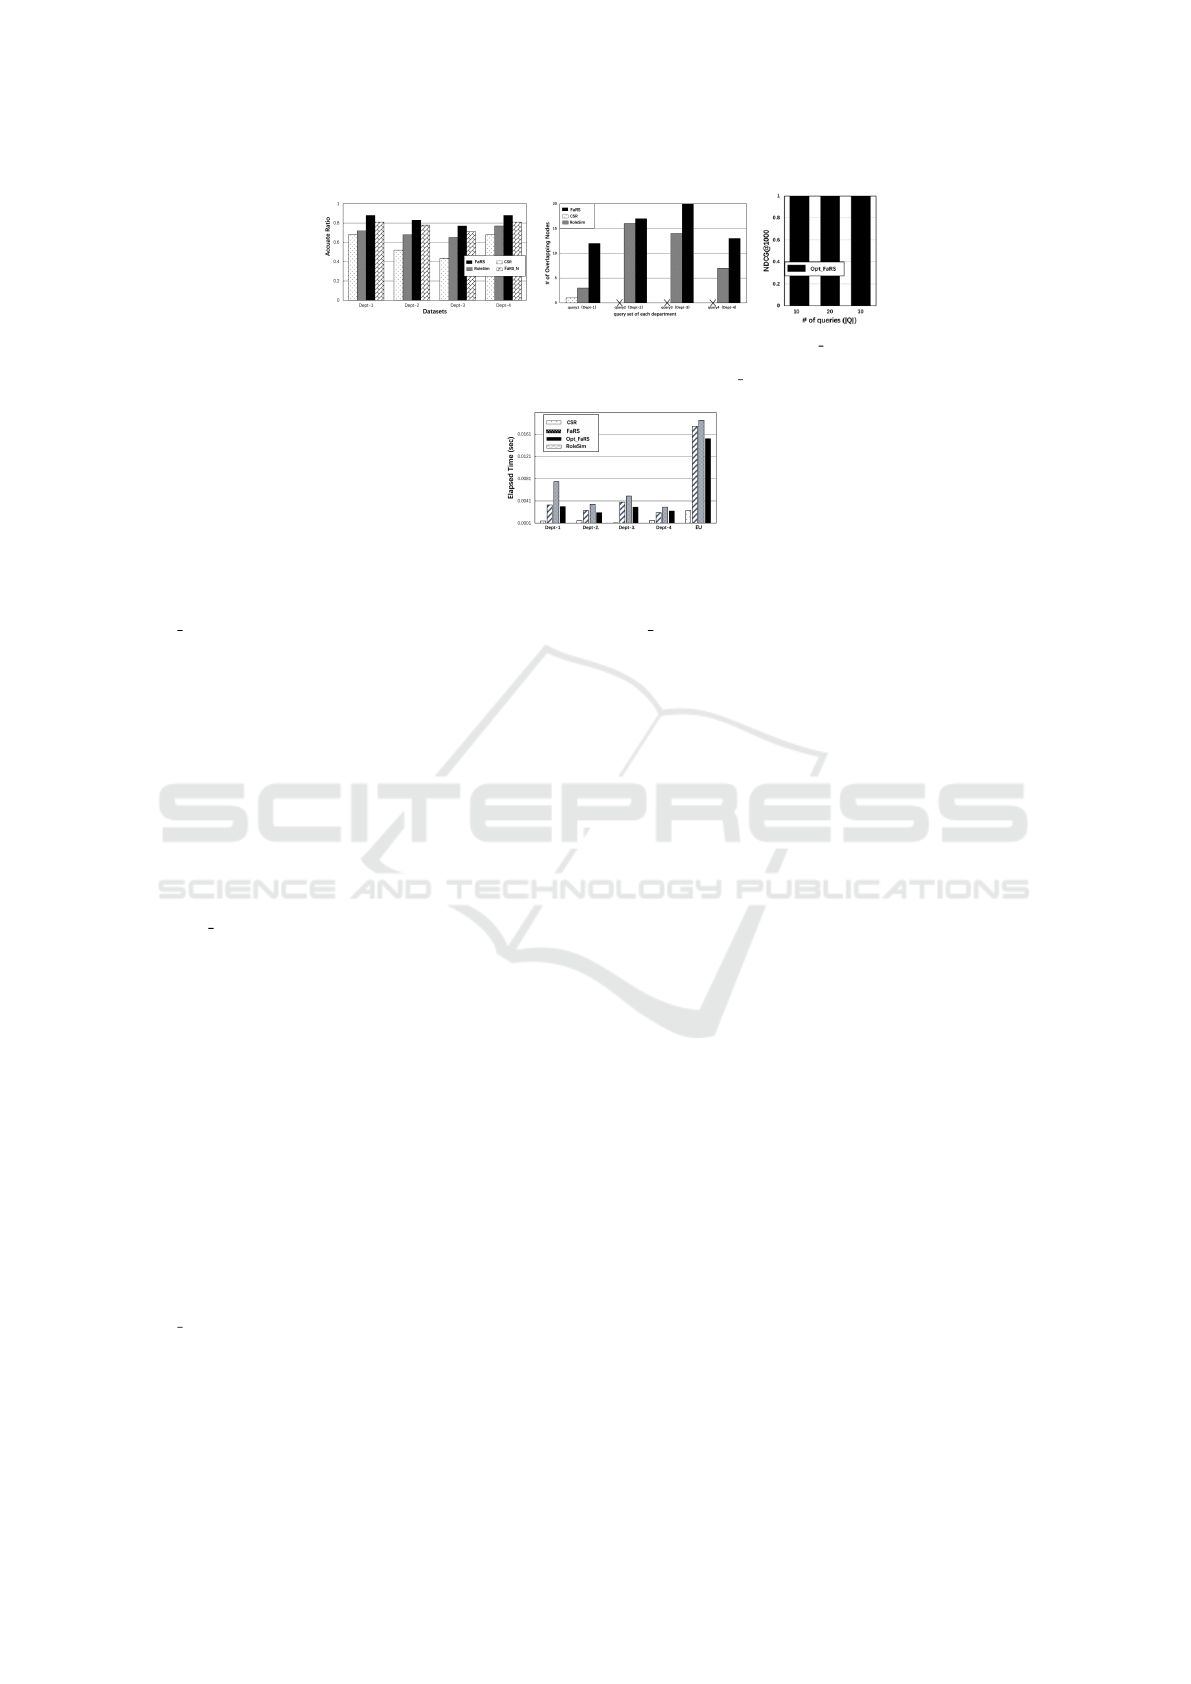
(a) FaRS(Dept Dataset). (b) FaRS(EU Dataset). (c) Opt FaRS.
Figure 7: Accuracy Evaluation of FaRS & Opt FaRS.
(a) Time Efficiency.
Figure 8: Efficiency.
Opt FaRS for each query set Q, all of which are 1.
This implies that achieves the same level of accuracy
as FaRS, affirming the correctness of Lemma 6.3.
Efficiency Analysis. Figure 8a shows the efficiency
of our proposed algorithms and baseline approaches
across five authentic networks. The elapsed time re-
sults from computing the single-source role similar-
ity scores for each query, where |Q| = 20 queries are
randomly selected for each dataset. Our proposed
FaRS and RoleSim algorithms exhibit comparable ef-
ficiency performance on all five datasets. While the
CSR algorithm entails relatively lower time costs, its
role classification accuracy is suboptimal. Notably,
the Opt FaRS algorithm demonstrates significant ef-
ficiency gains, outperforming both the FaRS and
RoleSim algorithms across all five real-life datasets.
8 CONCLUSION
This paper presents a precise algorithm for single-
source role similarity search, namely FaRS, which
is based on graph topology. The FaRS algorithm
is capable of capturing more information from the
node-pair in-neighbour role similarity scores matrix
than the RoleSim algorithm, thus ensuring greater
accuracy. Additionally, we provide proofs for the
convergence, uniqueness, symmetry, boundedness,
and triangular inequality of the FaRS algorithm.
Furthermore, we propose an accelerated algorithm,
Opt FaRS, based on FaRS to enable more efficient
computation. Lastly, we evaluate our algorithms and
compare them with baseline algorithms using five real
datasets. The experimental results indicate that FaRS
algorithm yields a more precise role similarity value
compared to the baseline algorithms. Furthermore,
Opt FaRS algorithm significantly enhances the com-
putation speed of FaRS algorithm without compro-
mising its accuracy.
REFERENCES
Arthur, D. and Vassilvitskii, S. (2006). k-means++: The
advantages of careful seeding. Technical report, Stan-
ford.
Bock, H.-H. (2007). Clustering methods: a history of
k-means algorithms. Selected contributions in data
analysis and classification, pages 161–172.
Chen, X., Lai, L., Qin, L., and Lin, X. (2020). Structsim:
Querying structural node similarity at billion scale.
In 2020 IEEE 36th International Conference on Data
Engineering (ICDE), pages 1950–1953. IEEE.
Chen, X., Lai, L., Qin, L., and Lin, X. (2021). Efficient
structural node similarity computation on billion-scale
graphs. The VLDB Journal, 30(3):471–493.
Diao, L., Wang, H., Alsarra, S., Yen, I.-L., and Bastani, F.
(2019). A smart role mapping recommendation sys-
tem. In 2019 IEEE 43rd Annual Computer Software
and Applications Conference (COMPSAC), volume 2,
pages 135–140. IEEE.
Everett, M. G. (1985). Role similarity and complexity in
social networks. Social Networks, 7(4):353–359.
Gabow, H. N., Kaplan, H., and Tarjan, R. E. (2001). Unique
maximum matching algorithms. Journal of Algo-
rithms, 40(2):159–183.
Lee, V. E. (2012). RoleSim and RoleMatch: Role-based
similarity and graph matching. Kent State University.
Li, L., Qian, L., Lee, V. E., Leng, M., Chen, M., and Chen,
X. (2015). Fast and accurate computation of role
similarity via vertex centrality. In International Con-
ference on Web-Age Information Management, pages
123–134. Springer.
Lloyd, S. (1982). Least squares quantization in pcm. IEEE
transactions on information theory, 28(2):129–137.
COMPLEXIS 2024 - 9th International Conference on Complexity, Future Information Systems and Risk
28

Murty, K. G. (1968). An algorithm for ranking all the as-
signments in order of increasing cost. Operations re-
search, 16(3):682–687.
Rao, P. N., Devi, T., Kaladhar, D., Sridhar, G., and Rao,
A. A. (2009). A probabilistic neural network approach
for protein superfamily classification. Journal of The-
oretical & Applied Information Technology, 6(1).
Rothe, S. and Sch
¨
utze, H. (2014). Cosimrank: A flexible &
efficient graph-theoretic similarity measure. In Pro-
ceedings of the 52nd Annual Meeting of the Associa-
tion for Computational Linguistics (Volume 1: Long
Papers), pages 1392–1402.
Shahabi, C., Banaei-Kashani, F., Chen, Y.-S., and McLeod,
D. (2001). Yoda: An accurate and scalable web-based
recommendation system. In International Conference
on Cooperative Information Systems, pages 418–432.
Springer.
Shao, Y., Liu, J., Shi, S., Zhang, Y., and Cui, B. (2019). Fast
de-anonymization of social networks with structural
information. Data Science and Engineering, 4(1):76–
92.
Wang, Y., Lian, X., and Chen, L. (2018). Efficient sim-
rank tracking in dynamic graphs. In 2018 IEEE 34th
international conference on data engineering (ICDE),
pages 545–556. IEEE.
Wang, Y., Wang, L., Li, Y., He, D., and Liu, T.-Y. (2013). A
theoretical analysis of ndcg type ranking measures. In
Conference on learning theory, pages 25–54. PMLR.
Yang, R. (2022). Efficient and effective similarity search
over bipartite graphs. In Proceedings of the ACM Web
Conference 2022, pages 308–318.
FaRS: A High-Performance Automorphism-Aware Algorithm for Graph Similarity Matching
29
