
A Unified Teaching Platform for (No)SQL Databases
Vanessa Meyer
a
, Lena Wiese
b
and Ahmed Al-Ghezi
c
Institute of Computer Science, Goethe University Frankfurt, Robert-Mayer-Str. 10, 60325 Frankfurt am Main, Germany
Keywords:
Databases, NoSQL, Learning Tool, Learning Analytics.
Abstract:
Databases form the basic backend for information systems. This paper describes the development of a digital
learning tool to promote learning of (No)SQL databases like PostgreSQL, Cassandra, Neo4J and MongoDB
and the underlying data models using the React library. The learning tool will be uniformly connected to
each of the mentioned databases. Thus, students can enter and execute their database queries, which are
needed to solve tasks for a given example scenario, directly in our learning tool. This allows students to
fully concentrate on learning the respective query languages. In this study, we present the web application’s
architecture and front-end design, which will be continuously extended with additional components, such as
a learning analytics dashboard. With this approach we want to contribute to the improvement of teaching
methods in the field of databases and create a basis for the further development of interactive learning tools.
1 INTRODUCTION
In the evolving landscape of data management, sev-
eral datastores have been developed to cope with the
many characteristics of the data and the high diver-
sity of the application requirements. In information
systems, an appropriate database in the backend must
be chosen to enable effective and efficient data ac-
cess. For most flexible access, an information system
may integrate different data models and database sys-
tems under a common interface. It is hence manda-
tory to develop appropriate learning modules in aca-
demic database education showing the advantages as
well as disadvantages of different databases and data
models. In our academic coursework (a database
practical course), we emphasize the inclusion of four
distinct databases – PostgreSQL, Cassandra, Neo4J,
and MongoDB, highlighting the intrinsic educational
value of each database type. Each database repre-
sents a unique data model: PostgreSQL, a relational
database; MongoDB, a document-oriented database;
Cassandra, a wide-column store; and Neo4J, a graph
database. The exposure to these disparate data models
equips students with a comprehensive understanding
of structured and unstructured data handling, enhanc-
ing their proficiency across the spectrum of database
operations. The scalability and performance differ-
a
https://orcid.org/0009-0006-3394-6291
b
https://orcid.org/0000-0003-3515-9209
c
https://orcid.org/0000-0002-1683-0629
ences are also underlined by considering MongoDB’s
sharding-based scalability against Cassandra’s hori-
zontal and vertical scalability (Corbellini et al., 2017).
Such comparative analysis fosters an appreciation for
the varied strategies employed by different systems
to address critical operational issues. The practical
coursework further illuminates the intricacies of data
relationships and analysis. The relational model of
PostgreSQL and the graph data capabilities of Neo4J
offer contrasting techniques of managing data rela-
tionships, enhancing the students’ aptitude for opti-
mizing data modeling based on problem-specific re-
quirements (Angles et al., 2017). The students prac-
tice the behavior of the different systems according
to the same dataset. That enables the student to feel
the main pros and cons of each system. PostgreSQL
is chosen for its robustness, MongoDB for flexibil-
ity, Cassandra for scalability, and Neo4J for its graph
data capabilities (Sadalage and Fowler, 2013; Wiese,
2015). Our real-world application scenario empow-
ers students to translate theoretical knowledge into
industry-aligned skills, enhancing employability.
Contributions. In this paper we present our novel
database teaching platform that integrates the men-
tioned database systems under one common look-
and-feel interface. This enhances the learning process
of the students as well as the course evaluation. The
course was previously organized as follows: Students
received evaluation sheets in the form of an Excel or
374
Meyer, V., Wiese, L. and Al-Ghezi, A.
A Unified Teaching Platform for (No)SQL Databases.
DOI: 10.5220/0012724300003690
Paper published under CC license (CC BY-NC-ND 4.0)
In Proceedings of the 26th International Conference on Enterprise Information Systems (ICEIS 2024) - Volume 1, pages 374-381
ISBN: 978-989-758-692-7; ISSN: 2184-4992
Proceedings Copyright © 2024 by SCITEPRESS – Science and Technology Publications, Lda.

CSV file, which they had to complete for each of the
four database systems. Students filled in the evalua-
tion sheet with their executable database queries, par-
tial queries or descriptions. Students were also asked
to enter the actual time they needed for each task. A
self-assessment of whether their solution was correct
or incorrect and the perceived level of difficulty was
also entered manually by students. The evaluation of
these sheets is not only used for grading purposes, but
also to assess the success of the course. The previous
procedure for evaluating learning success was there-
fore purely retrospective.
Our web application presented in this paper
should therefore contribute to the improvement of
our practical course. With our web application, stu-
dents have uniform access to four different databases
and no longer need to switch between the differ-
ent database environments. Automated evaluation
of database queries means that (partial) solutions no
longer must be checked manually. In addition, ex-
ecutable queries no longer need to be copied into a
separate document such as the evaluation sheet. The
evaluation of the actual time needed and the self-
assessment of the perceived difficulty of tasks can also
be directly evaluated with our web application.
Outline. The outline of this work is as follows: In
the next Section 2, the architecture of the web appli-
cation is presented. This includes an overview of the
technologies used for frontend and backend as well
as the libraries used for database access and com-
munication between frontend and backend. We also
briefly explain the reasons for our choice of tech-
nology. In Section 3, we look at the frontend de-
sign. More specifically, the most important compo-
nents and functionalities of the web application are
described. We also discuss the database design used
to store user data for statistics. Section 4 deals with an
initial usability analysis of the web application, which
was carried out with the help of questionnaires com-
pleted by students. Finally, we summarize our con-
clusion and future outlook in the last Section 5.
2 ARCHITECTURE
Extending our previous work (Wiese et al., 2021) to
improve the learnability of the four considered differ-
ent database systems, we developed a uniform learn-
ing tool that supports access to the four database sys-
tems under a common hood. In Figure 1 the architec-
ture of the learning tool can be seen as a diagram.
For students to be able to interact with the
databases and to solve given tasks using the query
languages within the digital learning tool, a connec-
tion of the digital learning tool to the corresponding
database is required. Students can thus enter their
database queries in the text field of the query com-
ponent and execute the query with a click of a but-
ton and have the result of the query displayed. For
this, in the backend of the application, Node.js is used
together with the Express.js framework and the re-
spective database drivers to connect to each of the
databases. The middleware used includes the morgan,
bodyParser, and cors modules in Node.js. With this
unified database connection, it is no longer necessary
for students to deal with different database environ-
ments. They thus save time and can fully concentrate
on learning and practicing the databases and the asso-
ciated query languages.
We chose React as the front-end framework be-
cause of several advantages. The React framework
supports creating a visually appealing user interface
by leveraging JavaScript features. In addition, React
is easy to use and implement because it has a markup
syntax similar to hypertext markup language (HTML)
(Rajesh and Srikanth, 2014). One of the most im-
portant features of React is the virtual document ob-
ject model (DOM), which ensures that a page of the
application does not have to be constantly reloaded,
thereby increasing the overall efficiency of the appli-
cation. The node package manager (NPM)
1
is also
provided, with which external dependencies can be
easily installed. React also provides lifecycle meth-
ods to change the lifecycle of class components. For
functional components, we can change the lifecycle
using React Hooks. React is widely used as a frame-
work for application or interface development and is
used by many developers (Rawat and Mahajan, 2020).
MongoDB, Express
2
, React and Node.js
3
together
make up the so-called MERN stack. The four tech-
nologies mentioned in the MERN stack are charac-
terised by the fact that they are, among other things,
available free of charge, open source, and platform-
independent. In addition, the technologies are all
based on JavaScript and enjoy comprehensive support
from developers and the industry (Hoque, 2020).
We are expanding the MERN stack in our web ap-
plication by integrating other databases besides Mon-
goDB, namely PostgreSQL, Cassandra, and Neo4J.
Libraries mongoose
4
, pg
5
, cassandra-driver
6
and
1
https://www.npmjs.com/
2
http://expressjs.com
3
http://nodejs.org
4
https://mongoosejs.com/
5
https://www.npmjs.com/package/pg
6
https://www.npmjs.com/package/cassandra-driver
A Unified Teaching Platform for (No)SQL Databases
375

Webapplication
Frontend
ReactJS/
HTML/CSS/
Material-UI/
JavaScript
Backend
Node.js
Express.js
DB-Driver
pg
mongoose
neo4j-driver
cassandra-driver
PostgreSQL
MongoDB
Neo4J
Cassandra
axios
GET/POST
Response
Figure 1: Diagram of the architecture of the web application.
neo4j-driver
7
are used to establish the connection to
the databases and to execute queries, as well as to ob-
tain the results from the respective database.
Material UI: Material Design (Patel, 2016) is a de-
sign language developed by Google. With the help
of Material UI complex, responsive and mobile ap-
plications can be created. To use Material Design
in a React web application, you need to install the
Material UI library, which provides a variety of cus-
tomizable components. These components are self-
contained and help improve the performance of the
applications. Material UI also has strong community
support (Rawat and Mahajan, 2020).
Axios: The Axios
8
library is used for HTTP re-
quests to external resources. In React applications,
Axios can retrieve data from external APIs. Com-
pared to fetch, Axios offers a wider range of functions
and older browsers are also supported. The library
uses so-called promises to manage React and provides
get() and post() methods for corresponding HTTP get
and post requests (Rawat and Mahajan, 2020).
3 FRONTEND DESIGN
3.1 Learning Analytics Dashboard
If users are logged in, they are automatically navi-
gated to the dashboard (see Fig. 2), which serves as
the start page. The dashboard contains the dashboard
cards, which the user can use to access the various
task areas of the PostgreSQL, Cassandra, Neo4J and
MongoDB databases by clicking on the correspond-
ing button. In addition, a progress circle is displayed
on the dashboard card, which shows the progress of
7
https://www.npmjs.com/package/neo4j-driver
8
https://axios-http.com/
the processing of the tasks for the databases. If all
tasks belonging to a database have been finished and
the final submission has been made, the respective
progress circle shows 100%. Otherwise, the percent-
age is increased proportionally (starting point is 0%
if practicing with the tasks has not yet started). The
learning analytics area is located below the above-
mentioned dashboard cards. This contains various
charts that students can use to gain an overview of
their progress. In addition to the number of solved
tasks, executable and correct queries, the average pro-
cessing time (in minutes) per task and per database
is also displayed. A line chart has also been added,
which visualizes the progress of the number of exe-
cuted queries over time. The last 7, 14 or 21 active
days to be displayed in the chart can be selected here.
This gives users an overview of the number of queries
they have needed to solve the tasks over time.
3.2 Digital Exercise Sheets
Task Component: Four database models are con-
sidered in our learning tool: PostgreSQL, Cassandra,
Neo4J and MongoDB. A section is set up for each of
these databases, which can be accessed via the corre-
sponding card on the dashboard which is described in
more detail later. For each of the four data models and
databases, including PostgreSQL, Cassandra, Neo4J
and MongoDB, tasks are given for students to com-
plete. A specific use case is described in the assign-
ment. The tasks for the respective databases contain
the same example scenario and the same data set in or-
der to illustrate the differences between the databases
used. The digital learning tool includes a React task
component, which contains the tasks as well as the
possibility for students to work on given tasks as fol-
lows. In the respective task section, the tasks descrip-
tions are defined. A maximum processing time is set
for each task. The actual processing time of the stu-
dent will be measured during the task processing. A
timer component has been added to the task compo-
ICEIS 2024 - 26th International Conference on Enterprise Information Systems
376

Figure 2: Learning analytics dashboard of the learning tool.
nent for this purpose. The processing time begins as
soon as the start button on the respective task page
is clicked. Corresponding input fields for entering
solutions (database queries) and partial solutions are
placed below the task description. Below the input
fields there is a radio group where students can select
their perceived level of difficulty (Very easy, Easy,
Normal, Difficult, Very difficult). A button leads to
the next task page, which has the same structure, but
with a different task description. Another button al-
lows students to return to a previous task. If students
want to start with a different task first, they can skip
tasks and return to the skipped task later. Once all
tasks have been completed, students have the option
of downloading their solutions as an Excel file. In ad-
dition to the task, timer for the processing time and
input fields, the respective data model is displayed on
the right-hand side so that students can always keep
an eye on the structure of the database. We are also
working on an interactive solution so that students can
inspect the structure of the databases while they are
working on a task and search for a query that matches
the given task. The Task component was implemented
in a modular way, so that it can be adapted and used
for each database and the associated tasks with the
corresponding parameters. The task component used
in each case can be accessed via the dashboard and
the dashboard cards on it, which bear the title of the
respective database (see Fig. 2).
Query Component: One of the most important
components of the React app is the query component.
The query component uses certain editor text fields
(including syntax highlighting) for entering the corre-
sponding queries. A button to trigger the function for
executing the entered query is also part of the compo-
nent. For displaying the query results, we integrated
a component that displays the result as a graph (in the
case of Neo4J) and another component that displays
the result in a table. Error or success messages are
also displayed within the query component after the
query has been executed. The onClick() method asso-
ciated with the button uses axios.post to send the en-
tered query via the corresponding route to the server,
where the query is executed via a database driver.
In response, we receive the result from the database,
which is then visualized in the web application using
the ResultGraph and ResultTable components.
3.3 Statistics and Individual Feedback
Statistical data is collected continuously. The sta-
tistical data include the values entered in the digital
task sheets for the perceived difficulty of the task and
the time actually required to complete the task. Av-
erage values of all users are calculated, which stu-
dents can use as a comparison to their individual val-
ues. To visualize this course statistics, we integrated
bar charts and pie charts which are accessible via the
corresponding button on the dashboard. The dash-
board also provides a brief overview of the number
of users and which tasks were rated by the course as
particularly easy and which as particularly difficult.
The expected values of the teacher can also be used
as a guide in future. Based on these data and ex-
pectations, individual feedback can be automatically
given to students in addition to the assessment of a
completed task (task solved correctly or incorrectly).
The following user-related data is to be stored in the
database: Students work on four different task areas
(PostgreSQL, Cassandra, Neo4J, MongoDB). There
are several tasks per task area. For each task, the num-
ber of the task, the query entered, the executability of
the query (yes or no), the result size (number of tu-
ples, number of nodes and edges for neo4j), the cor-
rectness of the result (yes or no), the partial solution
(text), the perceived level of difficulty and the mea-
sured processing time are stored in a database.
A Unified Teaching Platform for (No)SQL Databases
377
3.4 Database Design
This section briefly describes the structure of the Post-
greSQL database, which is used to store and retrieve
the data required for the individual learning analytics
charts and for the course statistics.
We have created tables for the following:
• User (students): contains information about the
users (e.g. username, password)
• Task Area: Contains information about the differ-
ent task areas (area names: PostgreSQL, Cassan-
dra, Neo4J, MongoDB)
• Task Statements (Task Description): Contains in-
formation about the task statements in each area
and is linked to the task area
• User Task Data: Contains specific data entered by
users for each task; stores the query entered, fea-
sibility of the query, result size, correctness of the
result, partial solution, perceived degree of dif-
ficulty and measured processing time; linked to
user, task statement and task area
Figure 3 shows the tables with their attributes and
relationships.
User
PK
user_id
username
password
Task Area
PK
area_id
area_name
Task Statement
PK
statement_id
statement_text
FK
area_id
User Task Data
PK
data_id
FK
user_id
FK
statement_id
FK
task_area_id
query_text
is_executable
result_size
is_correct
partial_solution
difficulty_level
processing_time
Figure 3: ER diagram of a PostgreSQL data model for stor-
ing user data.
3.5 User Management and Use Case
Authentication: Before students can access the
learning app and the corresponding functionalities,
they must log in. We currently have predefined user-
names that we give to the students so that they can
log in to our learning tool. In future our application al-
lows students to log in using their university accounts.
To achieve this, we will use OAuth2 as the authenti-
cation protocol to securely access the university’s au-
thentication services. This approach eliminates the
need to implement our own user management and
thus store sensitive login credentials of users.
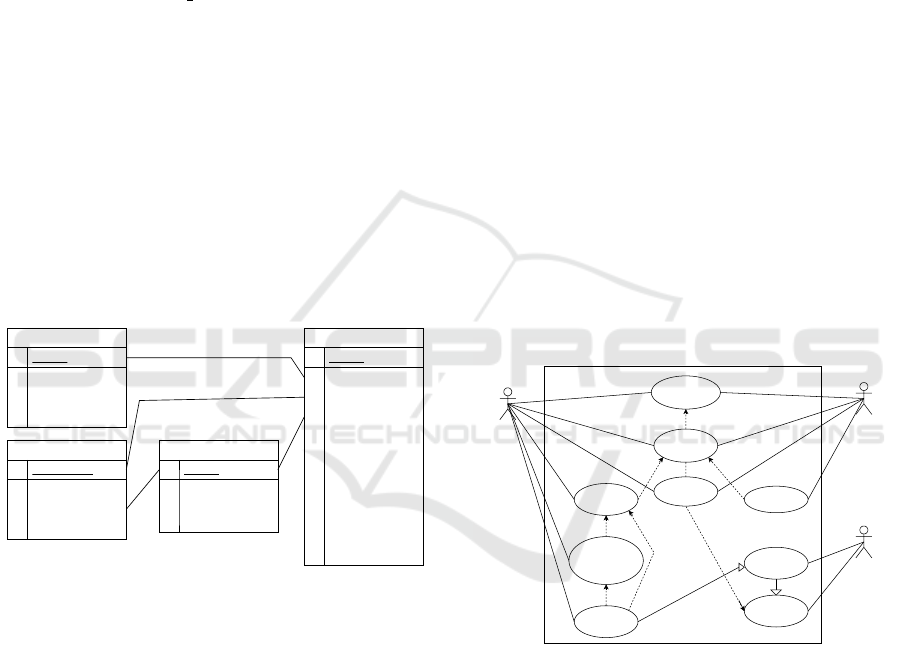
Use Case: Figure 4 shows the use case diagram of
our web application with an overview of how the web
application works. It shows three actors (student, ad-
min and the application itself) interacting with the
system. Within the system some main functionalities
are shown that can be performed by the actors.
In the following we will take a closer look at the
use case. An actor (student or admin) logs in to our
tool. The user’s login is mandatory for being able to
view the dashboard. This is illustrated by the include
relationship. After successfully logging in, the user is
automatically navigated to the dashboard. The user
can now start solving tasks and view course statis-
tics. The extend relationship therefore expresses the
optional functions. In future, an admin (e.g. a course
instructor) will also be able to add their own areas
with tasks to the dashboard. The function of being
able to add task areas has not yet been implemented.
Within the task areas, students give a self-
assessment of the time they need for tasks and the per-
ceived level of difficulty. To submit solutions, tasks
should have been completed and a corresponding self-
assessment should be included. If the submission is
triggered and all entries are saved, the system will
evaluate the students’ submissions automatically and
statistics are adjusted including the new entries.
System
Student
Admin
Application
Create
spaces
Solve
tasks
Automated
evaluation
Statistics
Provide
self-
assessment
Login
(OAuth2)
View
dashboard
View
statistics
Submit
<<include>>
<<extend>>
<<extend>>
<<extend>>
<<include>>
<<include>>
<<include>>
<<extend>>
Figure 4: Use case diagram to show user interactions with
the system.
3.6 Accessibility and Diversity
Another aspect that we want to consider when devel-
oping our web application is accessibility and diver-
sity. In the scenario descriptions of the tasks, special
emphasis is placed on gender-neutral and simple lan-
guage. Our web application will also continuously be
tested for intuitiveness and user-friendliness. As al-
ready mentioned, our web application allows students
to rate the tasks based on different levels of difficulty.
In addition, the needed time for each task is measured.
ICEIS 2024 - 26th International Conference on Enterprise Information Systems
378
This makes it possible to gain an insight into the stu-
dents’ perceptions. If the perceived levels of difficulty
or needed time for tasks do not match those that we
previously expected, the tasks for the course can be
adjusted accordingly. The learning tool is also con-
tinuously improved and adapted to the needs of the
students by ongoing evaluation.
The integration of accessibility into our web ap-
plication is also of fundamental importance. To make
our learning tool more accessible for everyone, we
will consider the following aspects and gradually in-
clude them into our learning tool:
We use HTML elements or predefined MUI
9
com-
ponents in our React application. To ensure that
these elements can be correctly interpreted by assis-
tive technologies such as screen readers, we are work-
ing on a suitable structure and adding more compre-
hensible labels to the individual elements that can be
read aloud by a screen reader.
In addition, colors for texts and backgrounds have
been selected for the main components so that they
have sufficient contrast. Contrasts continue to be
tested for newer components. The color contrasts are
checked using the Color Contrast Analyser
10
. Images
also contain alternative text so that people with a de-
creased ability to see can understand the content of the
image. We are also looking for a suitable solution to
make the charts used for the learning analytics dash-
board and the statistics more accessible for everyone.
We aim to extensively check our tool for accessibility
in the future.
4 USABILITY ANALYSIS
The usage of the tool was tested by 10 students as part
of a practical course at Goethe University Frankfurt.
In an on-site session of the course with the presence
of the course instructor, the students solved tasks on
the NoSQL database Neo4J using our learning tool
over a period of 2 hours. After testing the tool, the
participants completed a questionnaire on the usabil-
ity of the tool. The questionnaire was divided into
eight areas:
• General Questions (GQ)
• First Impression (FI)
• Recognizabilitiy and Uniqueness (RU)
• Intuitiveness and Clarity (IC)
• Learnability (LA)
• Feedback and Reaction (FR)
9
https://mui.com/
10
https://www.tpgi.com/color-contrast-checker/
• Expected Features (EF)
• User Friendliness (UF)
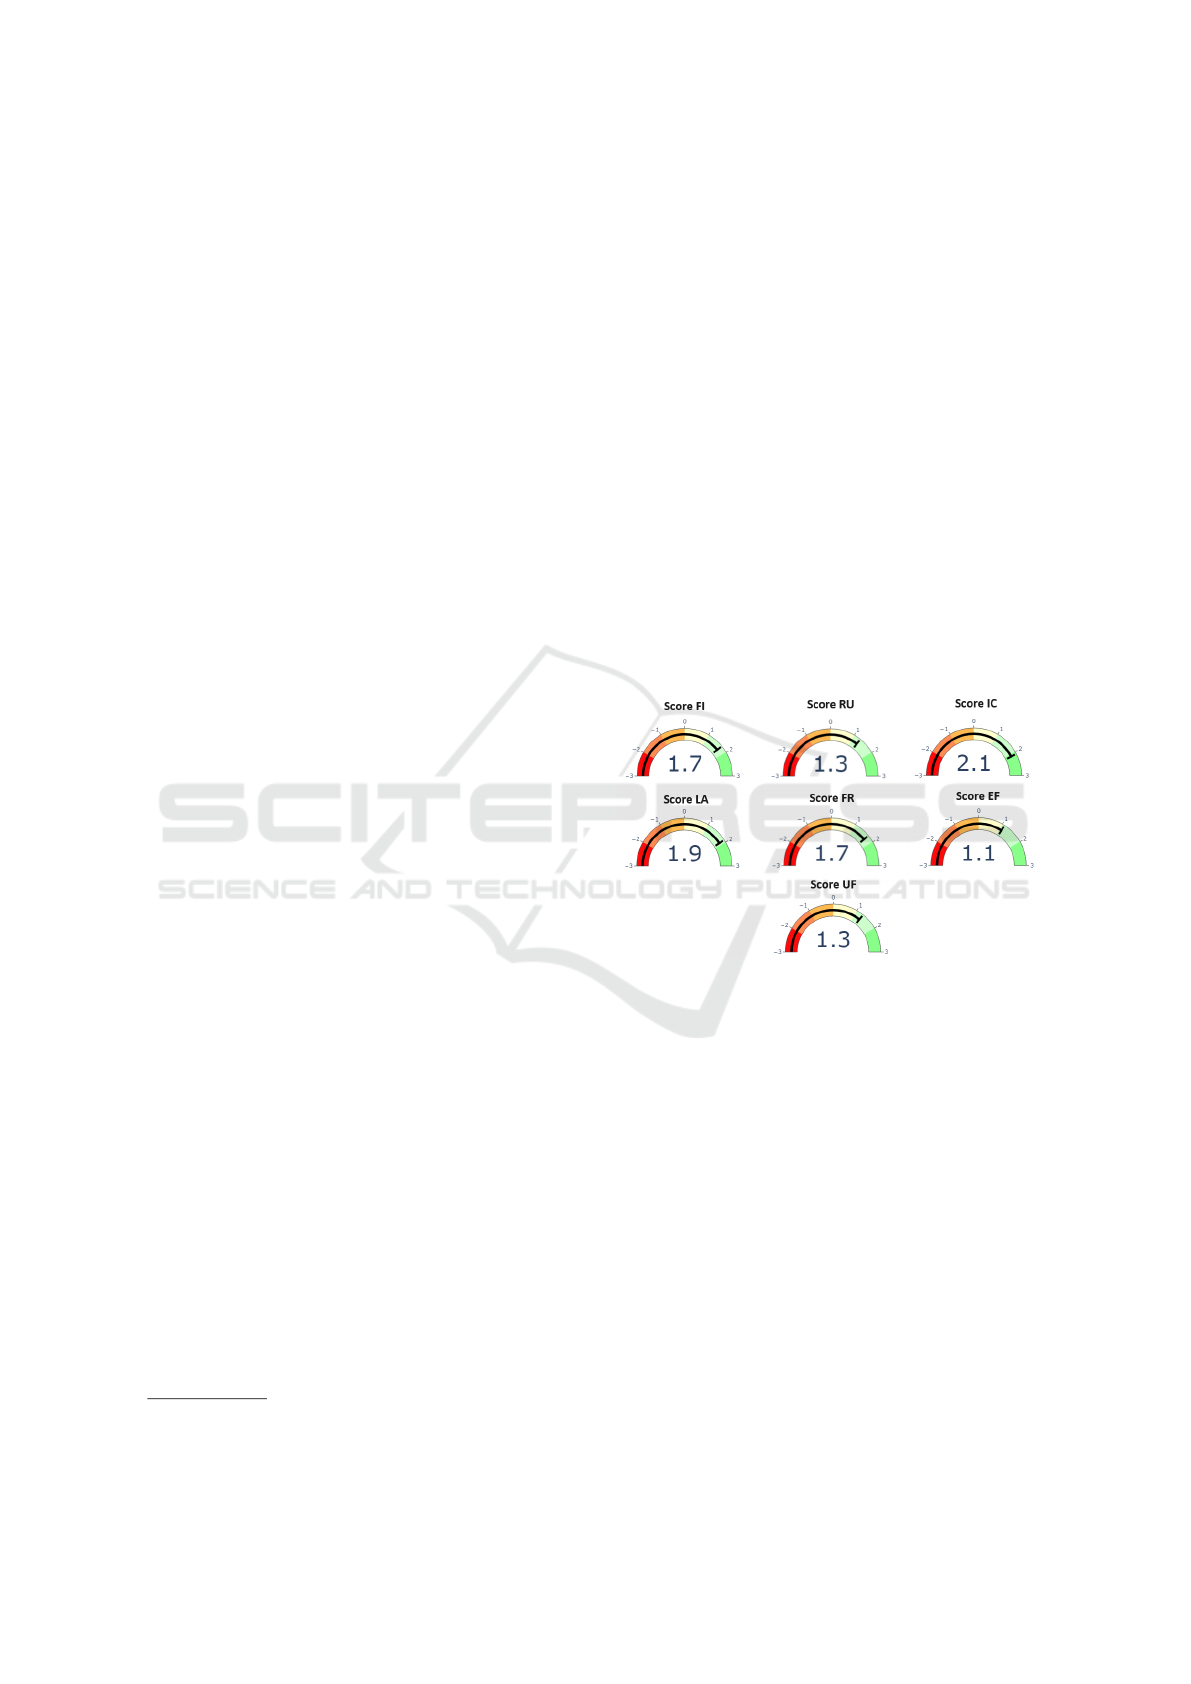
4.1 Questionnaire Results
The scales from -3 to 3 used in Figure 5 were used for
the overall evaluation of each of the above mentioned
areas. Here, -3 is regarded as the worst value, 0 stands
for a neutral attitude and 3 represents the best value.
Each question area consists of several questions.
The following procedure was used to calculate an
overall score for the area. On the questionnaires, stu-
dents selected between strongly disagree, disagree,
somewhat disagree, neutral, somewhat agree, agree
and strongly agree. These were then assigned the val-
ues -3 to 3. For each question, the number of occur-
rences of each value was counted and multiplied by
the respective value. The resulting values for each
question in the range were summed and divided by
the number of questions and the number of partici-
pants. This gives us the scores shown in Figure 5.
Figure 5: Visualization of scores for each area.
Results GQ: The questions from the GQ area con-
cern more general questions about the participants,
such as their field of study, age, gender, as well as
a self-assessment of their database skills and gen-
eral computer skills. Of the participants, 80% stated
that they were master’s students of computer science.
The remaining 20% of the students are master’s stu-
dents of business informatics. The age distribution
shows that 70% of participants are under 25 years old.
30% stated that they were between 25 and 32 years
old. In terms of gender, 80% stated that they were
male, while the remaining 20% stated that they were
female. According to their self-assessment, most
participants had good to excellent computer skills.
All participants were familiar with relational SQL
databases and 90% of them had worked with rela-
tional databases before. All participants had heard of
NoSQL databases, but only 40% of them had worked
with NoSQL databases.
A Unified Teaching Platform for (No)SQL Databases
379

Results FI: The FI area contains questions about
students’ first impressions of our learning tool. More
specifically, students are asked how structured, easy
to use and visually appealing they perceive the tool to
be. Overall, the tool is perceived as clearly structured
and easy to use. The visual design of the tool was
mostly rated as positive, with 60% finding it appeal-
ing. A comment field in the questionnaire was used to
provide suggestions for improvement. Not all the par-
ticipants filled the comment field but in general there
was some feedback regarding the placement of results
tables and results graphs which could be improved.
Results RU: The recognizability and clarity of the
tool’s functionalities are asked here. This includes
questions about the overview of the functionalities
and how clear the individual elements of the tool ap-
pear in terms of their functionality.
The majority, namely 60%, rated the tool as very
recognizable and clear in terms of its functions. There
was specific feedback on individual elements for
which improvements are suggested. These included,
for example, missing or unclear interaction options
for the charts used for statistics.
Results IC: This area is about the intuitiveness of
the elements, labels, texts contained in the tool.
Overall, the tool was perceived by the participants
as intuitively understandable in terms of functional-
ities of elements and workflows. There were a few
suggestions for improving the symbols and labels of
elements to make them even easier to understand.
Results LA: The questions in this area relate to the
learnability of the tool. Among other things, partici-
pants were asked whether little time is needed to learn
the tool. Another question was about to what extent
the tool is designed so that it is easy to remember how
the tool works and to what extent it is possible to learn
how to use the tool without guidance.
At 60%, most participants stated that the tool is
easy to learn. They were also asked whether the tool
encourages them to try out new functions. However,
opinions were divided on this point.
Results FR: This area is primarily concerned with
the tool’s digital exercise sheets, where students can
enter and execute their queries to solve a given task.
The questions relate to the response times, the imme-
diate notification of successful entries or incorrect en-
tries, and the response time regarding the visualiza-
tion of results.
Here, 50% of participants rated the notification of
successful entries as positive. The response time for
the visual display of results was rated positively by
40%. There were also comments on the potential for
improving success notifications and visualizations.
Results EF: This area is about the fulfillment of the
expected functions. Some of the questions in this
section invited students to provide feedback in the
form of free text input. For example, participants
were asked which elements behave unexpectedly and
which elements were particularly helpful or less help-
ful. Most of the participants stated that the tool fulfills
the expected functions well. A minor criticism was
that the setting for the number of rows to be displayed
in the results table was less helpful.
Results UF: One of the questions in this area is
whether the tool makes it easier to work on database
tasks. At 70%, most participants were of the opin-
ion that this is (rather) the case. The first impression
of user-friendliness, which is also discussed in the FI
area, was confirmed according to 60% of participants,
meaning that the tool is seen as user-friendly. Sug-
gestions were also made to add further functions such
as syntax highlighting and autocomplete functions for
text and code entries, which were not yet included in
the tool at the time of the survey.
Looking at the results of the questionnaires, it
can be concluded that the tool has achieved good ac-
ceptance and satisfaction among students. However,
some improvements are still desired, which mainly re-
late to the visualization of the database results within
the digital task sheets.
5 RELATED WORK AND
CONCLUSION
Novel non-relational (NOSQL) database management
systems have come up to counter the weaknesses of
the conventional relational systems in the following
sense: They offer a variety of features to handle large
amounts of unstructured or semi-structured data; that
is, they support flexible data models other than plain
tables (for example graphs or nested data structures).
These arguments justify the study of NoSQL data
stores to achieve flexible data access and efficient big
data management. In addition this shows the need to
develop novel teaching tools to educate future experts
in Computer and Information Sciences in this impor-
tant area. The system presented in this paper extends
previous editions of the practical course (Wiese et al.,
ICEIS 2024 - 26th International Conference on Enterprise Information Systems
380

2021) covering four database systmes and supports
automatic evaluation of student performance. An-
other teaching tool called TriQL (Alawini et al., 2022)
just uses three database systems and focuses on in-
ternal query transformation (based on Datalog) and
automatic query generation; thus the purpose of the
tool is not focused on teaching students the differ-
ent query languages. The tool is not publicly avail-
able and a usability study of the TriQL tool is not
provided. The relational playground (Mior, 2023) fo-
cuses only on SQL. Moreover, some studies in (Chen
et al., 2021; Alkhabaz et al., 2023; Li et al., 2023) fo-
cuses on syntax errors in homework solutions submit-
ted by students, however no tool support is discussed
in the respective studies. In previous editions of the
course (Wiese et al., 2021), students were exposed to
an overwhelming variety of frontends and interaction
methods of the four different database systems. To
be more focused on conceptual differences and query
languages (other than database administration tasks),
with our new learning tool we present students with
a unified platform for database teaching. Moreover
automatic real-time data collection for learning an-
alytics is supported – relieving students from filling
in submission sheets and submitting them to the tu-
tors. Our learning tool is continuously extended and
we plan to add more features (like quick quizzes) and
improved accessibility for disabled persons.
CODE AVAILABILITY
The Github repository of the application is accessible
at https://github.com/VaneMeyer/nosqlconcepts.
ACKNOWLEDGEMENTS
This paper has been supported by Goethe University
Frankfurt’s Digital Teaching and Learning Lab (Dig-
iTeLL) in the project NoSQLConcepts.
REFERENCES
Alawini, A., Rao, P., Zhou, L., Kang, L., and Ho, P.-C.
(2022). Teaching data models with triql. In 1st Inter-
national Workshop on Data Systems Education, pages
16–21.
Alkhabaz, R., Li, Z., Yang, S., and Alawini, A. (2023). Stu-
dent’s learning challenges with relational, document,
and graph query languages. In Proceedings of the 2nd
International Workshop on Data Systems Education:
Bridging education practice with education research,
pages 30–36.
Angles, R., Arenas, M., Barcel
´
o, P., Hogan, A., Reutter, J.,
and Vrgo
ˇ
c, D. (2017). Foundations of modern query
languages for graph databases. ACM Computing Sur-
veys (CSUR), 50(5):1–40.
Chen, M., Poulsen, S., Alkhabaz, R., and Alawini, A.
(2021). A quantitative analysis of student solutions
to graph database problems. In Proceedings of the
26th ACM Conference on Innovation and Technology
in Computer Science Education V. 1, pages 283–289.
Corbellini, A., Mateos, C., Zunino, A., Godoy, D., and
Schiaffino, S. (2017). Persisting big-data: The nosql
landscape. Information Systems, 63:1–23.
Hoque, S. (2020). Full-Stack React Projects: Learn MERN
stack development by building modern web apps us-
ing MongoDB, Express, React, and Node. js. Packt
Publishing Ltd.
Li, Z., Yang, S., Cunningham, K., and Alawini, A. (2023).
Assessing student learning across various database
query languages. In 2023 IEEE Frontiers in Educa-
tion Conference (FIE), pages 1–9. IEEE.
Mior, M. J. (2023). Relational playground: teaching the du-
ality of relational algebra and sql. In Proceedings of
the 2nd International Workshop on Data Systems Ed-
ucation: Bridging education practice with education
research, pages 56–58.
Patel, P. (2016). A guide to material design, a modern soft-
ware design language. Open Source for You, pages
64–66.
Rajesh, C. and Srikanth, K. (2014). Research on html5 in
web development. Int. J. Comput. Sci. Inf. Technol,
5(2):2408–2412.
Rawat, P. and Mahajan, A. N. (2020). Reactjs: A mod-
ern web development framework. International Jour-
nal of Innovative Science and Research Technology,
5(11):698–702.
Sadalage, P. J. and Fowler, M. (2013). NoSQL distilled: a
brief guide to the emerging world of polyglot persis-
tence. Pearson Education.
Wiese, L. (2015). Advanced data management: for SQL,
NoSQL, cloud and distributed databases. Walter de
Gruyter GmbH & Co KG.
Wiese, L., Benabbas, A., Elmamooz, G., and Nicklas, D.
(2021). One db does not fit it all: Teaching the dif-
ferences in advanced database systems. Datenbank-
Spektrum, 21:83–89.
A Unified Teaching Platform for (No)SQL Databases
381
