
Evaluating the Multifactorial Effects on SARS-CoV-2 Spread in
Tokyo Metropolitan Area with an Agent-Based Model
Jianing Chu
a
and Yu Chen
b
SCS Laboratory, The University of Tokyo, Kashiwanoha 5-1-5, Chiba, Japan
Keywords: Agent-Based Modelling, COVID-19, IgG, PCR Testing, Vaccination.
Abstract: The eighth wave of Coronavirus infection in Tokyo hit high records in December 2022. This paper aims to
build a Tokyo-based down-scaled simulation environment to explain the eight epidemic trends using agent-
based modelling and extended SEIR denotation. Four key factors are examined in this research, that are: 1.
Vaccination, 2. Virus mutation, 3. Government policy and 4. PCR test. Our investigation uncovers that the
reported cases during the eight epidemic waves represent merely a fraction of the true extent of infections.
Additionally, our study innovates by simulating the decline of antibodies at the individual level. Our study
also innovates in combining agent-based modelling and extended SEIR modelling to simulate eight
continuous epidemic waves in Tokyo, considering circumstances like Olympics, state of emergency
declaration, traveling policies etc. Upon analyzing the simulated outcomes, we observe a correlation between
the onset of new epidemic waves and the decrease in the population possessing antibodies. Our simulation
further indicates the necessity for aligning the level of PCR testing with the available medical resources.
Finally, by comparing the simulation results with actual data for the eighth wave, we forewarned of a potential
resurgence in the epidemic during May and June 2023.
1 INTRODUCTION
On May 8, 2023, a significant measure was taken in
Japan as the government downgraded COVID-19
from a class 2 infectious disease to a class 5 disease,
marking a pivotal moment in the country's fight
against the virus. This reclassification signifies a shift
in the severity and risk assessment of COVID-19 in
Japan, prompting a re-evaluation of public health
policies and strategies. This paper specifically
focuses on the critical contribution of epidemiology
in the context of SARS-CoV-2 in Japan, aiming to
shed light on its vital role in advancing global health
objectives during the ongoing COVID-19 pandemic.
At the initiation of our study, we posit that the
epidemic trend is chiefly shaped by four aspects:
vaccination; virus mutation; government policy, and
PCR testing. This assumption is grounded in the
following considerations: 1) vaccination plays a
crucial role in generating antibodies, thereby curbing
the spread of the Coronavirus; 2) mutations in the
a
https://orcid.org/0009-0009-0495-1376
b
https://orcid.org/0000-0002-7075-2457
Table 1: Summary of agents’ health status.
virus can potentially enhance its transmissibility by
evading immunity; 3) government policies, such as
travel restrictions, aim to mitigate the spread of the
virus; and 4) the adequacy of PCR testing capacity
significantly influences the tally of confirmed cases.
This study utilizes an extended SEIR framework
(refer to Table 1) along with the construction of an
States Meanings
S1 Susceptible, healthy, no antibody or vaccination
E Exposed, within the infection range to I1
I1 Infected, unconfirmed and not tested
I2 Infected, confirmed via PCR test
V Healthy, vaccinated, possess antibody
R Healthy, cured, possess antibody
S2 Healthy, susceptible, vaccinated, lose antibody
D Dead
30
Chu, J. and Chen, Y.
Evaluating the Multifactorial Effects on SARS-CoV-2 Spread in Tokyo Metropolitan Area with an Agent-Based Model.
DOI: 10.5220/0012726400003708
Paper published under CC license (CC BY-NC-ND 4.0)
In Proceedings of the 9th International Conference on Complexity, Future Information Systems and Risk (COMPLEXIS 2024), pages 30-42
ISBN: 978-989-758-698-9; ISSN: 2184-5034
Proceedings Copyright © 2024 by SCITEPRESS – Science and Technology Publications, Lda.

agent-based model. Further elaboration on these
methods will be presented in Sec. 3. The actual data
pertaining to the four factors mentioned are sourced
from the Tokyo Metropolitan Government and will be
utilized for model validation. Our primary objective
is to replicate the onset, peak, decline, and maximum
daily infection rates of each wave. In continuation of
our previous study (Chu et al., 2023), our goal is to
not only explain the occurrence of the eight waves but
to simulate possible infectious diseases in the future.
The paper is structured as follows: Firstly, we
review existing literature on Coronavirus modelling
research, covering both international and Japanese
studies (Sec. 2). Next, in the data and methodology
section (Sec. 3), we explore the four key
considerations and elaborate on our research
methodology. Following that, in the model
construction section (Sec. 4), we explain how the
model was developed. Then, in the verification and
calibration phase (Sec. 5), we offer substantial
evidence of the model's effectiveness, a long with
a cautious calibration process. Subsequently, we
conduct analysis and depict findings from simulations
(Sec. 6). Finally, we summarize recommendations
and draw conclusions (Sec. 7).
2 LITERATURE REVIEW
2.1 A Review of International Research
To provide a comprehensive overview, this literature
review begins by examining the current state of
international research in the field.
Purkayastha and colleagues compare the
simulation results among five epidemiological
models for transmission of SARS-CoV-2 in India
(Purkayastha et al., 2021). According to their
research, SEIR-FANSY model outperforms others by
having the highest certainty in terms of width of 95%
credible interval. Still their research fails to capture
the government interventions or citizen’s behavioural
changes. While policies like lockdown across India
did play an unignorable role in epidemic spreads.
Chadi and others pointed out the problems of
vaccine distribution, whether to prioritize vaccinating
those who had received the first dose or those who
had never vaccinated (Saad-Roy et al., 2021). Despite
the controversy surrounding this approach, many
jurisdictions have decided to proceed with the
delayed second dose strategy. This has resulted in a
significant increase in the number of people who have
been vaccinated. Researchers, however, argue that
one-dose strategies may be effective in the short term,
but may not be the best approach in the long term if
they do not account for immune robustness. Their
study serves as inspiration to properly ensure the
vaccination rate of the second dose when conducting
vaccination simulations.
Hoertel and others build a stochastic ABM model
based on real-world data, including information on
the demographics of the French population, the
transmission dynamics of the virus, and the
effectiveness of various NPIs (Hoertel et al., 2020).
The model was applied to simulate the spread of the
disease under different scenarios, including the
implementation of different NPIs such as social
distancing, mask wearing, and contact tracing. Their
model is well calibrated and validated with a
Pearson’s R value of 0.99 for ICU-bed occupancy as
well as cumulative mortality. One of the limitations
of their research is not considering the decline of
antibodies which an individual acquires through
either recovery or vaccination.
Cai and his team developed an age-structured
stochastic compartmental susceptible-latent-
infectious-removed-susceptible model to simulate
transmission of SARS-CoV-2 Omicron in China (Cai
et al., 2022). Furthermore, their model takes into
account specific data on vaccine coverage among
different age groups, the effectiveness of vaccines
against various clinical outcomes, the gradual decline
of immune protection over time, the utilization of
diverse antiviral therapies, and the implementation of
nonpharmaceutical interventions. Nonetheless, the
mortality rate was assumed to remain constant over
the projection period, while it actually depends on
multiple factors such as virulence and medical
resources.
2.2 A Review of Japanese Research
To delve deeper into the subject matter, the literature
review then shifts focus to research conducted by
Japanese scholars.
Chiba outlines strategies for controlling the
spread of epidemics in Japan, focusing on mobility
restrictions, reduced restaurant operating hours, and
remote work (Chiba, 2021).
Yamauchi et al. investigate the relationship
between epidemic trends, governmental
interventions, and daytime population density in
Tokyo. Their findings indicate a positive correlation
between increased contact opportunities and higher
infection rates (Yamauchi et al., 2022).
Murakami et al. employ agent-based modelling
and GPS analysis to simulate the spread and
containment of infections in Tokyo. Their research
Evaluating the Multifactorial Effects on SARS-CoV-2 Spread in Tokyo Metropolitan Area with an Agent-Based Model
31

underscores the significance of city-wide lockdowns
and preventive measures in service establishments
(Murakami et al., 2022).
While several studies have contributed valuable
insights into the transmission dynamics and control
strategies of COVID-19, there are still important
research gaps that need to be addressed, such as the
absence of simulation models that incorporate
antibody decline on an individual level, the lack of
consideration for the impact of declining immunity
due to recovery or vaccination, and the need to
explore optimal vaccination strategies. Furthermore,
existing research often fails to capture the oscillatory
growth and decay behavior of the virus incidence
curve, particularly in terms of the subsequent waves
after the initial outbreak. This limitation in
predictability is particularly relevant given the
observation that the number of confirmed patients in
the eight epidemic waves in the Tokyo were only the
tip of the iceberg. Difference in prediction and
observation suggests a need for more comprehensive
modelling approaches. Moreover, the literature
review reveals that previous studies have not fully
accounted for the interplay between government
interventions, citizen behavioral changes, and the
dynamics of virus transmission. Understanding the
role of government policies and individual behaviors
in the spread of the virus is crucial for designing
effective control measures.
To address all these research gaps, this study aims
to explain the eight epidemic waves in the Tokyo
using agent-based modelling and an extended SEIR
denotation. By incorporating the dynamics of
antibody decline on an individual level and
considering factors such as vaccination, virus
mutation, government policy, and PCR test, this
research seeks to provide a more comprehensive
understanding of the transmission dynamics and
control strategies for COVID-19 in the Tokyo area.
3 DATA AND METHODOLOGY
3.1 Data Collection
We conducted a preliminary examination of the four
proposed factors using publicly available data and
information from the Tokyo Metropolitan website.
All the gathered data and information are utilized in
the model development outlined in Sec. 4.
1
Severe rate = The number of severe patients receiving
medical treatment/ The number of confirmed patients.
3.1.1 Vaccination
It is clear that mass vaccination plays a crucial role in
decreasing the severity and mortality rates (Larrauri
et al., 2022). Table 2 provides an overview of the five
vaccination rounds
conducted in Tokyo.
Table 2: Timeline of vaccination rounds in Tokyo and
vaccination rates as of Nov. 30, 2022.
Table 3: Timeline of mutated variants first detected in
Tokyo and the relative severe rates.
Date Events Severe
rate
1
2020.01.24 1
st
COVID-19 case detected 23.81%
2021.01.12 1
st
Gamma case detected 0.76%
2021.04.20 1
st
Delta case detected 1.00%
2021.08.31 1
st
Delta N501S case detected 0.84%
2021.11.30 1
st
Omicron case detected 3.57%
2021.12.25
(Approx.)
1
st
Omicron BA.2 case detected 0.56%
2022.04.12 1
st
Omicron XE case detected 0.02%
2022.04.22 1
st
Omicron BA.4 case detected 0.02%
2022.04.29 1
st
Omicron BA.5 case detected 0.02%
2022.07.13 1
st
Omicron BA.2.75 case detected 0.05%
2022.07-
2022.10
(Approx.)
1
st
Omicron BA.4.6 case detected
1
st
Omicron BF.7 case detected
1
st
Omicron BN.1 case detected
1
st
Omicron BQ.1 case detected
1
st
Omicron BQ1.1 case detecte
d
0.02%
~0.06%
2022.10.28 1
st
Omicron XBB case detected 0.01%
Vaccination
round
Starting
Date
Interval
between doses
Vaccination
rate
1
st
2021.04.12 Not applicable 78.1%
2
nd
2021.05.03 3~8 weeks 77.5%
3
rd
2021.12.01 6~7 months 65.7%
4
th
2022.05.25 5~6 months 80.4% for
the elderly
Bivalent 2022.09.20 3 months -
COMPLEXIS 2024 - 9th International Conference on Complexity, Future Information Systems and Risk
32

3.1.2 Virus Mutation
Table 3 provides an overview of the initial detection
dates of notable mutated viruses in Japan, alongside
their corresponding severity rates. As depicted in
Table 3, there is an observable trend indicating a
decrease in virus lethality.
3.1.3 Government Policy
When examining governmental measures, this paper
highlights municipal governance, healthcare
interventions, border controls, and preventative
measures related to the Olympics. The Tokyo
Metropolitan Government implemented seven states
of emergency, as detailed in Table 4. While standard
regulations were enforced during four of these
emergencies, the remaining three saw relaxed
regulations. Additionally, Tokyo adopted Highly
Active Antiretroviral Therapy (HAART Therapy) for
COVID-19 treatment starting July 19, 2021 (Table 5).
Table 4: Timeline of state of emergency/ quasi-state of
emergency in Tokyo.
Events Duration
1
st
wave state of emergency 2020.04.07~2020.05.25
2
nd
wave state of emergency 2021.01.08~2021.03.21
1
st
wave quasi-state of emergency 2021.04.12~2021.04.24
3
rd
wave state of emergency 2021.04.25~2021.06.20
2
nd
wave quasi-state of emergency 2021.06.21~2021.07.11
4
th
wave state of emergency 2021.07.12~2021.09.30
3
rd
wave quasi-state of emergency 2022.01.21~2022.03.21
Table 5: Government approved COVID-19 therapies and
relevant death rates of the confirmed cases.
Therapies Duration Death%
Before HAART Therapy 2020.01.26 ~ 2021.07.18 1.2%
HAART Therapy applied 2021.07.19 ~ 2021.12.23 0.45%
Lagevrio and Paxlovid 2021.12.24 ~ 2022.11.27 0.10%
Distribution of ‘Xocova’ 2022.11.28 ~ 2023.01.02 0.001%
The Ministry of Health, Labour and Welfare of
Japan authorized the emergency use of Shionogi's
oral medication, 'Xocova,' for COVID-19 treatment
on November 22, 2022 (Matsuyama, 2022).
Distribution of 'Xocova' commenced on November
28, 2022, benefiting approximately 1 million citizens.
This development contributed to a further decrease in
the severity and mortality rates (refer to Table. 5).
Regarding border measures, Japan briefly opened
its borders to foreign residents twice in 2020. Since
Oct 11, 2022, Japan has ceased border operations,
fully reopening its border to independent travellers
with no daily cap.
Japan held the Tokyo Olympics from July 23 to
August 8, 2021. The first Olympic team arrived in
Japan on June 1, 2021 (Zhang, 2021). Athletes were
required to depart within 48 hours of completing their
events (International_Olympic_Committee, 2021),
implying a departure period from July 25 to August
10, 2021. Approximately 79,000 individuals travelled
to Japan for the Tokyo Olympics (McCurry, 2021).
3.1.4 PCR Test
The PCR (Polymerase Chain Reaction) test detects
genetic material from specific pathogens and is
widely used for diagnosing COVID-19. In Tokyo,
PCR testing is conducted either by medical
institutions or health centers, with the latter primarily
responsible for conducting major inspections.
Typically, Tokyo residents undergo PCR testing on a
voluntary basis, following the advice of their
physicians and assessing their own health conditions.
Criticism regarding the shortage of PCR testing
capacity has been persistent.
As of March 6, 2022, PCR testing has been
covered by medical insurance. This allows medical
facilities to directly solicit tests from private testing
institutes and other entities. Additionally, with
insurance coverage approval for the antigen detection
kit "Lumipulse SARS-CoV-2 Ag", saliva-based tests
were accessible to asymptomatic patients from July
17, 2022 (MHLW, 2023b). Moreover, residents can
opt to register on the Tokyo Metropolitan
Government website to receive a complimentary
antigen test kit delivered to their home if they believe
they have symptoms or have been in close contact
with an infected individual. This measure helps
alleviate the burden on medical facilities for testing
and consultations. In the event of a positive antigen
test result, the individual can promptly begin a 14-day
self-quarantine to mitigate further transmission of the
infection.
3.1.5 Other Considerations
Another aspect taken into account in this study is
school breaks. During winter, spring, and summer
vacations, students tend to travel longer distances
compared to regular term periods.
Evaluating the Multifactorial Effects on SARS-CoV-2 Spread in Tokyo Metropolitan Area with an Agent-Based Model
33
3.2 Methodology Discussion
3.2.1 Agent-Based Modelling
In this research, we utilize NetLogo (Wilensky,
1999), a beautiful agent-based modelling (ABM)
software, to simulate the dynamics of the epidemic.
The rationale behind this choice is rooted in ABM's
ability to capture the nuanced individual
heterogeneity within complex environments. When
studying large-scale epidemic phenomena, it's crucial
to account for variations in individual attributes due
to the significant social and physical interactions
among them. ABM can be fine-tuned by adjusting
model parameters to ensure that the calculated R0
aligns with real-world measurements.
3.2.2 Extended SEIR Denotation
Our model incorporates individual health statuses,
drawing inspiration from the SEIR model (Hethcote,
2000), while also introducing additional statuses such
as 'Vaccinated' and 'Dead', enhancing the precision of
health status description (Refer to Table 1).
4 MODEL CONSTRUCTION
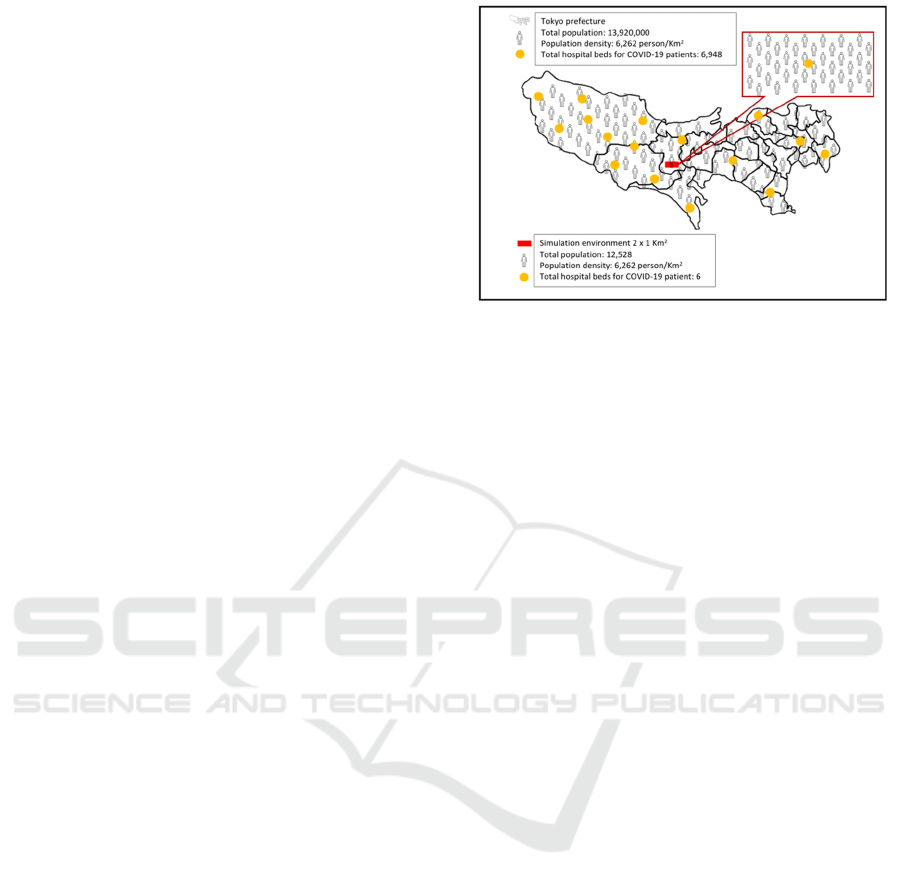
4.1 Space and Population
A total of 13,920,000 individuals reside in Tokyo,
resulting in a population density of 6,264 individuals
per square kilometre (Statistics Bureau of Japan,
2021). The city has approximately 7,291 hospital
beds in total. Assuming uniform distribution of static
properties (such as infrastructure) and identical
distribution of dynamic properties (such as
population movement) throughout Tokyo city, our
approach involves constructing a rectangular block
measuring 2 kilometres in length, designed to mimic
the geometry of the Tokyo area. Epidemic dynamics
are simulated within this block using downscaled
population and infrastructure figures. Refer to Fig 1
for further details.
By applying the aforementioned uniformity
assumptions, the entire Tokyo region, comprising 23
municipalities, is linearly downscaled into a
rectangular block measuring 2 kilometres in length and
1 kilometre in width. It should be emphasized that the
population density and hospital’s capacity depicted in
Fig. 1 correspond to actual data. The adjusted count of
entries and exits to and from a block fluctuates with
each time interval in response to governmental
directives and incoming and outgoing data.
Figure 1: Illustration of post-scaled simulation
environment.
4.2 Social Contact
In the model, agents are initially distributed
randomly, with their location recorded as their place
of residence. We presume that at the start of each day,
all agents, excluding the quarantined ones, have the
freedom to roam outdoors randomly for up to 8 hours
in any direction within a radius denoted as 𝑟
. This
range matches their typical daily activities and varies
based on their identity (whether they are employed,
students, or unemployed). During these random
walks, agents have opportunities to encounter other
pedestrians, potentially leading to infection
transmission. At the end of the day, agents return to
their designated residences.
Although the social contact model described in
this paper may not fully account for individual
interactions at a precise level, we expect that its
collective results will closely mirror those observed
in broader epidemic contexts. A similar principle is
evident in the microscopic modelling of fluid
dynamics: despite variations in the molecules and
interaction potentials of distinctive fluids, large-scale
flow dynamics adhere to the same governing
equation. This concept is echoed by Wolfram in his
book on complex systems (Wolfram & Gad-el-Hak,
2003), where he highlights that although the
underlying rules may differ across systems, the
overall outcomes remain consistent.
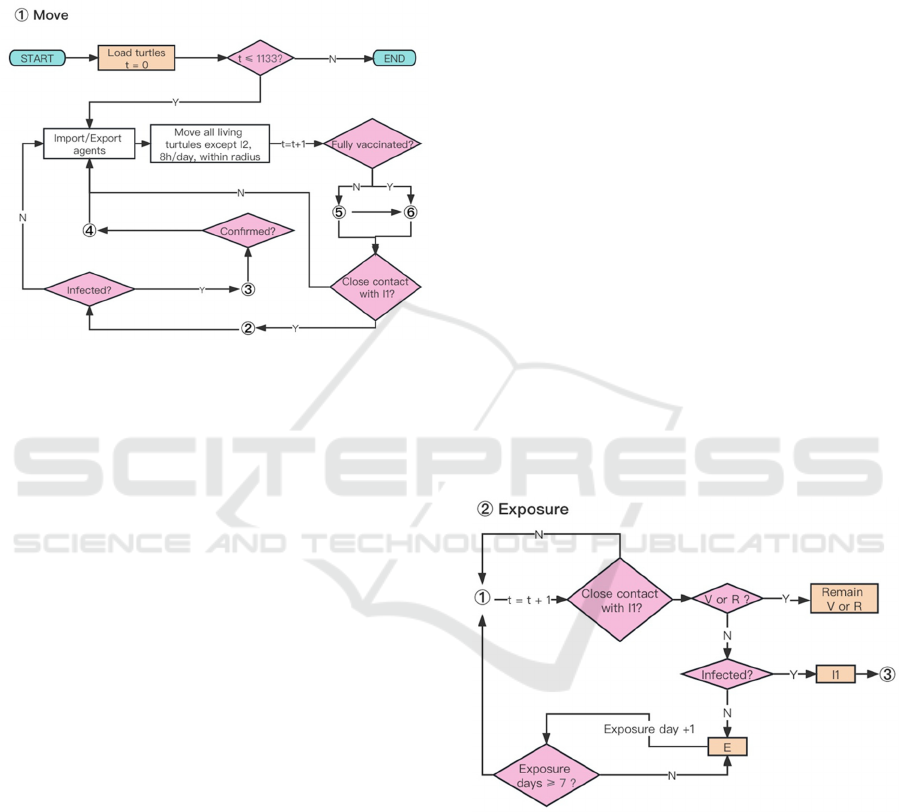
4.3 Detailed Model Construction
The comprehensive system flowchart is depicted in
Fig 2. Initially, we establish the patches area,
synthetic population, and central hospital.
Subsequently, the model processes input data from a
file, which includes various parameters such as the
COMPLEXIS 2024 - 9th International Conference on Complexity, Future Information Systems and Risk
34
daily vaccine capacity, number of daily entries and
exits, daily quota for PCR tests, infection probability
for three levels of social distancing, maximum daily
travel distance for three occupational categories, and
mortality rates associated with different virus
variants.
Figure 2: System flow chart of the simulation process.
Using published inbound and outbound traveler
statistics, we introduce unconfirmed patients
(represented as agents in category I1) and randomly
export agents on a daily basis. Imported agents are
also categorized based on their occupation. All
surviving agents, with the exception of those in
category I2, are permitted to move within specified
distance boundaries corresponding to their respective
occupations.
4.3.1 Health States and Population
We extend the SEIR categorization to encompass a
total of eight health statuses for agents. (refer to Table
1). Furthermore, we segment the infected state into
two subcategories, namely I1 and I2. Upon
identification, confirmed cases (I2) are required to
self-quarantine at home, thereby reducing their
potential for public transmission compared to
unconfirmed infected agents (I1). There are 𝑁
agents in this synthetic population. Among these
agents, populations in different states are represented
as 𝑁
, 𝑁
, 𝑁
, 𝑁
, 𝑁
, 𝑁
, 𝑁
, 𝑁
,
respectively.
4.3.2 Susceptible
At the onset of the simulation (t=0), all agents are
initially set to be susceptible (S1), with no individuals
infected with the Coronavirus. Agents' home
positions are noted, and they are permitted to travel
from their homes to locations within a designated
radius denoted as 𝑟
. Agents are allowed to venture
out for a duration of eight hours daily, with movement
unrestricted in direction. Upon reaching the boundary
of the designated space, agents will rebound.
4.3.3 Exposure
Since the onset of imported cases spreading across the
Tokyo on January 24, 2020, we designate this date as
t=1. Over time, individuals who come into contact
with asymptomatic cases (agents in state I1) have a
chance of infection if they lack antibodies (see Fig.
3). The probability of transitioning from the
Susceptible state to the Exposed state (S1→E) is
calculated as follows:
𝑃
→
𝐻𝑑
,
𝑑
(1)
Here, 𝐻𝑥represents the Heaviside step function,
and 𝑑
,
denotes the shortest distance between agents
in state X and agents in state Y. The threshold
distance, denoted as 𝑑
, is set to 2 units of patch size,
based on facts provided by the Ministry of Health,
Labour, and Welfare, which states that physical
proximity within 2 meters is considered close contact
with a possibility of Coronavirus transmission
(MHLW, 2023a).
Figure 3: ‘Exposure’ in ABM.
4.3.4 Infection
Agents in state I1 have the potential to transmit
Coronavirus to nearby agents (all surviving agents
except for I1 and I2), exposing them to the virus
within a specified distance. However, agents with
antibodies above a certain threshold (in states V or R)
cannot transition to the Exposed state (E). Exposed
agents have a probability of developing symptoms
and becoming infected within the subsequent 14 days.
Evaluating the Multifactorial Effects on SARS-CoV-2 Spread in Tokyo Metropolitan Area with an Agent-Based Model
35
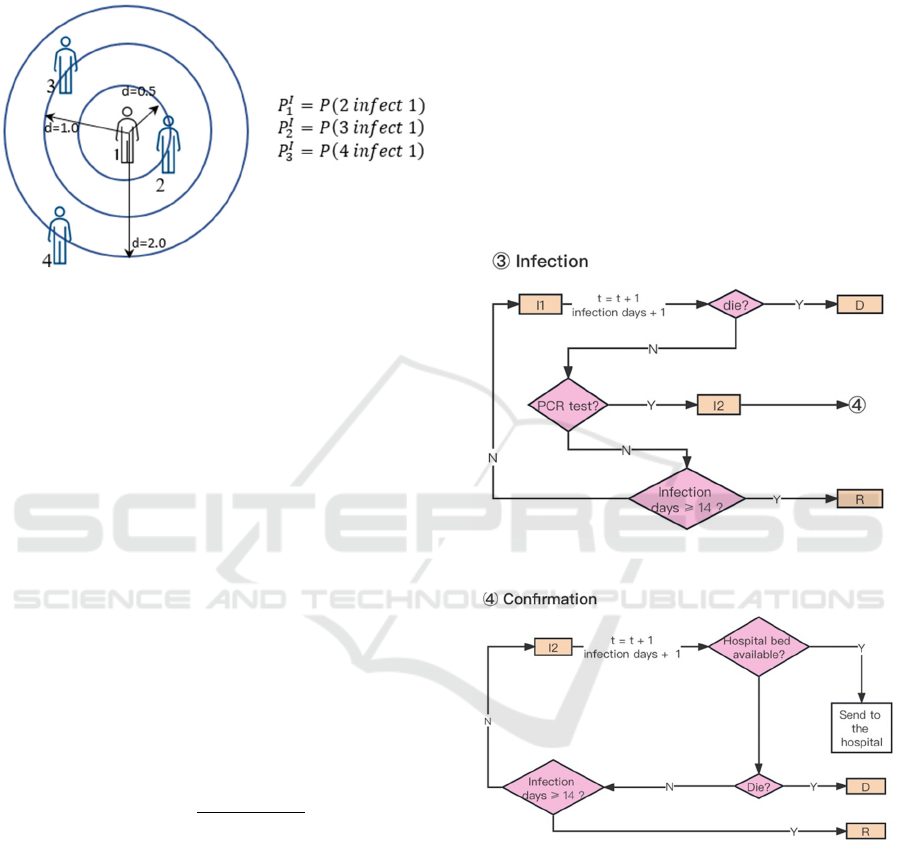
The likelihood of an exposed agent (in state E)
contracting Coronavirus relys on the distance at
which the agent encountered another agent in state I1,
as illustrated in Fig. 4.
Figure 4: Illustration of agents’ infection pattern.
The probability of infection (𝑃
→
) is defined as,
𝑃
→
𝑃
0𝑑
,
0.5
𝑃
0.5𝑑
,
1.0
𝑃
1.0𝑑
,
2.0
(2)
Whenever the virus undergoes mutation, the
probabilities of infection are adjusted based on the
characteristics of the viruses. If exposed agents are
fortunate enough to avoid infection, their states will
revert back to S1 (E→S1). All agents, except the ones
confirmed with infection (in state I2), will undergo
PCR tests with a probability denoted as 𝑃
𝑛
/𝑁
𝑁
𝑁
per day, where 𝑛
represents the data of downscaled PCR tests released
by the Tokyo Metropolitan Government. Upon
confirmation of infectivity through PCR tests, the I1
state agents will be reclassified as I2 state (see Fig. 5).
This implies that the transition probability for an
individual can be computed as follows:
𝑃
→
. (3)
If an agent is currently in I2 state, movement shall
be restricted until the subsequent state transition
occurs, either to R (recovery) or D (death).
4.3.5 Recovery or Death
Agents testing positive for Coronavirus (in state I2)
immediately begin a 14-day self-quarantine. Some
may be hospitalized if beds are available, reducing
mortality rates compared to home isolation. If not
confirmed within 14 days, infected agents (in state I1)
may move freely until recovery (I1→R) or death (I1
→ D). Deceased agents are removed from the
simulation, while recovered agents gain antibodies
and resume movement (see Fig. 6).
4.3.6 Vaccination
The daily vaccine supply quota prioritizes individuals
for their second dose within three to seven weeks,
with subsequent doses spaced accordingly (Fig. 7).
All surviving individuals except confirmed, are
eligible for vaccination while quotas last. Pfizer
vaccine efficacy, estimated at 52% for the first dose
and 91% for the second (Polack et al., 2020), is
modelled despite vaccine brand options. Our model
accounts for antibody titer decay, a factor often
overlooked in existing literature.
Figure 5: ‘Infection’ in ABM.
Figure 6: ‘Confirmation’ in ABM.
4.3.7 Antibody Decline
Antibodies are gained via vaccination or recovery,
with natural recovery showing slower decline rates
(Israel et al., 2022). The IgG test measures COVID-
19 antibodies, with Narasimhan et al. setting a
positive threshold at 50 AU/mL (Narasimhan et al.,
2021), while Ebinger et al. suggest 4160 AU/mL for
serum neutralizing activity (Ebinger et al., 2021).
COMPLEXIS 2024 - 9th International Conference on Complexity, Future Information Systems and Risk
36
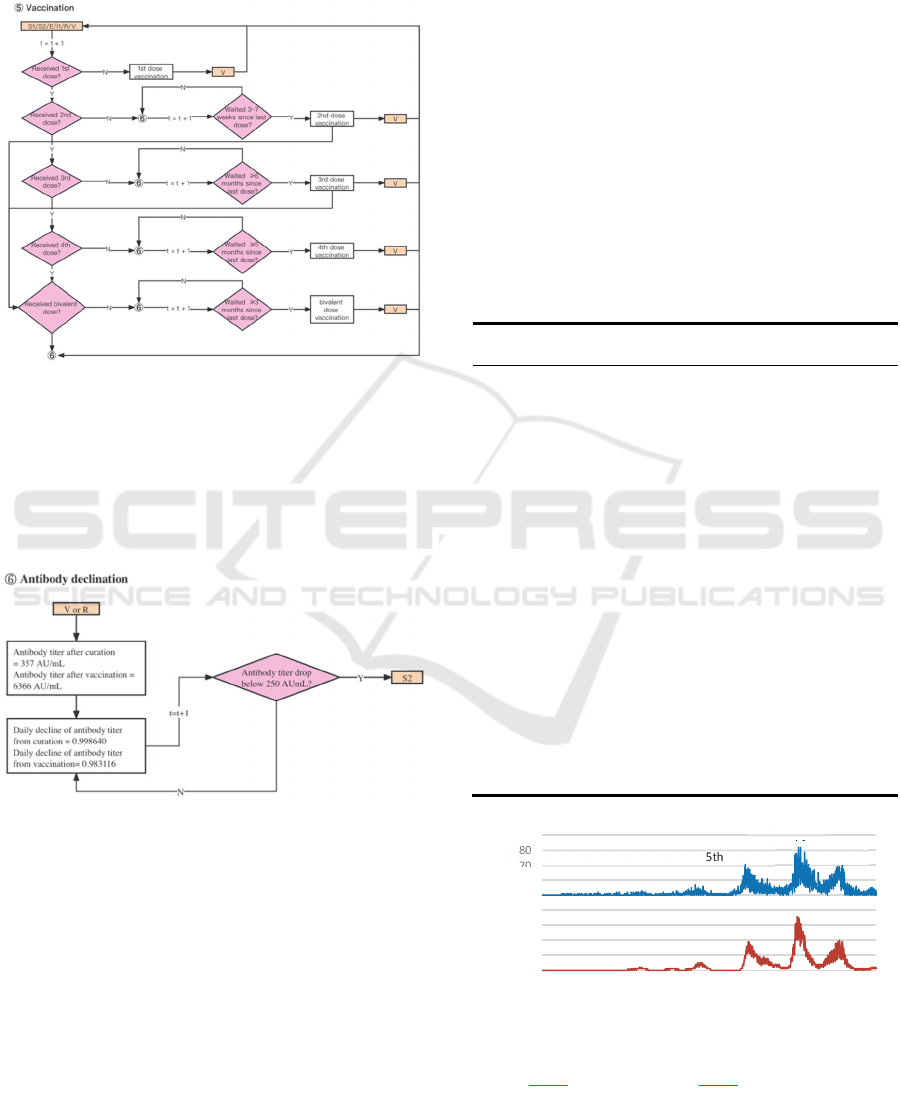
In our model, individual antibody levels decrease
over time based on previous studies. Once levels drop
below a calibrated threshold, individuals transition to
S2 status (V/R→S2).
Figure 7: ‘Vaccination’ in ABM.
As per Ariel Israel et al., recipients of the Pfizer-
BioNTech mRNA vaccine exhibit varying antibody
levels compared to those who contracted the SARS-
CoV-2 virus (see Fig. 8). Antibody concentrations
gained via vaccination are initially higher but decline
at a quicker pace (Israel et al., 2022).
Figure 8: ‘Antibody decline’ in ABM.
5 VERIFICATION AND
CALIBRATION
5.1 Verification of Linear Scaling
In Sec 4.1, Tokyo is downscaled into a 2km by 1km
block, accommodating 12,528 susceptible agents and
a hospital for 6 infected agents. We use a factor 𝜆
1 to demonstrated that simulation results can be
scaled back to the real Tokyo scale post-simulation.
Specifically, we designed four sizes of simulation
environments along with adjusted parameters
𝑆
:𝑆
:𝑆
:𝑆
4:1:1/4:1/16. Test results
from simulation show that the following relation
holds true 𝑁
/4𝑁
4𝑁
16𝑁
, therefore
𝑁
𝜆𝑆,𝜆𝑁
; 𝑡 𝜆𝑁
𝑆,𝑁
; 𝑡.
Moreover, the shape of the simulation area has
trivial impact to results. Hence, we are confident to
proceed the current model to perform simulations.
5.2 Calibration of the Model
To fine-tune this model, we utilize data on confirmed
infection cases spanning from January 24, 2020, to
May 8, 2023. Initial parameters like hospital capacity
and population size are established within the code’s
initialization module (See Table 6).
Table 6: Parameters and parameter values.
Parameters Value Parameters Value
Initial population 12,528 Antibody titer after
cured
357 AU/mL
Hospital capacity 6 Decline rate for
vaccinated
0.980916
Labor force
participation rate
62% Decline rate for
cured
0.998640
Student rate 17% Vaccine efficacy
threshold
250 AU/mL
1
st
dose efficacy 52% Vaccination
fatality rate
8.1 10
2
nd
dose efficacy 91% Self-isolation days 14 days
Antibody titer 2
nd
dose 1,629 1
st
/ 2
nd
dose
Interval
21~49 days
Antibody titer 3
rd
dose 3,419 2
nd
/ 3
rd
dose
Interval
≧180 days
Antibody titer 4
th
dose 3,655 3
rd
/4
th
dose
Interval
≧150 days
Figure 9: Actual results (scaled) vs. Simulation results.
0
10
20
30
40
50
60
70
80
90
01/jan/00
25/fev/00
20/abr/00
14/jun/00
08/ago/00
02/out/00
26/nov/00
20/jan/01
16/mar/01
10/mai/01
04/jul/01
28/ago/01
22/out/01
16/dez/01
09/fev/02
05/abr/02
30/mai/02
24/jul/02
17/set/02
11/nov/02
05/jan/03
01/mar/03
Number of Agents
Date
Actual results (scaled) Simulation results + 50
1st 2nd 3rd 4th 5th 6t
7t
8t
Evaluating the Multifactorial Effects on SARS-CoV-2 Spread in Tokyo Metropolitan Area with an Agent-Based Model
37
6 ANALYSIS AND FINDINGS
6.1 Reproducing the Eight Waves
Fig. 9 compares scaled actual data with simulated daily
COVID-19 infections in Tokyo from January 24, 2020,
to May 8, 2023. The simulation, averaged over 60
iterations, successfully replicates the seven infection
waves in Tokyo and predicts the highest daily
confirmed cases in each wave, detailed in Table 7.
Table 7: Comparison of the maximum value between post-
scaled actual results and simulation results.
Epidemic
waves
in Tokyo
Maximum daily
confirmed cases
(post-scaling)
Maximum daily
confirmed cases
(simulation results)
1
st
wave 0 (April 27, 2020) 0 (April 14, 2020)
2
nd
wave 0 (August 1, 2020) 1 (August 1, 2020)
3
rd
wave 2 (January 7, 2021) 1 (January 7, 2021)
4
th
wave 1 (May 8, 2021) 2 (May 17, 2021)
5
th
wave 5 (August 13, 2021) 4 (August 11, 2021)
6
th
wave 19 (February 2, 2022) 19 (January 24, 2022)
7
th
wave 36 (July 28, 2022) 33 (August 1, 2022)
8
th
wave 20 (December 27, 2022) 19 (December 27, 2022)
6.2 Analysis of Metrics
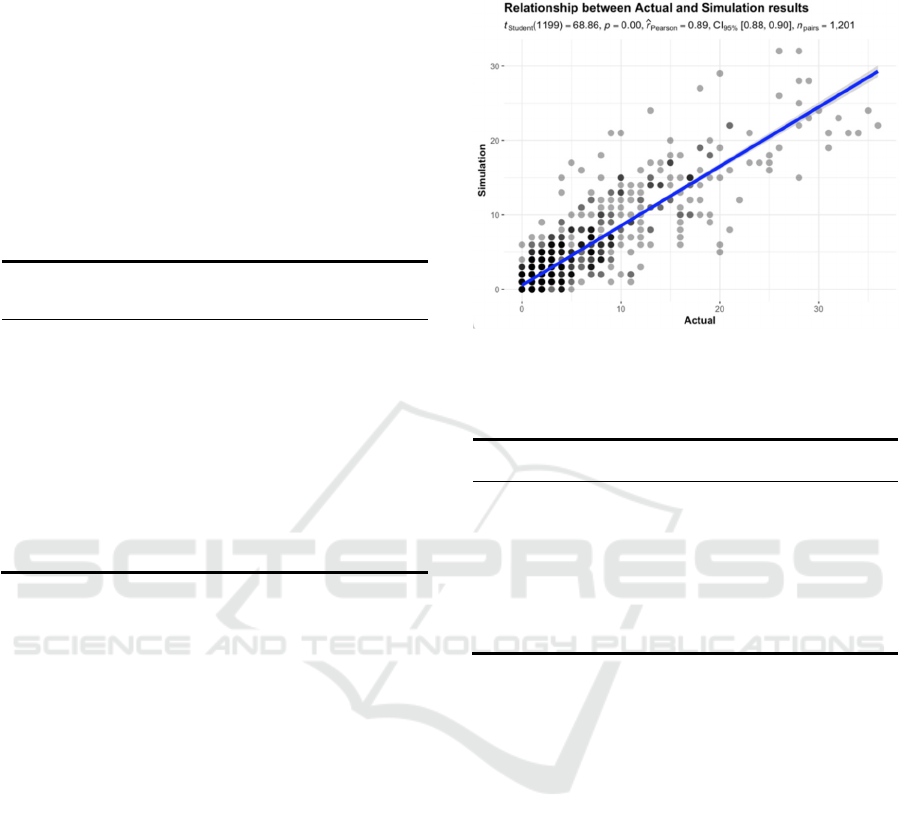
Fig. 10 depicts the scatter plot alongside marginal
density and histogram, generated using
‘ggscatterstats’ function in the package ‘ggstatsplot’
(Patil, 2021). The number of observations 𝑛
1201 corresponds to 2020.01.24 ~ 2023.05.08.
The graph demonstrates a significant rejection of
the null hypothesis with 𝑝0.000.05. The
rejection is support by 𝑟̂
0.89, which lies in
𝐶𝐼
%
0.88,0.90. Overall, the statistical analysis
indicates a strong agreement between the simulation
results and actual data.
Furthermore, Granger causality tests were
conducted on the two datasets. The F test statistic
yielded a value of 64.008, with a corresponding
p-value of 𝑃𝑟
2.210
0.05.
Consequently, we reject the null hypothesis,
suggesting that the simulation results effectively
predict the actual outcomes.
Examining the accuracy of the forecasts, the
RMSE of 2.57 signifies the average absolute
magnitude of forecast errors. Additionally, the DA of
0.76 indicates that the forecasts correctly predicted
the direction of the actual values approximately 76%
of the time.
Figure 10: ‘ggstatsplot’ of results comparison.
Table 8: Evaluation metrics obtained from the calculation
of actual and simulated results.
Evaluation
metrics
Reference
range
Desired value Value
R-Pearson [0,1] Closer to 1 (strong positive
linear relationship)
0.89
R-squared [0,1] Closer to 1 (more
variance explained)
0.79
Root Mean
Squared Error
(RMSE)
[0,+∞) Closer to 0 (minimized
as much as possible)
2.57
Directional
Accuracy (DA)
[0,1] Closer to 1 (high proportion
of correct predictions)
0.76
6.3 Findings
6.3.1 The ‘Hidden’ Infections
Fig 11 illustrates the counts of agents in E, I1, and I2
states from January 24, 2020, to May 8, 2023. Fig 12
shows vaccination doses administered during the
same period.
Observations reveal:
1. The rise in I1 population correlates with an
increase in E population, indicating a positive
infection loop. Waves 1 to 4 depend on individual
recovery and antibody production, with
underreported cases due to insufficient testing.
2. Coronavirus mutations lead to a convergence of E
and I1 populations until the late 6th wave. The 4
th
dose vaccination campaign, starting on May 25,
2022, mitigates the rise in E cases.
3. Despite a decrease in I1 population post-7
th
wave,
expanded PCR testing capacity results in reported
cases exceeding previous waves.
COMPLEXIS 2024 - 9th International Conference on Complexity, Future Information Systems and Risk
38

The robust correlation observed between PCR tests
and confirmed cases indicates that the reported cases
represent only a fraction of actual infections.
6.3.2 Antibody from Vaccination and Cure
Following vaccination rollout, antibody levels surged
rapidly across the community. By October 2021,
effectiveness waned, but rebounded in January 2022
with the Omicron variant and third vaccine dose
introduction.
Amid escalating transmission and virus
mutations, antibody levels increased gradually. The
timely fourth /bivalent dose introduction further
elevated population antibody levels to record highs.
6.3.3 Reasons Behind the Eight Waves
We outline features of the infection trends in Tokyo
in Table 9. Here are the factors contributing to these
characteristics:
1. Tokyo commenced its first vaccine dose during
the 4
th
wave, later than New York and London,
rendering it susceptible to future mutations
(Tokyo: April 12, 2021; New York: December 14,
2020; London: December 8, 2020).
2. Insufficient PCR testing capacity in waves 1-5
failed to accurately reflect infection trends.
3. Improved PCR testing during the Omicron-
dominated 6
th
wave revealed historically high
confirmed cases, despite reduced severity and
mortality rates due to previous vaccination and
self-recovery (Larrauri et al., 2022).
4. BA.2.75 variant, identified in the 7
th
& 8
th
wave, evades most antibodies, hindering control
efforts even with high vaccination rates (Fig 11 &
Fig 12). Increased PCR testing primarily led to
higher daily confirmed cases without effectively
curbing overall infection trends.
Table 9: Summary of the eight epidemic waves in Tokyo with key assumptions and result.
Epidemic
waves
Key assumptions Key results
Vaccination Virus mutation Government policies
Daily PCR
tests
I1 I2
Vaccination
antibody
Infection antibody
1st wave
(2020.01~
2020.05
)
/ 1st COVID-19 case
(2020.01.24)
1st state of emergency
(2020.04.07~ 2020.05.25)
Low
(ave. 500)
High Low / Start to increase due to
self-healing
2nd wave
(2020.05~
2020.10
)
/ / Bans entry from 159
countries and regions
(
2020.08.28
)
Low
(ave. 3600)
Low Low / Start to decrease due
to antibody decline
3rd wave
(2020.10~
2021.03)
/ 1st Gamma case
(2021.01.12)
2nd state of emergency
(2021.01.07~2021.03.21)
Low
(ave. 7900)
Low Low / Stable due to limited
infection
.4th wave
(2021.03~
2021.06)
1st dose start
(2021.04.12)
2nd dose start
(2021.05.13)
1st Delta case
(2021.04.20)
1st quasi state of emergency
(2021.04.12~ 2021.04.24)
3rd state of emergency
(2021.04.25~ 2021.06.20)
Low
(ave. 8600)
Low Low Start to
increase
Increase due to mass
infection
5th wave
(2021.06~
2021.10)
/ 1st Delta N501S
(2021.08.31)
2nd quasi state of emergency
(2021.06.21~ 2021.07.11)
4th state of emergency
(2021.07.12~ 2021.09.30)
Medium
(ave.
11,100)
High Low Dose 1 and 2
effectiveness
start to
decrease due
to antibody
decline
Continue to increase
6th wave
(2021.12~
2022.06)
3th dose start
(2021.12.01)
4th dose start
(2022.05.25)
1st Omicron case
(2021.11.30)
1st Omicron BA.2
(Approx.2021.12.25)
1st Omicron XE
(2022.04.12)
1st Omicron BA.4
(2022.04.22)
1st Omicron BA.5
(
2022.04.29
)
3rd quasi state of emergency
(2022.01.09~ 2022.03.21)
Limited foreign travel
groups,
up to 20,000 daily
(2022.06.01)
High
(ave.
17,100)
High Medium
high
Dose 3 and 4
effectiveness
start to
increase due
to booster
doses
vaccination
Previous antibodies
become less protective
faced with Omicron
strains;
Infection antibodies
targeting Omicron
strains start to
increase.
7th wave
(2022.06~
2022.09)
Bivalent dose
start
(2022.09.20)
1st Omicron BA.2.75
(2022.07.13)
1
st
Omicron XBB
(
2022.10.28
)
Allow short-term trips
organized by travel agencies,
up to 50,000 daily
(
2022.09.07
)
High
(ave.
23,500)
High High Dose 3 and
dose 4
become less
protective;
Bivalent dose
effectiveness
start to
increase
8th wave
(2022.10~
2023.01)
Fully reopen (2022.10.11) High
(ave.
16,400)
High Medium
high
Evaluating the Multifactorial Effects on SARS-CoV-2 Spread in Tokyo Metropolitan Area with an Agent-Based Model
39
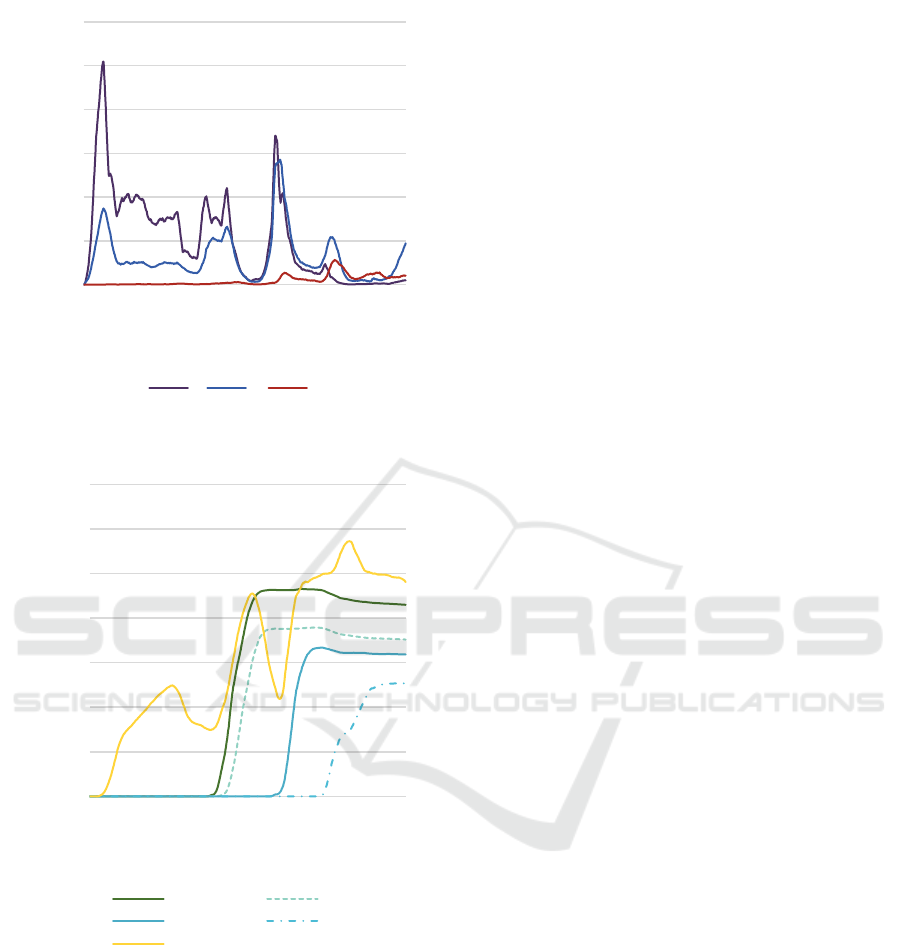
Figure 11: Number of agents in E, I1 and I2 states.
Figure 12: 1
st
, 2
nd
, 3
rd
, 4
th
doses of vaccination.
7 RECOMMENDATION AND
CONCLUSION
7.1 Recommendation
The decline in confirmed cases in late January led to
a decrease in testing, indicating a reduced perception
of infection risk among the public. This trend, known
as the "testing dilemma," illustrates that fewer
confirmed cases may result in decreased testing rates,
potentially leading to fewer reported cases.
Report from The Japan News reveals a consistent
rise in cases since April to May 2023. This surge may
be attributed to the "testing dilemma." Moreover,
cases continued to rise in June (Otake, 2023), with a
significant increase in new patients reported.
To combat recurring outbreaks, it's crucial to
maintain vigilance and promptly mobilize healthcare
resources, including testing capabilities and hospital
beds. Japan's opening-up policy must be monitored
closely alongside daily confirmed cases, mutation
detection, and fatality rates. Although fatality rates
have decreased, the risk of new troublesome variants
remains.
7.2 Conclusion
The resurgence of COVID-19 cases in late May and
June highlights the importance of maintaining
vigilance and mobilizing resources. Despite the low
rates of severe cases and deaths, PCR tests may not
significantly reduce infections but should be
maintained to detect potential severe variants.
Tokyo's existing healthcare infrastructure is
deemed satisfactory, taking into account the available
hospital beds and anticipated low severe cases.
However, the mobility to swiftly expand hospital bed
capacity is imperative to manage potential outbreaks
and imported mutated virus. High vaccination rates
for third and fourth doses enhance immunity against
Omicron variants, aligning closely with forecasted
scenarios. A correlation exists between confirmed
cases and testing levels, with fewer cases reported
during reduced testing due to the "testing dilemma."
Novelty of this study lies in its demonstration of
the importance of COVID-19 infection forecasting
concerning vaccination, virus mutation, government
policy, and PCR testing. It pioneers in continuously
simulating and reproducing eight epidemic waves in
Tokyo, considering factors like Olympics, state of
emergency declarations, and immigration policies.
The extension of the traditional SEIR model to adapt
to Tokyo's context, along with an agent-based
approach, ensures high accuracy and practicality.
This model may serve as a general framework for
analysing epidemics in other regions, emphasizing
the importance of local considerations for better
simulation results.
There are several flaws in this work. Firstly, this
study focuses on four significant factors influencing
epidemic trends but acknowledges that there are
numerous other variables that may also impact these
trends. While the theory of large-scale flow dynamics
0
1000
2000
3000
4000
5000
6000
24/jan/20
22/mar/20
19/mai/20
16/jul/20
12/set/20
09/nov/20
06/jan/21
05/mar/21
02/mai/21
29/jun/21
26/ago/21
23/out/21
20/dez/21
16/fev/22
15/abr/22
12/jun/22
09/ago/22
06/out/22
03/dez/22
30/jan/23
29/mar/23
Number of Agents
Date
E I1 I2
0
2000
4000
6000
8000
10000
12000
14000
24/jan/20
22/mar/20
19/mai/20
16/jul/20
12/set/20
09/nov/20
06/jan/21
05/mar/21
02/mai/21
29/jun/21
26/ago/21
23/out/21
20/dez/21
16/fev/22
15/abr/22
12/jun/22
09/ago/22
06/out/22
03/dez/22
30/jan/23
29/mar/23
Number of Agents
Date
1st dose 2nd dose
3rd dose 4th dose
V+R
COMPLEXIS 2024 - 9th International Conference on Complexity, Future Information Systems and Risk
40

is proposed to address agent movement, further
refinement is needed to better represent real-world
complexities. Additionally, demographic factors such
as natural birth and death rates, as well as family
dynamics, are not considered in this research,
highlighting the need for future models to incorporate
these elements. The simulation's strategy of randomly
selecting agents for PCR tests diverges from real-
world testing practices, which could affect the
accuracy of results and should be addressed in future
iterations. Lastly, the complexity of immune response,
as highlighted by Dr. Israel, poses challenges in
accurately incorporating antibody titer data into
simulations due to individual variations and decay
rates, emphasizing the importance of cautious
interpretation in future studies.
ACKNOWLEDGEMENTS
First and foremost, I am grateful to Dr. Zhiyi Zhang
who inspired me to develop this research. I also thank
M.D. Ariel Israel for his inspiring paper and
feedback. I would like to express my gratitude to the
WINGS-CFS Program and the Japan Society for the
Promotion of Science for providing research funding.
Moreover, the authors acknowledge the
development of the TokyoCovSim-VVGP model
which was designed and implemented by Jianing Chu.
The model plays a pivotal role in simulating the eight
waves of COVID-19 in Tokyo combining four key
factors (Vaccination, Virus mutation, Government
policy and PCR test). For further details about
TokyoCovSim-VVGP, interested readers can access
it via the following link: https://github.com/J-
Chu52/TokyoCovSim-VVGP.git
REFERENCES
Cai, J., Deng, X., Yang, J., Sun, K., Liu, H., Chen, Z., . . .
Zou, J. (2022). Modeling transmission of SARS-CoV-
2 omicron in China. Nature medicine, 28(7), 1468-
1475.
Chiba, A. (2021). The effectiveness of mobility control,
shortening of restaurants' opening hours, and working
from home on control of COVID-19 spread in Japan.
Health Place, 70, 102622. https://doi.org/10.1016/
j.healthplace.2021.102622
Chu, J., Morikawa, H., & Chen, Y. (2023). Simulation of
SARS-CoV-2 epidemic trends in Tokyo considering
vaccinations, virus mutations, government policies and
PCR tests. Biosci Trends, 17(1), 38-53.
https://doi.org/10.5582/bst.2023.01012
Ebinger, J. E., Fert-Bober, J., Printsev, I., Wu, M., Sun, N.,
Prostko, J. C., . . . Braun, J. G. (2021). Antibody
responses to the BNT162b2 mRNA vaccine in
individuals previously infected with SARS-CoV-2.
Nature medicine, 27(6), 981-984.
Hethcote, H. W. (2000). The mathematics of infectious
diseases. SIAM review, 42(4), 599-653.
Hoertel, N., Blachier, M., Blanco, C., Olfson, M., Massetti,
M., Rico, M. S., . . . Leleu, H. (2020). A stochastic
agent-based model of the SARS-CoV-2 epidemic in
France. Nature medicine, 26(9), 1417-1421.
International_Olympic_Committee. (2021). Tokyo 2020
Olympic Village(s) Period of stay Guidelines for the
NOCs.
https://stillmedab.olympic.org/media/Document%20Li
brary/OlympicOrg/News/2020/12/Tokyo-2020-
Olympic-Village-Guidelines-for-NOCs-in-relation-to-
period-of-stay-eng.pdf
Israel, A., Shenhar, Y., Green, I., Merzon, E., Golan-Cohen,
A., Schäffer, A. A., . . . Magen, E. (2022). Large-scale
study of antibody titer decay following BNT162b2
mRNA vaccine or SARS-CoV-2 infection. Vaccines,
10(1), 64.
Larrauri, B., Malbran, A., & Larrauri, J. A. (2022).
Omicron and vaccines: An analysis on the decline in
COVID-19 mortality. medRxiv.
Matsuyama, K. (2022, 2022-11-22T21:22:33+09:00).
Shionogi COVID-19 pill Xocova wins emergency
approval in Japan | The Japan Times. @japantimes.
Retrieved January 19, from https://www.japan
times.co.jp/news/2022/11/22/national/science-health/
shionogi-covid-xocova-approval/
McCurry, J. (2021, 2021-05-20). 79,000 people flying in for
Tokyo Olympics, Japanese media reports. @guardian.
Retrieved January 19, from http://www.theguardian.
com/sport/2021/may/20/organisers-of-tokyo-olympics
-press-ahead-despite-covid-fears
MHLW. (2023a). COVID-19 Q&A. Retrieved January 19,
from https://www.mhlw.go.jp/stf/covid-19/qa.html
MHLW. (2023b). COVID-19 tests. Ministry of Health,
Labour and Welfare. Retrieved January 19, from
https://www.mhlw.go.jp/stf/seisakunitsuite/bunya/000
0121431_00182.html
Murakami, T., Sakuragi, S., Deguchi, H., & Nakata, M.
(2022). Agent-based model using GPS analysis for
infection spread and inhibition mechanism of SARS-
CoV-2 in Tokyo. Sci Rep, 12(1), 20896.
https://doi.org/10.1038/s41598-022-25480-z
Narasimhan, M., Mahimainathan, L., Araj, E., Clark, A. E.,
Markantonis, J., Green, A., . . . Fankhauser, K. (2021).
Clinical evaluation of the Abbott Alinity SARS-CoV-2
spike-specific quantitative IgG and IgM assays among
infected, recovered, and vaccinated groups. Journal of
clinical microbiology, 59(7), e00388-00321.
Otake, T. (2023). COVID wave looms in Japan after case
numbers nearly double in a month. @japantimes.
Polack, F. P., Thomas, S. J., Kitchin, N., Absalon, J.,
Gurtman, A., Lockhart, S., . . . Group, C. C. T. (2020).
Safety and Efficacy of the BNT162b2 mRNA Covid-19
Evaluating the Multifactorial Effects on SARS-CoV-2 Spread in Tokyo Metropolitan Area with an Agent-Based Model
41

Vaccine. N Engl J Med, 383(27), 2603-2615.
https://doi.org/10.1056/NEJMoa2034577
Purkayastha, S., Bhattacharyya, R., Bhaduri, R., Kundu, R.,
Gu, X., Salvatore, M., . . . Mukherjee, B. (2021). A
comparison of five epidemiological models for
transmission of SARS-CoV-2 in India. BMC infectious
diseases, 21(1), 1-23.
Saad-Roy, C. M., Morris, S. E., Metcalf, C. J. E., Mina, M.
J., Baker, R. E., Farrar, J., . . . Levin, S. A. (2021).
Epidemiological and evolutionary considerations of
SARS-CoV-2 vaccine dosing regimes. Science,
372(6540), 363-370.
Wilensky, U. (1999). NetLogo. Evanston, IL: Center for
connected learning and computer-based modeling,
Northwestern University. In.
Wolfram, S., & Gad-el-Hak, M. (2003). A new kind of
science. Appl. Mech. Rev., 56(2), B18-B19.
Yamauchi, T., Takeuchi, S., Uchida, M., Saito, M., &
Kokaze, A. (2022). The association between the
dynamics of COVID-19, related measures, and daytime
population in Tokyo. Scientific Reports, 12(1), 1-12.
Zhang, Y. (2021, 2021-06-01). Australia’s softball players
are among the first Olympic athletes to arrive in Japan.
(Published 2021). @nytimes. Retrieved January 19,
from https://www.nytimes.com/2021/06/01/world/asia/
australia-olympics-tokyo-japan-softball.html
COMPLEXIS 2024 - 9th International Conference on Complexity, Future Information Systems and Risk
42
