
Forecasting of Key Performance Indicators Based on Transformer Model
Claudia Diamantini
1 a
,Tarique Khan
1 b
, Alex Mircoli
2 c
and Domenico Potena
1 d
1
Department of Information Engineering, Universit
`
a Politecnica delle Marche, Italy
2
Department of Economic and Social Sciences, Universit
`
a Politecnica delle Marche, Italy
Keywords:
Deep Learning, Neural Networks, Transformer, Organization Process Management, KPIs, Performance
Indicators.
Abstract:
Key performance indicators (KPIs) express the company’s strategy and vision in terms of goals and enable
alignment with stakeholder expectations. In business intelligence, forecasting KPIs is pivotal for strategic
decision-making. For this reason, in this work we focus on forecasting KPIs. We built a transformer model
architecture that outperforms conventional models like Multi-Layer Perceptrons (MLP), Long Short-Term
Memory (LSTM) networks, Convolutional Neural Networks (CNN), and Recurrent Neural Networks (RNN)
in KPI forecasting over the Rossmann Store, supermarket 1, and 2 datasets. Our results highlight the revolu-
tionary potential of using cutting-edge deep learning models such as the Transformer.
1 INTRODUCTION
Responding to the digital data-driven society, com-
panies and other organizations can now obtain a vast
amount of information in various formats. Employ-
ing the available data effectively can lead to modifica-
tions in an organization’s processes, systems, and pro-
cedures, as continuous business enhancement is nec-
essary. Utilizing Key Performance Indicators (KPIs)
helps in maintaining high levels of performance (Tsai
and Cheng, 2012). By diligently tracking and analyz-
ing relevant metrics in real-time, it is possible to ef-
fectively pinpoint and understand limitations, evalu-
ate the productivity of both employees and machines,
establish more ambitious objectives, and successfully
achieve them by progressing forward. Measuring per-
formance allows individuals to identify any concerns
regarding their performance, assess their progress to-
ward their objectives, and provide specific instruc-
tions for resolving any issues (Horv
´
athov
´
a et al.,
2015). Forecasting KPIs which is the fundamental
goal of this work, is an essential undertaking for nu-
merous businesses and organizations.
Various types of Key Performance Indicators (KPIs),
such as cost and time KPIs, can be created based on
a
https://orcid.org/0000-0001-8143-7615
b
https://orcid.org/0009-0004-1756-3560
c
https://orcid.org/0000-0001-6459-0335
d
https://orcid.org/0000-0002-7067-5463
the specific situation. However, predicting KPIs can
be a difficult endeavor due to the complex and ever-
changing patterns that they typically reflect. Mar-
ket trends, consumer behavior, seasonal variations,
events, and anomalies are just a few of the internal and
external factors that have an impact on these patterns.
So, regular forecasting methods like statistical mod-
els, time series models, and simple machine learning
models often have trouble understanding how KPIs
work and how they are connected, which leads to pre-
dictions that are not accurate or reliable. A possi-
ble solution is represented by deep learning models,
which provide a more sophisticated and flexible ap-
proach to KPI analysis and prediction.
Deep learning and transformer-based models have be-
come increasingly popular because of their ability to
analyze massive and diverse datasets and identify sig-
nificant patterns and relationships that are important
for forecasting (Emmert-Streib et al., 2020). These
models are a type of artificial neural networks that
comprise numerous layers of nonlinear transforma-
tions. These layers allow the models to acquire in-
tricate and abstract representations of data.
This study presents a transformer-based model for
predicting KPIs. Our methodology harnesses the
benefits of different neural network layers while ad-
dressing the drawbacks of conventional forecasting
techniques. We also considered other deep learning
models, including MLP, LSTM, CNN, and RNNs,
and compared them with the transformer model.
280
Diamantini, C., Khan, T., Mircoli, A. and Potena, D.
Forecasting of Key Performance Indicators Based on Transformer Model.
DOI: 10.5220/0012726500003690
Paper published under CC license (CC BY-NC-ND 4.0)
In Proceedings of the 26th International Conference on Enterprise Information Systems (ICEIS 2024) - Volume 2, pages 280-287
ISBN: 978-989-758-692-7; ISSN: 2184-4992
Proceedings Copyright © 2024 by SCITEPRESS – Science and Technology Publications, Lda.

We assessed their performance on diverse real-world
datasets of KPIs.
The subsequent sections of this work are struc-
tured as follows: Section 2 provides a comprehensive
analysis of KPI forecasting by reviewing relevant lit-
erature. Section 3 outlines the proposed methodology
for predicting Key Performance Indicators (KPIs) us-
ing deep learning models and gives information about
the Transformer architecture. Section 4 presents the
experiments while Section 5 discusses the results.
Conclusions are drawn in Section 6, where the key
findings and contributions are summarized.
2 LITERATURE STUDY
Key Performance Indicators (KPIs) are crucial tools
for evaluating business performance However, man-
aging and prioritizing KPIs can be challenging, lead-
ing to research on various methods dealing with is-
sues such as modeling, maintenance, and expressive-
ness (Khan. et al., 2023). Statistical analysis and sim-
ple mathematical models have historically been the
fundamental components of KPI forecasting. Time-
series analysis and linear regression were popular
techniques in previous business contexts (Tadayonrad
and Ndiaye, 2023; Le et al., 2018). Despite being suc-
cessful in linear and stable contexts, these approaches
frequently fail in complex and dynamic commercial
environments. Machine learning (ML) approaches
have been gradually used as a result of the shortcom-
ings of previous methodologies. By using algorithms
like decision trees, support vector machines, and sim-
ple neural networks, machine learning provided more
advanced, data-driven methods for KPI forecasting
(Le et al., 2018; El Mazgualdi et al., 2021). More
complex and adaptive models were made possible by
this shift, which was a major turning point in the de-
velopment of KPI forecasting.
Dealing with data complexity is one of the main
challenges in KPI forecasting (Gurtner and Cook,
2017; Armaki and Mohammed, 2023). In addition to
this, the need for real-time KPI analysis has fueled the
advancement of forecasting techniques. Research has
emphasized the need for models that can quickly ad-
just to evolving data streams to give decision-makers
timely information (Gupta et al., 2016; Zhang et al.,
2020; Svensson et al., 2015). Also making accurate
forecasts is still a significant challenge (Pietukhov
et al., 2023).
The forecasting paradigm shifted with the emergence
of machine learning. According to (Bishop, 2006),
its preliminary use in KPI forecasting showed encour-
aging outcomes, especially when dealing with more
intricate and non-linear data patterns. Deep learn-
ing emerged as a result of these techniques, which
opened the door for more advanced methods (LeCun
et al., 2015). Sun et al. (Sun and Ge, 2020), explores
the utilization of deep learning methods in industrial
operations to monitor and forecast essential perfor-
mance metrics (KPIs). The author suggests a tech-
nique known as an ensemble semi-supervised gated
stacked autoencoder (ES2GSAE). It is also mentioned
that ensemble deep learning, semi-supervised learn-
ing, and gated stacked autoencoders together make it
easier to guess KPIs in business processes. Some of
the deep learning models are briefly explained below.
Linear Network: This model is a straightforward
tool suitable for regression tasks, specifically for pre-
dicting KPIs. Mathematically, it can be expressed as
given in Equation 1.
y = W x + b (1)
The output in this case is represented by y, the in-
put vector by x, the weight matrix by W, and the bias
vector by b. The model can modify the output in-
dependently of the input thanks to the bias matrix b,
while the weight matrix W specifies how each input
contributes to the output.
Long Short-Term Memory (LSTM) can be effec-
tive in predicting KPIs in many fields such as fi-
nance, healthcare, and manufacturing (Goodfellow
et al., 2016).
f
t
= σ(W
f
·[h
t−1
, x
t
] + b
f
) (2)
It determines the specific data to exclude from the
cell state. The process involves taking the previous
hidden state h
t−1
and the current input x
t
, combining
them, and then applying a linear transformation using
the weight matrix W
f
and bias b
f
. The sigmoid func-
tion, denoted by σ, compresses the output values to a
range of 0 to 1. Values approaching 1 indicate that
the information should be retained, whereas values
approaching 0 indicate that the information should be
discarded. Mathematically, this can be expressed as
given in Equations 2-7.
i
t
= σ(W
i
·[h
t−1
, x
t
] + b
i
) (3)
o
t
= σ(W
o
·[h
t−1
, x
t
] + b
o
) (4)
˜
C
t
= tanh(W
C
·[h
t−1
, x
t
] + b
C
) (5)
C
t
= f
t
∗C
t−1
+ i
t
∗
˜
C
t
(6)
h
t
= o
t
∗tanh(C
t
) (7)
Forecasting of Key Performance Indicators Based on Transformer Model
281

LSTM units process sequential data with several crit-
ical components. The forget gate uses the previous
concealed state and current input to decide which in-
formation to keep and which to delete from the cell
state, then applies a sigmoid function. The input gate
determines what new cell state information to add.
Recurrent Neural Networks (RNNs) have been em-
ployed to forecast Key Performance Indicators (KPIs)
in diverse fields, such as speech recognition, natural
language processing, and finance (Goodfellow et al.,
2016). An RNN can be mathematically expressed as
given in Equation 8.
h
t
= tanh(W
hh
h
t−1
+W
xh
x
t
+ b) (8)
In this equation, the hidden state at time t, or the
RNN’s memory component storing data from earlier
inputs, is represented by the symbol h
t
. The weight
matrix that connects the current state, W
hh
, to the prior
hidden state, h
t−1
, is W
hh
. The weight matrix for the
current input, x
t
, is W
xh
, and the bias is b. The hyper-
bolic tangent function, or tanh , adds non-linearity to
the input, enabling the network to recognize intricate
patterns.
CNN applied for forecasting Key Performance Indi-
cators (KPIs) in fields where the input data exhibits
a spatial arrangement, such as sensor data collected
from a manufacturing facility (Brownlee, 2018). A
CNN can be mathematically expressed as given in
Equation 9.
Z = f (W ∗X + b) (9)
Here, Z stands for the output feature map, W for the
convolutional filter’s (kernel’s) weights, X for the in-
put data, b for the bias, and the convolution process.
Usually, the function f is a non-linear activation func-
tion, such as the Rectified Linear Unit (ReLU).
LSTM + CNN model is a hybrid approach that lever-
ages the advantages of both LSTMs and CNNs. This
model can be mathematically expressed as given in
Equation 10.
C = CNN(X) H
t
= LSTM(C, H
t−1
) (10)
At each time point, CNN may extract features re-
lated to product quality or equipment performance;
the LSTM then learns how these qualities change over
time to help anticipate future maintenance needs or
performance.
Transformer models perform better in terms of ac-
curacy, efficiency, and scalability than conventional
forecasting techniques. Large datasets may be pro-
cessed and learned by them, which enables a more so-
phisticated comprehension of data patterns and more
precise forecasting. Furthermore, transformer mod-
els’ scalability allows them to accommodate grow-
ing data volumes, something that older approaches
frequently cannot (Brownlee, 2018). It performs es-
pecially well in scenarios with high dimensionality,
complicated data linkages, or quickly evolving trends.
Transformer dominance in these situations is their so-
phisticated data processing powers and their ongoing
capacity to absorb and adjust to new information.
3 METHODOLOGY
The transformer model works on the principle of man-
aging sequential data without the requirement for re-
currence or convolution. It was initially created for
natural language processing applications. These char-
acteristics make it ideal for predicting KPIs, as KPIs
frequently depend on time-series data, which is se-
quential by nature. The model is a great tool for
projecting future KPI values based on historical per-
formance, as it can evaluate complete sequences at
once, enabling it to gradually identify complicated
patterns. The self-attention mechanism is the main
predictive technique used by the transformer. This
makes it possible for the model to assign varying
weights to various input sequence points. This makes
it possible for the model to assign varying weights
to various input sequence points. This implies that
when predicting future KPI values, the model can de-
termine which historical data points (e.g., past sales
numbers, website traffic) are most significant. The
model gains knowledge of the correlations and pat-
terns present in the data by training on prior KPI data,
which enables it to forecast future performance with
accuracy. Transformers analyze all data points con-
currently, which greatly reduces training and infer-
ence times as compared to recurrent neural networks.
It can readily capture correlations between data points
that are widely apart in the sequence because of the
self-attention process. This is important since long-
term trends and patterns are important for KPI pre-
diction. Beyond text, transformers may be used with
a variety of data formats, including numerical time-
series data which is important for KPI forecasting.
Step 1: Representation of Query, Key, and Value:
Three representations are produced given a series of
input data KPI values: Values (V ), Keys (K), and
Queries (Q). These are acquired by input data alter-
ations that are learned linearly. These representations,
when used in the context of KPI prediction, encapsu-
late many facets of the input data that are essential for
comprehending its relevance and context.
Step 2: Attention Score Calculation: The attention
scores are determined by multiplying the Queries and
Keys using a dot product, as given in Equation 11.
ICEIS 2024 - 26th International Conference on Enterprise Information Systems
282

Scores = QK
T
(11)
The similarity between each query and key is mea-
sured in this step, which helps determine how much
weight to give each data point in a prediction.
Step 3: Scaling: To keep the gradients of the soft-
max from being too tiny, the scores are reduced by
the square root of the keys’ dimension (
√
d
k
) as given
in equation 12:
Scaled Scores =
Scores
√
d
k
(12)
Step Four: Softmax: Subsequently, a softmax func-
tion is applied to the scaled scores to convert them
into probabilities, as specified in Equation 13
AttentionWeights = So f tmax (Scaled Scores) (13)
Using the computed scores as a basis, this phase
emphasizes the significance of each value in the se-
quence.
Step 5: Equivalent Sum: Ultimately, the output of
the attention mechanism is generated by computing
a weighted sum of the Values, utilizing the attention
weights as detailed in Equation 14.
Out put = Attention Weights . V (14)
The results provide an enhanced representation of the
input data by emphasizing the most significant seg-
ments for predicting future KPI values. The compre-
hensive formulation of the Transformer model, as de-
tailed in Equation 15, demonstrates this process.
Attention(Q, K, V ) = softmax
QK
T
√
d
k
V (15)
The methodology is explained step by step below and
is also graphically viewed in Figure 1.
Detail Architecture of the Transformer Model:
We develop a transformer-based model given the fol-
lowing scenario: 4 batch sizes, 9 sequences (or fea-
ture set) lengths, 768 embedding sizes, and 4 attention
heads.
1. Input Sequence: A batch of four sequences, each
with nine characteristics, in the shape (4, 9), are the
inputs that the model takes.
2. Embedding Layer: The sequence’s features are
converted into 768-dimensional vectors, giving rise to
the shape (4, 9, 768).
3. Positional Encoding: Positional encodings are
introduced to preserve sequence order information,
maintaining the shape at (4, 9, 768).
4. Transformer Blocks: The model can concentrate on
various segments of the input sequence by using four
heads for self-attention. These building components
allow for sophisticated interactions while preserving
the geometry of the input. The output shape of each
transformer block is (4, 9, 768).
5. Pooling/Aggregation Layer: This optional stage
produces a fixed-size output for each sequence by re-
ducing the sequence dimension. Average pooling is a
popular method that yields a shape of (4, 768).
6. Fully Connected Layers: After that, the model goes
through fully connected layers processing the pooled
output, adjusting the final layer for the regression job.
The shape that comes before the output layer is (4,
256) if the last hidden layer has a size of 256.
7. Output Layer: Each sequence’s regression output
is generated by a single linear neuron, giving rise to
an output shape of (4, 1).
4 EXPERIMENTS
The study’s experimental evaluation is set up to assess
how well different deep learning models predict Key
Performance Indicators (KPIs) in different datasets.
For each dataset, data were divided into training
and test set using an 80/20 ratio Results were eval-
uated using the following four evaluation measures:
Mean Squared Error (MSE), Root Mean Squared Er-
ror (RMSE), Mean Absolute Error (MAE), and R
2
.
Three different datasets were used in this work, each
of which offers a different perspective on retail op-
erations and consumer behavior. The datasets contain
transactional data from two distinct grocery chains, as
well as sales data from the European pharmacy chain
Rossmann. When taken as a whole, they include a
broad range of characteristics, from daily sales and
promotional activities to consumer demographics and
purchasing habits, providing a thorough understand-
ing of the elements impacting important performance
metrics in the retail industry, The datasets are avail-
able at
1
,
2
,
3
.
Overview of Rossmann Store Sales: Sales infor-
mation from Europe’s largest chain of pharmacies,
Rossmann, is included in this dataset. This dataset
contains daily sales data for 1,115 shops. It is com-
monly used in research and forecasting competitions
to anticipate sales, a crucial KPI for retail operations,
and is publicly available. Important characteristics are
enumerated below:
Sales: The target variable is a direct reflection of daily
sales data and shop performance.
1
https://www.kaggle.com/competitions/rossmann-
store-sales/data
2
https://www.kaggle.com/datasets/anandku79/
kpidashboard
3
https://www.kaggle.com/code/tatianakushniruk/
superstore-sales-profit-analysis/input
Forecasting of Key Performance Indicators Based on Transformer Model
283

Figure 1: The architecture of the Transformer model.
Store type: Sales trends are influenced by categorical
data that indicates the kind of store.
Assortment: categorical information indicating the
degree of variety (basic, additional, and extended)
that the shop offers and how it affects client decisions
and sales volume.
Promotions: Sales numbers are directly impacted by
binary data that indicates if a retailer was running a
deal on a certain day.
State Holidays: Details on public holidays that have
an impact on sales and foot traffic in stores.
Holidays: Binary data indicating the dates of the
school holidays may cause fluctuations in sales as a
result of shifts in the number of customers.
Day of the Week: An approach to capturing weekly
sales patterns using categorical data. Significance to
Forecasting KPIs: This dataset makes it possible to
investigate the relationship between sales KPIs and a
variety of factors, such as holidays, promotions, and
shop attributes. The study intends to show how deep
learning models can anticipate complicated patterns
and temporal correlations present in retail sales data
using sales forecasting.
Supermarket Dataset 1: Transactional data from a
chain of supermarkets are included in this dataset,
which records specific client purchase information
over time. Data on product purchases, customer de-
mographics, transaction durations, and modes of pay-
ment are all included. The dataset has been organized
in a way that makes it easier to analyze consumer be-
havior and buying trends. Important characteristics
are:
Transaction Amount: An important KPI that serves as
a direct indicator of income is the monetary value of
each transaction.
Product Categories: Detailed data on the categories
of goods bought, reflecting consumer inclinations and
impacting inventory control tactics.
Customer demographics: Information about a cus-
tomer’s age, gender, and maybe geography that pro-
vides hints about potential market niches.
Time of Transaction: Each transaction is times-
tamped, allowing for the study of peak shopping
hours and trends.
Significance for KPI Forecasting: This dataset is used
in the study to investigate how well deep learning
models predict revenue and comprehend consumer
purchase patterns, two essential KPIs for supermar-
ket operations. Future sales patterns and consumer
behavior can be predicted by analyzing transaction
quantities and customer profiles.
Supermarket Dataset 2: As with Supermarket
Dataset 1, this dataset provides a chance to assess the
model’s performance in other retail contexts by con-
taining transactional and customer data from an alter-
native supermarket chain or location. While some of
the variables may differ in terms of magnitude, client
base, or product variety, Supermarket Dataset 1’s vari-
ables are included. Important characteristics are:
Product Sales Volume: Quantitative information on
the quantity of goods sold; essential for supply chain
and inventory management.
Promotional Data: Details on in-store sales events,
discounts, and exclusive deals that have a big influ-
ence on consumer traffic and sales figures.
Customer Loyalty Information: Information on a cus-
tomer’s involvement in loyalty programs that influ-
ences the frequency and patterns of their purchases.
Seasonal Variations: Information that captures events
and trends specific to a given season is essential for
modifying stock and marketing plans.
Relevance to KPI Forecasting: This dataset offers a
ICEIS 2024 - 26th International Conference on Enterprise Information Systems
284

Table 1: Experimental results of transformer and other methods over Rossmann Sales.
Algorithms MAE MSE RMSE R Squared
MLP 835.54 1750 258.53 1322.57 0.89
LSTM 800.01 1646 816.85 1283.77 0.91
CNN 1255.74 3734 871.20 1932.60 0.74
RNN 821.29 1945 628.38 1394.37 0.88
Transformer 760.48 1475 395.99 1214.00 0.96
Table 2: Experimental results of transformer and other methods over Supermarket Dataset 1.
Algorithms MAE MSE RMSE R Squared
MLP 420.64 2067 452.70 1437.47 0.688
LSTM 347.81 1898 975.52 1378.01 0.841
CNN 800.00 2292 541.22 1514.83 0.402
RNN 400.59 1910 223.67 1382.21 0.590
Transformer 292.10 1665 437.11 1290.65 0.764
Table 3: Experimental results of transformer and other methods over Supermarket Dataset 2.
Algorithms MAE MSE RMSE R Squared
MLP 610.39 2521 637.84 1587 0.81
LSTM 589.10 1736 824.54 1317 0.91
CNN 810.22 2944 832.88 1716 0.53
RNN 600.71 2068 537.32 1438 0.72
Transformer 428.86 1546 783.55 1243 0.89
benchmark for evaluating the accuracy and flexibility
of deep learning models in predicting KPIs in various
supermarket environments. It emphasizes how well
the models can forecast key performance indicators
(KPIs) like sales volume, the success of promotions,
and the effect of seasonal fluctuations on sales.
5 RESULTS AND DISCUSSIONS
The results of the above-mentioned experiments show
that the Transformer model performs exceptionally
well for the Rossmann Store Sales dataset, with the
lowest scores for MAE (760.48), MSE (1475395.99),
and RMSE (1214.00), as well as the highest R
2
(0.96).
All the results are reported in Table 1. Following
closely, the LSTM model demonstrates its efficacy in
managing sequential data due to its innate ability to
retain long-term dependencies. CNNs are normally
quite good at extracting features, but they don’t seem
to work as well in this situation. This could be be-
cause sales data is sequential, which means that CNNs
aren’t built to capture temporal correlations.
Supermarket Dataset 1 provides more evidence of the
Transformer model’s predictive strength, as it has the
lowest MAE (292.10) and RMSE (1290.65) as well
as a high R
2
(0.764), indicating its adaptability to a
wide range of data types. All the results are reported
in Table 2. Due to its ability to handle both sequen-
tial and time-series data, the LSTM model performs
impressively. Relative to the Rossmann Store Sales
dataset, the CNN model performs poorly, potentially
for similar reasons. Further highlighting the Trans-
former and LSTM models’ appropriateness for these
forecasting tasks is the nature of the data in Super-
market Dataset 1, which is probably rich in temporal
patterns like those in Rossmann’s dataset.
The Supermarket Dataset 2 study shows a similar pat-
tern, with the Transformer model exhibiting the high-
est overall performance in terms of all metrics, espe-
cially with an impressive R
2
of 0.89. The Transformer
model is successful and generalizable in capturing
complicated patterns and dependencies in KPI data,
as seen by its consistency across datasets. Given the
dataset’s properties, the LSTM model performs re-
markably well, as evidenced by its R
2
of 0.91, which
may indicate overfitting or a highly effective model.
All the results are reported in Table 3. As seen by
their lower performance measures, CNNs once again
seem less appropriate for certain forecasting jobs.
Due to the Transformer model’s attention mechanism,
which successfully captures long-range dependencies
and linkages within the data, the findings across all
three datasets consistently show the model’s high-
predicting skills. Not only can LSTM models perform
admirably, but their applicability in sequential data
processing is also demonstrated. But while the clas-
sic CNN and RNN models are well-known for their
Forecasting of Key Performance Indicators Based on Transformer Model
285
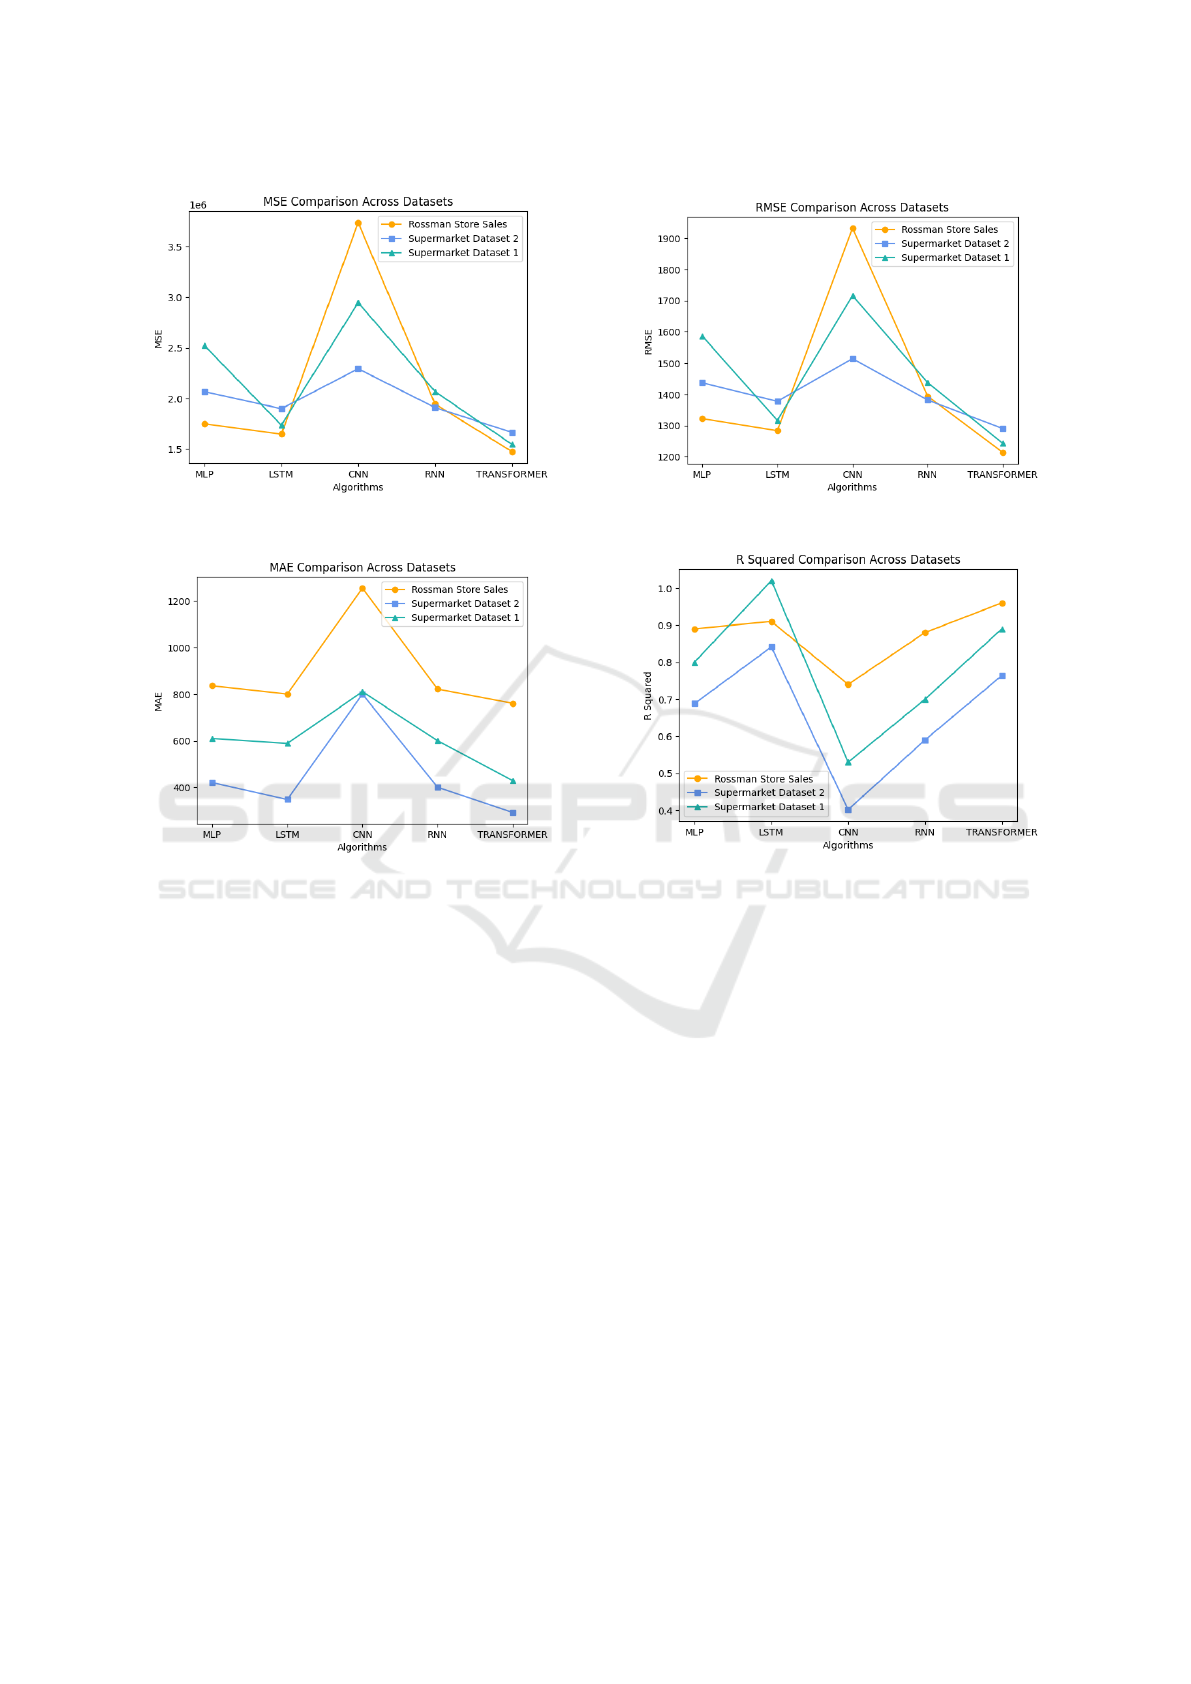
(a) MSE Evaluations (b) RMSE Evaluations
(c) MAE Evaluations (d) R
2
Evaluations
Figure 2: The evaluation results of different method over various evaluations metrics.
efficacy in other contexts, they seem to be less suc-
cessful in KPI forecasting. This is probably because
KPI data involves complex patterns and unique re-
quirements for recording temporal sequences. These
results imply that using advanced deep learning mod-
els, like Transformers, for KPI forecasting has a sub-
stantial benefit in terms of improved prediction ac-
curacy and a more nuanced comprehension of data
patterns. The ability to make good decisions and de-
velop strategic plans based on trustworthy projections
has significant ramifications for business intelligence.
The comparative study highlights the significance of
model selection in forecasting tasks and recommends
that the forecasting objectives and data characteristics
be carefully considered. Subsequent investigations
may examine hybrid models or more advancements
in deep learning architectures to further improve fore-
casting precision and dependability.
For the Supermarket Dataset 1, the MAE of the LSTM
(Long Short-Term Memory) model is much higher.
This might be a symptom of overfitting or a warning
that this specific dataset is not a good fit for this model
type, see Figure 2 for more detail. Better model accu-
racy is implied by lower MSE values, which are desir-
able. Because the MSE is squared in this case, mag-
nifying differences, the scale is significantly greater.
On Supermarket Dataset 1, the MLP and LSTM per-
form better, comparable to RMSE, but the RNN per-
forms rather poorly, the detail is reported in Figure 2.
With 1 denoting perfect prediction, higher R
2
values
are preferable. With R
2
values near 1, the MLP and
Transformer models obtained the best results, par-
ticularly when applied to the Rossmann Store Sales
dataset. On the Supermarket Dataset 1, the CNN and
RNN exhibit lower R
2
values, suggesting that they
may not be adequately capturing the variability of the
data.
6 CONCLUSION
In this research work, a variety of deep learning mod-
els were used to forecast Key Performance Indica-
tors (KPIs) and compared with the proposed trans-
ICEIS 2024 - 26th International Conference on Enterprise Information Systems
286

former learning model. Forecasting accuracy is sig-
nificantly higher with transformer models than with
other deep learning. One of their greatest advantages
is their capacity to handle non-linear interactions, rec-
ognize intricate patterns, and analyze vast and varied
datasets. This study’s comprehensive assessment of
deep learning models for KPI forecasting across a va-
riety of datasets highlights the Transformer model’s
exceptional performance. It achieves an R
2
of 0.96
for prediction accuracy. The accuracy of forecasts
is boosted to a new level by this model’s capacity to
represent detailed temporal interactions. On the other
hand, as seen by its lower R
2
values across datasets,
the CNN model had shortcomings in processing se-
quential data. To enhance the model’s comprehension
of affecting elements, future research may investigate
more complex transformer topologies for more accu-
rate KPI predictions. Additionally, other datasets may
be considered.
DECLARATIONS
This research has received funding from the
project Vitality – Project Code ECS00000041, CUP
I33C22001330007 - funded under the National Re-
covery and Resilience Plan (NRRP), Mission 4 Com-
ponent 2 Investment 1.5 - ’Creation and strengthen-
ing of innovation ecosystems,’ construction of ’ter-
ritorial leaders in R&D’ – Innovation Ecosystems -
Project ’Innovation, digitalization and sustainability
for the diffused economy in Central Italy – VITAL-
ITY’ Call for tender No. 3277 of 30/12/2021, and
Concession Decree No. 0001057.23-06-2022 of Ital-
ian Ministry of University funded by the European
Union – NextGenerationEU.
REFERENCES
Armaki, S. and Mohammed, K. A. (2023). Complex kpis
versus the usual benchmarks.
Bishop, C. (2006). Pattern recognition and machine learn-
ing. Springer google schola, 2:531–537.
Brownlee, J. (2018). Deep learning for time series forecast-
ing: predict the future with MLPs, CNNs and LSTMs
in Python. Machine Learning Mastery.
El Mazgualdi, C., Masrour, T., El Hassani, I., and Khdoudi,
A. (2021). Machine learning for kpis prediction:
a case study of the overall equipment effectiveness
within the automotive industry. Soft Computing,
25:2891–2909.
Emmert-Streib, F., Yang, Z., Feng, H., Tripathi, S., et al.
(2020). An introductory review of deep learning for
prediction models with big data. Frontiers in Artificial
Intelligence.
Goodfellow, I., Bengio, Y., and Courville, A. (2016). Deep
learning. MIT press.
Gupta, S., Nikolaou, M., Saputelli, L., and Bravo, C.
(2016). Esp health monitoring kpi: a real-time pre-
dictive analytics application. In SPE Intelligent En-
ergy International Conference and Exhibition, pages
SPE–181009. SPE.
Gurtner, G. and Cook, A. (2017). Understanding kpi trade-
offs-key challenges of modeling architectures and data
acquisition. In Data Science in Aviation 2017 Work-
shop.
Horv
´
athov
´
a, J., Mokri
ˇ
sov
´
a, M., Suh
´
anyiov
´
a, A., and
Suh
´
anyi, L. (2015). Selection of key performance
indicators of chosen industry and their application
in formation of creditworthy model. Procedia Eco-
nomics and Finance, 34:360–367.
Khan., T., Mircoli., A., Potena., D., and Diamantini., C.
(2023). Semantic representation of key performance
indicators categories for prioritization. In Proceedings
of the 25th International Conference on Enterprise In-
formation Systems - Volume 2: ICEIS, pages 142–151.
INSTICC, SciTePress.
Le, L.-V., Sinh, D., Tung, L.-P., and Lin, B.-S. P. (2018).
A practical model for traffic forecasting based on big
data, machine learning, and network kpis. In 2018
15th IEEE Annual Consumer Communications & Net-
working Conference (CCNC), pages 1–4. IEEE.
LeCun, Y., Bengio, Y., and Hinton, G. (2015). Deep learn-
ing. nature, 521(7553):436–444.
Pietukhov, R., Ahtamad, M., Faraji-Niri, M., and El-Said, T.
(2023). A hybrid forecasting model with logistic re-
gression and neural networks for improving key per-
formance indicators in supply chains. Supply Chain
Analytics, 4:100041.
Sun, Q. and Ge, Z. (2020). Deep learning for industrial
kpi prediction: When ensemble learning meets semi-
supervised data. IEEE Transactions on Industrial In-
formatics, 17(1):260–269.
Svensson, I., Saeverhagen, E., and Bouillouta, F. M. (2015).
Driving rig performance through real-time data anal-
ysis, benchmarking, dashboards, and developed key
performance indicators. In SPE digital energy confer-
ence and exhibition, page D021S011R002. SPE.
Tadayonrad, Y. and Ndiaye, A. B. (2023). A new key
performance indicator model for demand forecasting
in inventory management considering supply chain
reliability and seasonality. Supply Chain Analytics,
3:100026.
Tsai, Y.-C. and Cheng, Y.-T. (2012). Analyzing key perfor-
mance indicators (kpis) for e-commerce and internet
marketing of elderly products: A review. Archives of
gerontology and geriatrics, 55(1):126–132.
Zhang, T., Liu, S., Qiu, W., Lin, Z., Zhu, L., Zhao, D., Qian,
M., and Yang, L. (2020). Kpi-based real-time situa-
tional awareness for power systems with a high pro-
portion of renewable energy sources. CSEE Journal
of Power and Energy Systems, 8(4):1060–1073.
Forecasting of Key Performance Indicators Based on Transformer Model
287
