
Operator Fatigue Detection via Analysis of Physiological Indicators
Estimated Using Computer Vision
Nikolay Shilov
a
, Walaa Othman
b
and Batol Hamoud
c
SPC RAS, 14 Line 39, St.Petersburg, Russia
Keywords:
Operator, Fatigue Detection, Computer Vision, Physiological Indicator, Machine Learning.
Abstract:
The complexity of technical systems today causes an increased cognitive load on their operators. Taking
into account that the cost of the operator’s error can be high, it is reasonable to dynamically monitor the
operator to detect possible fatigue state. Application of computer vision technologies can be beneficial for this
purpose since they do not require any interaction with the operator and use already existing equipment such
as cameras. The goal of the presented research is to analyze the possibility to detect the fatigue based on the
physiological indicators obtained using computer vision. The analysis includes finding correlations between
the physiological indicators and the fatigue state as well as comparing different machine learning models to
identify the most promising ones.
1 INTRODUCTION
Today, the complexity of technical systems (for ex-
ample, industrial robotic complexes, physical and/or
chemical process installations; systems consisting of
multiple objects performing coordinated actions, etc.)
has significantly increased. This, in turn, leads to
an increased cognitive load on the operators control-
ling such systems: they have to continuously analyze
numerous system performance indicators and timely
make decisions aimed at adjusting system’s operation
mode), and consequently, increased fatigue. At the
same time, the cost of operator error can be very high
(Xie et al., 2024; Rogers et al., 2023).
To reduce the probability of errors, nowadays, op-
erators undergo regular medical examinations, and
their continuous working time is strictly regulated.
However, these measures are not adaptive and can-
not guarantee the operator’s performance throughout
the entire shift or a predetermined period of working
time. Continuous monitoring of the operator’s condi-
tion using medical devices is also not a feasible solu-
tion to this problem, as their permanent usage can be
inconvenient and providing each operator with such
devices can be expensive. On the other hand, video
surveillance systems are currently widespread. There-
a
https://orcid.org/0000-0002-9264-9127
b
https://orcid.org/0000-0002-8581-1333
c
https://orcid.org/0000-0002-8568-7440
fore, the possibility of using video surveillance data to
detect the operator’s fatigue is a relevant issue.
The efficient usage of the available (mostly, large)
data is a global challenge, as evidenced by the popu-
larity of research in this field worldwide. Due to sig-
nificant development in information technology, ma-
chine learning methods based, for example, on deep
neural networks, have made a substantial qualitative
leap in the last few years. There already exist many
methods and models for fairly accurate assessment of
physiological indicators of a person based on video
recordings (for example, using photoplethysmogra-
phy methods), e.g., (Othman et al., 2022; Hamoud
et al., 2023a). The presented research aims to ana-
lyze a possibility of detecting the operator’s fatigue
based on primary physiological indicators identified
via computer vision. The complexity of this problem
is mainly related to the fact that the specified depen-
dency can be significantly affected by the noise and
distortions that occur when collecting data using com-
puter vision systems, compared to the data obtained
using special medical devices.
The paper is structured as follows. The next sec-
tion presents the state of the art analysis in the areas
of computer vision-based estimation of physiological
indicators and fatigue detection. It is followed by the
research methodology. Section 4 describes the dataset
used. The experiment description and its results are
presented in Section 5. Concluding remarks and fu-
ture work are given in the Conclusions section.
422
Shilov, N., Othman, W. and Hamoud, B.
Operator Fatigue Detection via Analysis of Physiological Indicators Estimated Using Computer Vision.
DOI: 10.5220/0012730500003690
Paper published under CC license (CC BY-NC-ND 4.0)
In Proceedings of the 26th International Conference on Enterprise Information Systems (ICEIS 2024) - Volume 2, pages 422-432
ISBN: 978-989-758-692-7; ISSN: 2184-4992
Proceedings Copyright © 2024 by SCITEPRESS – Science and Technology Publications, Lda.

2 RELATED WORK
The section discusses the state of the art in the areas of
fatigue detection, detection of various physiological
indicators based on computer vision technologies and
their relation to the fatigued state.
2.1 Fatigue
The majority of fatigue definitions seem to concep-
tualize the fatigue as a complex phenomenon, in-
corporating various characteristic descriptions such
as heightened discomfort alongside diminished work
capacity, reduced responsiveness to stimulation, and
typically accompanied by sensations of weariness and
tiredness (Rudari et al., 2016; Hu and Lodewijks,
2020). Moreover, researchers generally define men-
tal fatigue as a gradual and cumulative process as-
sociated with a general sense of weariness, a lack of
motivation, inhibition, impaired mental performance,
reduced efficiency, and decreased alertness (Borghini
et al., 2014). However, based on the literature, mental
fatigue is characterized by a stable state over longer
periods and is more closely related to a psychobio-
logical state (Luo et al., 2020; Borghini et al., 2014).
The fatigue is associated with many physiological in-
dicators and signs (Argyle et al., 2021), hence many
researchers put forth to study these relationships and
investigate the changes that occur when individuals
are exposed to mentally demanding tasks as we men-
tion in detail in section 2.3.
2.2 Physiological Indicator Estimation
Based on Computer Vision
Based on the literature analysis the following physio-
logical indicators that can indicate the fatigued state
have been identified: respiratory rate, heart rate,
blood pressure, blood oxygen saturation, head pose
and the state of the mouth and eyes.
A photoplethysmography (PPG) - based approach
to respiratory rate detection was presented in (Fiedler
et al., 2020). The algorithm first applied detection of
the region of interest (forehead and the face skin) and
extracted the PPG signal from it. Then, it applied a
number of signal processing techniques to eliminate
noise and artifacts to get the respiratory-related body
skin color changes. The method presented in the pa-
per (Scebba et al., 2021) applied multi-spectral data
fusion (using recordings from far-infrared and near-
infrared cameras). Instead of PPG signal it analyzed
thermal airflow in the nostrils region and respiratory-
related motions in the chest region. The authors of
the paper (Othman et al., 2022) applied optical flow
analysis to detect the driver’s respiratory rate even in
moving vehicles.
Detection of blood-related indicators (heart rate,
blood pressure, and blood oxygen saturation) from
video are implemented based on remote PPG (rPPG).
The heart rate detection is mostly done using principal
component analysis or deep neural networks. The lat-
ter achieve better results with the mean average error
of 6-7 beats per minute (Revanur et al., 2022; Othman
and Kashevnik, 2022).
Several approaches put forth for the use of rPPG
in the remote estimation of continuous blood pres-
sure. rPPG depends on the ability to capture the nat-
ural light reflection from human skin, which may be
done with a standard webcam or a smartphone cam-
era. For instance, (Jain et al., 2016) analyzed fluctu-
ations in blood flow beneath the skin using principal
component analysis (PCA) as captured by changes in
the red channel intensity of facial video. The authors
were able to extract data for both the temporal and
frequency domains after using bandpass filter to de-
noise the obtained signal which they used to create
a linear regression model that predicted the systolic
and diastolic blood pressure. In another study, the
filtered signals by moving average and band-pass fil-
tering obtained from three channels derived from five
areas of interest (ROIs) were processed using inde-
pendent component analysis (ICA), which increased
the accuracy of estimations produced by a linear re-
gression model (Oiwa et al., 2018).On the other hand,
(Luo et al., 2019) extract fluctuations in blood circula-
tion under the facial skin from 17 different regions of
interest (ROIs). They applied a method called Trans-
dermal Optical Imaging (TOI), which utilizes sophis-
ticated machine learning algorithms to process the ob-
tained fluctuation. The privilege of using TOI is the
robustness of this method against the noise. Addi-
tionally, (Slapni
ˇ
car et al., 2019) introduced a novel
approach using multiple neural network architectures
to estimate blood pressure values such as AlexNet,
Resnet and LSTM. Prior to feeding the signals into
the network, the signals obtained using the plane-
orthogonal-to-skin (POS) algorithm were processed
and filtered based on the signal-to-noise ratio (SNR).
Another method for contactless assessing of blood
pressure is what(Wu et al., 2022) proposed. They
used a chrominance-based rPPG extraction algorithm
to obtain two-channel rPPG signals by dividing the
face into upper and lower parts and feed them into an
encoder-decoder architecture backbone model since
the symmetric skip connection in the model prevents
the loss of waveform features as the model’s depth in-
creases. This is important for effectively filtering out
noise and interference present in the rPPG signals. Fi-
Operator Fatigue Detection via Analysis of Physiological Indicators Estimated Using Computer Vision
423

nally, (Hamoud et al., 2023a) introduced a novel ap-
proach using hybrid deep learning models consisted
of CNN followed by LSTM to learn how the changes
in the intensities throughout the recording duration
lead to estimate systolic and diastolic blood pressure.
Numerous researchers have been working on de-
veloping contact-less methods for assessing oxygen
saturation (SpO2). They proposed a variety of inno-
vative and creative techniques, such as using machine
learning methods or analyzing the obtained PPG sig-
nal. For example, (Akamatsu et al., 2023) presented
an approach that uses convolutional neural networks
(CNN) and the DC and AC components of the spatio-
temporal map to estimate SpO2 from face videos.
(Ding et al., 2019) proposed another CNN implemen-
tation. They used a 1D CNN and used participant
finger recordings. To extract PPG signals, they av-
eraged the pixel values from potential regions of in-
terest (ROIs) in the RGB frames and enhanced the
signal’s resilience against large irregularities in mo-
tion using a modified Singular Value Decomposition
(SVD) technique. In (Al-Zyoud et al., 2022), the heart
rate (HR), breathing rate (BR), and SpO2 were evalu-
ated using an innovative approach. In order to get raw
time-series bio-signal data, they gathered bio-signal
data data from the green channel of facial videos. Af-
terwards, the three different machine learning models
Multilayer Perceptron Algorithm (MPA), Long Short-
Term Memory Algorithm (LSTM), and Extreme Gra-
dient Boosting Algorithm (XGBoost) were used to
evaluate the aforementioned vital indicators by ana-
lyzing the obtained data. Moreover, the authors of
(Mathew et al., 2022) proposed a method to estimate
SpO2 using deep learning models and acquired PPG
signals from videos of the palm or back side of the
hand. They developed three distinct models with dif-
ferent architectures. Their models had a combination
of channel combination layers to mix the color chan-
nels, convolutional and max pooling layers to extract
time-related features. Lastly,(Hamoud et al., 2023b)
proposed an approach that involves pre-trained con-
volutional neural network (CNN) models to extract
features from consecutive images of different regions
of interest (ROI). These features are then used to train
an XGBoost Regressor model, which predicts SpO2
for three different test sets.
There are several approaches to head pose esti-
mation based on the image analysis (computer vision
technologies). First is landmark-based. The methods
implementing this approach include Dlib (Kazemi
and Sullivan, 2014), FAN (Bulat and Tzimiropoulos,
2017), and Landmarks (Ruiz et al., 2018). The main
issue related to this approach is the limited angle (at
large angles many landmarks become undetectable).
Another approach is geometry-based (e.g., 3DDFA
(Zhu et al., 2016)). SSR-Net-MD (Yang et al., 2018)
and FSA-Caps(1x1) (Yang et al., 2019), CNN-MTL
framework (Ranjan et al., 2017) are based on the clas-
sification neural network-based methods. Other types
of approaches are still being developed as well (e.g.,
HR-AT (Hu et al., 2021) based on Bernoulli heatmap).
The methods currently achieve the MSE lower than 4
degrees.
Mouth openness detection is usually based on
landmark identification by various techniques and fur-
ther analysis. Landmark detection is done by var-
ious algorithms, such as Viola-Jones, Support Vec-
tor Machine (SVM), various neural network models
(e.g., (Gupta et al., 2021)). However, in the context
of fatigue analysis, the researchers have been tending
to evaluate yawning instead of just mouth opening.
This made it possible to use different detection mod-
els aimed at analyzing videos (image sequences) in-
stead of separate images. Such models include RNN,
LSTM, Bi-LSTM, and others achieving accuracy of
more than 96%, which however drops when the sub-
ject is talking or singing (Yang et al., 2020; Saurav
et al., 2019). SVM was also used for yawning classi-
fication task for fatigue analysis and achieved an ac-
curacy of 81% (Sarada Devi and Bajaj, 2008).
One more fatigue sign is closing eyes. PER-
CLOSE (percentage of eyelid closure) is a widely
used indicator of both fatigue and drowsiness. The
eye state (open or close) is detected quite well, so the
most research efforts are aiming at improving the fa-
tigue or drowsiness detection based on known PER-
CLOSE value (Ravindran et al., 2022; Jiang et al.,
2022). However, it seems to be more interesting to an-
alyze the eye aspect rate instead of just if it is open or
close. This is done using landmark detection followed
by aspect rate measurement (Dewi et al., 2022a; Dewi
et al., 2022b). Another focus on the aspect rate mea-
surement can be found in (Islam et al., 2019) where
the authors employed the Viola-Jones approach for
facial detection in order to accurately locate the right
eye. They obtained six coordinates representing the
eye by traversing the eye region clockwise starting
from the left corner. Subsequently, they utilized an
equation proposed by (Soukupov
´
a and Cech, 2016)
to compute the eye aspect ratio (EAR) and used the
aspect ratio threshold of 0.3 in their system.
2.3 Usage of Physiological Indicators
for Fatigue Detection
Head movement, nodding, and abrupt shifts in head
position were studied in the realm of fatigue analysis
(Kamran et al., 2019). Several research articles have
ICEIS 2024 - 26th International Conference on Enterprise Information Systems
424

proposed real-time driver fatigue monitoring systems
using Multi-Task ConNN as the basic architecture.
For instance, (Savas¸ and Becerikli, 2020) and (Liu
et al., 2017) used this approach and obtained decent
accuracy in detecting driver fatigue. Furthermore, (Ye
et al., 2021) developed an innovative driver fatigue
detection system that incorporates the residual chan-
nel attention network (RCAN) with head posture esti-
mation. The system uses Retinaface to localize faces
and records five facial landmarks. The RCAN is then
used to precisely classify the condition of the driver’s
eyes and mouth. The RCAN has a channel atten-
tion module that dynamically collects essential fea-
ture vectors from the feature map, improving the sys-
tem’s classification accuracy. (Savas¸ and Becerikli,
2020) focused on assessing eye and mouth features,
whereas (Liu et al., 2017) used multitask cascaded
convolutional networks for face detection, alignment,
and fatigue detection.
Ocular characteristics such pupil diameter, blink-
ing rate, saccade distance, and velocity are often used
to diagnose fatigue and drowsiness (Zhao et al., 2023;
Hu and Lodewijks, 2020). The aforementioned in-
dicators have emerged as possible indicators for ob-
jectively assessing drowsiness and fatigue, provid-
ing non-invasive and continuous monitoring capabil-
ities in real-world operating settings. According to
the literature, increased cognitive workload results
in larger pupil size, higher blink rates, and reduced
mean relative fixation time (Kashevnik et al., 2021b).
Analogous findings were derived from the analysis
conducted by (Zhao et al., 2023), wherein the re-
searchers observed a remarkable 91% augmentation
in pupil diameter, coupled with a significant reduction
of approximately 31.31% in the percentage of fixation
time. Additionally, there was a notable decline of ap-
proximately 40% in saccade distance. Besides, there
is also a positive significant correlation between men-
tal fatigue (workload) and blinking rate (Sampei et al.,
2016).
Heart rate variability (HRV) is a commonly ref-
erenced metric in the analysis of mental fatigue.
Numerous studies have centered their attention on
the alterations that occur within the sympathetic and
parasympathetic systems during the performance of
intellectually demanding activities. These changes
are discernible through the variations observed in the
low frequency and high-frequency oscillations (LF
and HF, respectively) (Matuz et al., 2021; Tanaka
et al., 2015; Kamran et al., 2019). In the pursuit of de-
tecting fatigue, some researchers have adopted a mul-
timodal approach that combines heart rate variability
(HRV) indices with other indicators, including ocular
measures. For instance, (Qin et al., 2021) utilized the
Toeplitz Inverse Covariance-Based Clustering (TICC)
method (Hallac et al., 2017) to label their data based
on various conventional HRV indices (such as LF,
LF/HF ratio, HF, and standard deviation of R–R inter-
vals (SDNN)) in addition to eye metrics like blinking
rate and pupil dilation. Through analysis of the ob-
tained clusters, the researchers concluded that LF and
LF/HF exhibited an increase, while HF experienced
a decrease during exposure to cognitively demand-
ing tasks. Furthermore, a notable increase in blink
rate (BR) was observed. The findings presented by
(Mizuno et al., 2011) align with the aforementioned
observations, as they showed decreased levels of HF
power and an increased LF/HF ratio following the fa-
tigue session when compared to the values recorded
after the relaxation session. Moreover, their study re-
vealed a positive correlation between the LF/HF ra-
tio and the visual analogue scale for assessing fatigue
severity (VAS-F) values.
Physiological indicators, including vital signs
such as respiration rate, blood pressure, and heart
rate, have been utilized in the analysis and detec-
tion of fatigue. For example, in a study conducted
by (Luo et al., 2020), features pertaining to heart
and respiratory rates were employed to train classi-
fiers for the purpose of detecting both physical and
mental fatigue. The authors employed Random For-
est (Louppe, 2015) and casual Convolutional Neural
Network (cCNN) (Franceschi et al., 2020) for this
task. Similarly, other researchers observed notewor-
thy distinctions in the respiration rate and blood pres-
sure of labor employees after subjecting them to tasks
designed to induce a hypnotic state of fatigue (Meng
et al., 2014). Specifically, the blood pressure showed
a significant increasing trend following fatigue, while
the respiration rate exhibited a decrease. These find-
ings align with (Kamran et al., 2019), who mentioned
that drowsy and fatigued subjects show low breathing
pattern frequency.
In summarizing the noteworthy discoveries per-
taining to the physiological alterations experienced
by individuals following engagement in mentally de-
manding activities, it can be inferred that the activa-
tion of the sympathetic nervous system is evidenced
by the elevation in LF and the LF/HF ratio, associated
with a reduction in HF power. Regarding the oculo-
metrics, individuals experiencing fatigue exhibit in-
creased blink frequency, expanded pupil diameter, el-
evated eye closure ratio, and diminished saccadic dis-
tance and velocity. In terms of vital signs, the state
of fatigue is characterized by a deceleration in respi-
ratory rate and an elevation in blood pressure. More-
over, tired people have a tendency to open their jaws
and nod their heads more frequently than their healthy
Operator Fatigue Detection via Analysis of Physiological Indicators Estimated Using Computer Vision
425

and energetic counterparts. However, number of the
above mentioned indicators cannot be estimated us-
ing computer vision. As a result, it can be concluded
that operator fatigue detection using physiological in-
dicators obtained via computer vision is potentially
possible and of interest.
3 THE METHODOLOGY
The methodology used for the presented research is
as follows (Fig. 1). After the state of the art anal-
ysis a dataset was selected (sec. 4), which provides
videos of computer users in different fatigue condi-
tions performing actions with different cognitive load
what makes it possible to consider them as PC opera-
tors. The dataset is already annotated with physiolog-
ical indicators evaluated using computer vision.
As the objective fatigue indicator (the ground
truth) the correction test “Landolt rings” was selected
(Landolt, 1888). This is a test used for measuring vi-
sual acuity. It is based on a number of ’C’-shaped
rings rotated at different angles (8 in total). Partic-
ipant has to select all the rings rotated in the given
angle. The selection process is analyzed using sev-
eral primary indicators, and a number of indicators
are calculated based on the primary ones. The ’Men-
tal performance’ indicator was considered as one cor-
responding to the fatigue.
Then, the correlation analysis between the opera-
tor’s fatigue state and available physiological indica-
tors is carried out to have a common understanding
which of the indicators can serve as a significant fea-
ture for the fatigue state detection.
Finally, several machine learning models aimed at
prediction of the fatigue state based on the available
physiological indicators obtained using computer vi-
sion techniques are built and compared.
4 THE DATASET
In the carried out experiments, the OperatorEYEVP
dataset as introduced by (Kovalenko et al., 2023) has
been employed. This dataset provides recordings of
ten distinct participants engaged in various activities,
which were captured three times a day (in the morn-
ing, afternoon, and evening) over a duration of eight
to ten days. In addition to the video footage captur-
ing the frontal perspective of the participants’ faces,
the experimental configuration recorded supplemen-
tary data, including eye movement, head movement,
scene imagery, heart rate (in terms of pulse per inter-
val), choice reaction time (measured twice), as well as
responses to questionnaires and scales (VAS-F). The
VAS-F scale comprises a set of 18 inquiries pertaining
to the subjective experience of fatigue, which partici-
pants complete before the experimental session starts.
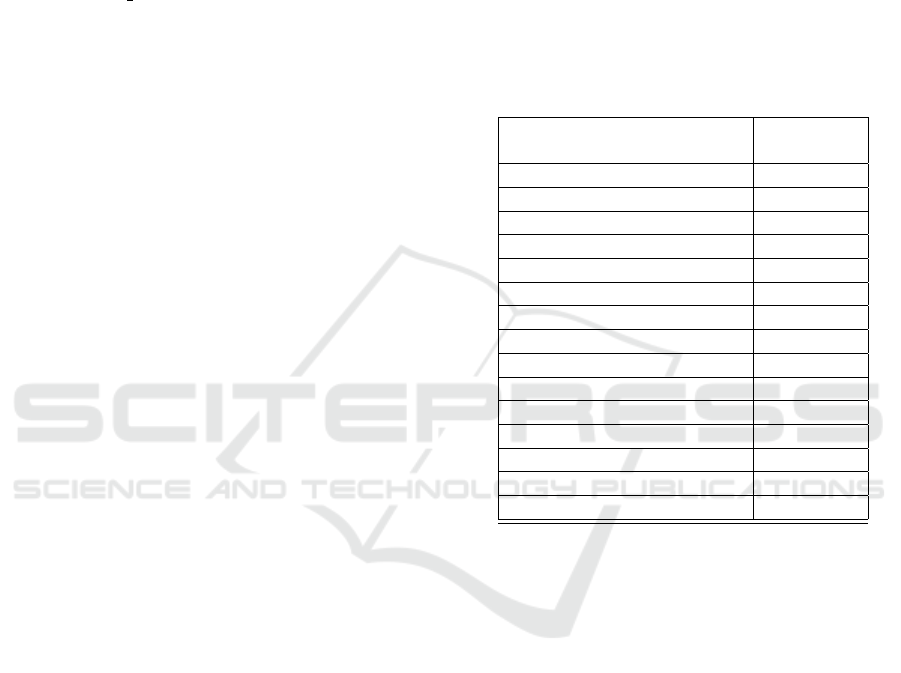
The experimental session comprised several com-
ponents, including a sleep quality questionnaire con-
ducted once a day in before the morning session, fol-
lowed by the VAS-F questionnaire, a choice reaction
time task (CRT), reading a scientific-style text, per-
forming the correction test ”Landolt ring”, playing
”Tetris” game, and another choice reaction time task
(CRT) based on the authors decision due to the fact
that the operator’s level of fatigue may vary between
the commencement and conclusion of the recording
session. The timeline of the session is shown in Fig.
2. On average, the total duration of such recording
sessions amounted to approximately one hour.
Throughout the CRT registration, a comprehen-
sive set of parameters were meticulously recorded and
analyzed. These parameters included the average re-
action time, its standard deviation, and the quantifica-
tion of errors made by participants during the execu-
tion of the task.
Participants were instructed to engage in the read-
ing of scientific-style text to simulate typical work-
related activities. This activity functioned as a control
condition and a load static task, designed to assess
cognitive performance.
The correction test ”Landolt rings” is a recognized
method for evaluating visual acuity. Several parame-
ters were recorded during the test that enabled cal-
culating various indicators, such as attention produc-
tivity, work accuracy, stability of attention concentra-
tion, mental performance coefficient and processing
speed.
Tetris game was utilized as a load dynamic ac-
tive task and control condition to investigate hand-eye
coordination. Participants were instructed to achieve
their best performance within a 15-minute timeframe.
The recorded variables included the number of games
played, scores achieved, levels reached, and lines
cleared.
For the presented here experiment, 365 videos
from the OperatorEYEVP dataset have been utilized
featuring three distinct participants with a combined
duration of 1913 minutes. For every minute of these
videos, the four essential vital signs have been com-
puted based on the computer vision techniques: blood
pressure, heart rate, oxygen saturation, and respira-
tory rate. Additionally, other indicators have been
computed as well, such as head pose estimated by Eu-
ler angles (roll, pitch, yaw), the ratio of frames where
any Euler angle exceeds 30 degrees over the total
frames in one minute, eye closure ratio, mouth open-
ICEIS 2024 - 26th International Conference on Enterprise Information Systems
426
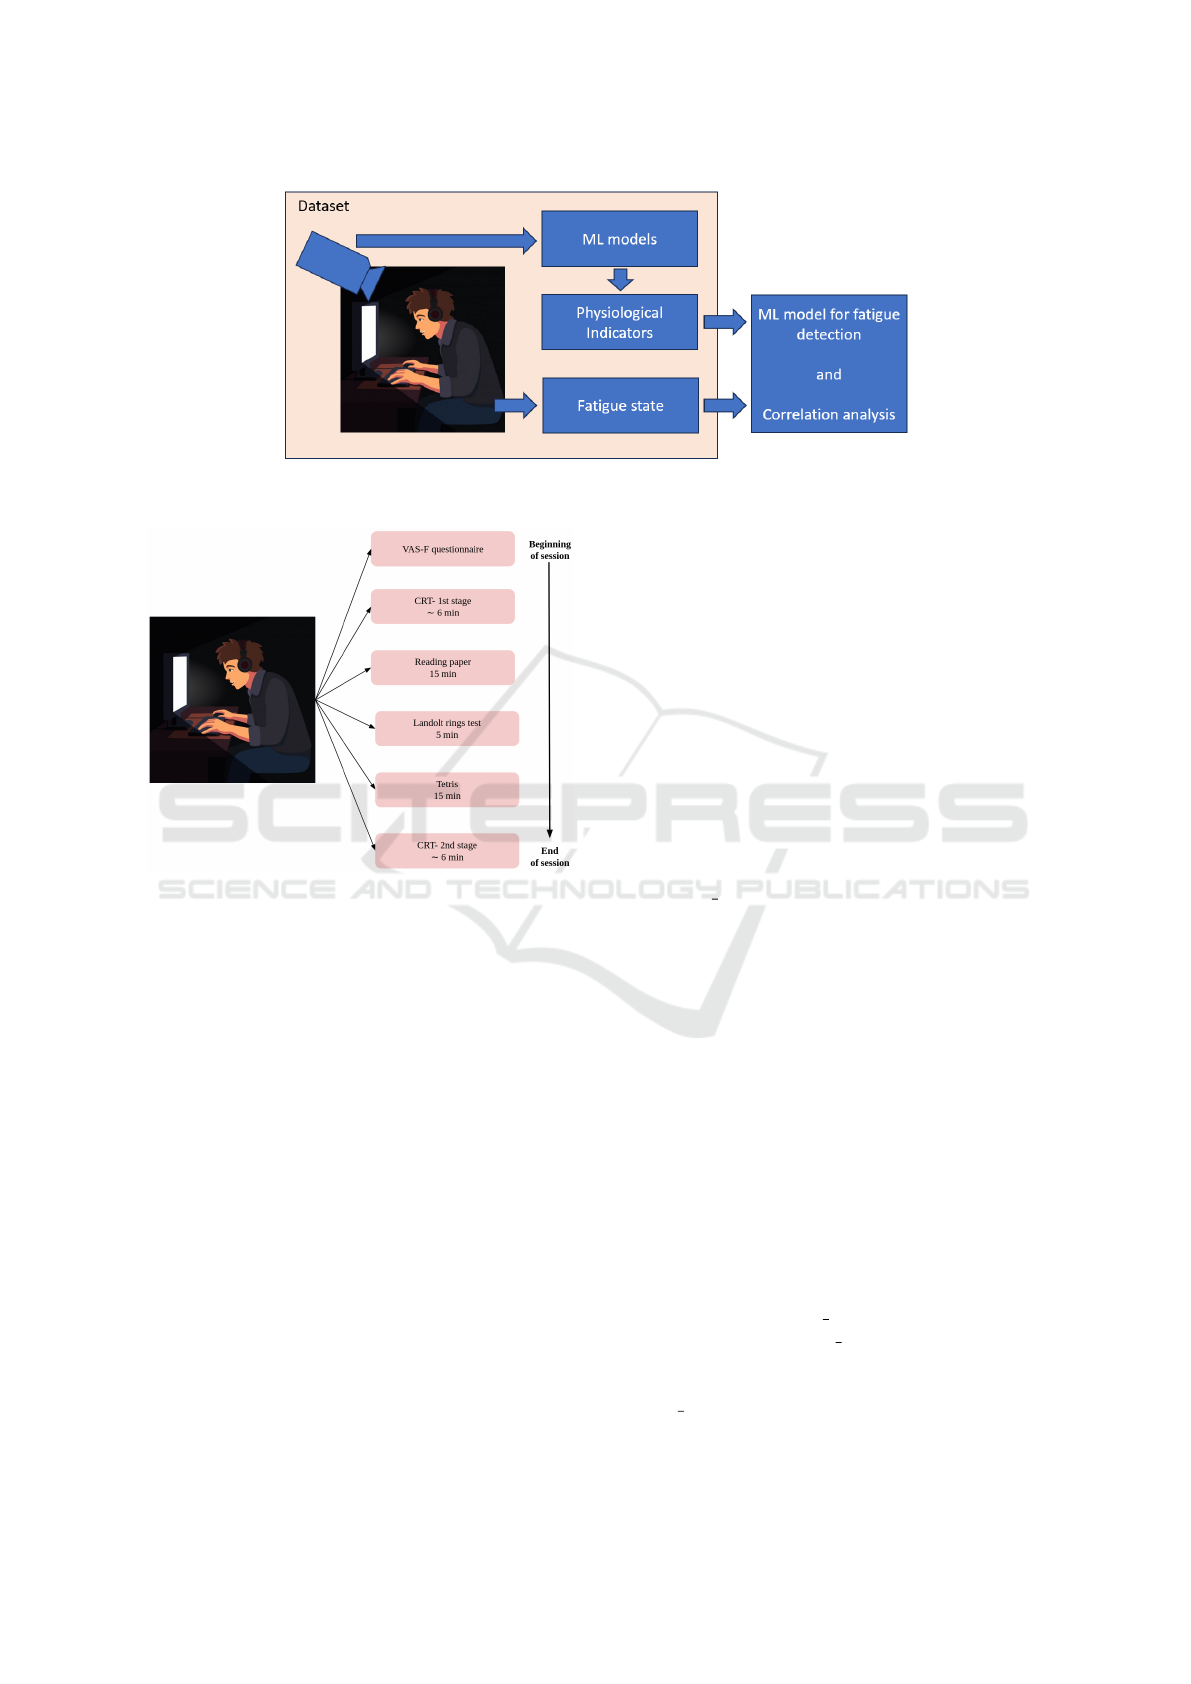
Figure 1: The methodology for operator fatigue detection via analysis of physiological indicators estimated using computer
vision.
Figure 2: Timeline of one session.
ness ratio, number of yawns, duration of eye closures
exceeding two seconds, and breathing characteristics,
including rhythmicity and stability. The techniques
employed for calculating these indicators are detailed
in section 5.1.
5 THE EXPERIMENT AND
RESULTS
5.1 Computer Vision Models Used to
Extract the Physiological Indicators
Within this subsection, we provide an overview of
the models employed for extracting physiological fea-
tures crucial in estimating the fatigue state:
1. Respiratory Rate and Breathing Characteristics:
To estimate the respiratory rate, the methodol-
ogy proposed by (Othman et al., 2022) was used,
involving the following steps: (a) Detection of
the chest keypoint using OpenPose. (b) Utiliza-
tion of an Optical Flow-based Neural Network
(SelFlow) to detect chest point displacement be-
tween frames. (c) Projection of x and y axes
displacement, separating movement into up/down
and left/right directions. (d) Signal processing in-
volving filtering and detrending. (e) Calculation
of true peak count, scaled to estimate breaths per
minute. Additionally, breathing characteristics,
such as stability and rhythmicity, were determined
based on the amplitude and wavelength of the res-
piratory wave
2. Heart Rate: For heart rate estimation, the
approach proposed by (Othman et al., 2024)
was used.First, the Region of Interest (Face)
was extracted using landmarks obtained from
3DDFA V2. The extracted region was then pro-
cessed through a Vision Transformer with multi-
skip connections, producing features from five
levels. Output from each level was passed through
a block comprising a BiLSTM layer, batch nor-
malization, 1D convolution, and a fully connected
layer. The five block outputs were averaged to ob-
tain minimum, maximum, and mean heart rate,
which were then weighted averaged to estimate
the final heart rate.
3. Blood Pressure Estimation: To estimate the blood
pressure,the approach proposed by (Hamoud
et al., 2023a) was adopted. Firstly, the Regions of
Interest including the left and right cheeks were
extracted in each frame of every video. These
sequential images are then input into a convo-
lutional neural network to capture spatial fea-
tures. Specifically, for systolic blood pressure es-
timation, EfficientNet B3 was utilized for the left
cheek, and EfficientNet B5 for the right cheek. In
contrast, for diastolic blood pressure, an ensem-
ble approach was adopted, combining Efficient-
Net B3 and ResNet50V2 for the left cheek, and a
similar combination for the right cheek. The re-
Operator Fatigue Detection via Analysis of Physiological Indicators Estimated Using Computer Vision
427
sulting outputs are subsequently fed into a Long
Short-Term Memory network to extract temporal
features within the image sequence. Finally, two
fully connected layers are employed to derive the
blood pressure values.
4. Oxygen Saturation Estimation: Oxygen satura-
tion was estimated based on (Hamoud et al.,
2023b), the face region was first extracted us-
ing 3DDFA V2. Subsequently, the extracted face
was input into VGG19 with pre-trained ImageNet
weights. The resulting output from VGG19 was
then fed into XGBoost to obtain the oxygen satu-
ration value.
5. Head Pose Estimation: The head pose, defined
by Euler angles (roll, pitch, and yaw), is deter-
mined using the methodology outlined in (Ka-
shevnik et al., 2021a). Initially, YOLO tiny is
employed to detect the face. Subsequently, a 3D
face reconstruction is applied to align facial land-
marks, even those not directly visible to the cam-
era. Once facial landmarks are detected, Euler
angles are calculated by analyzing the transitions
and rotations between landmarks across succes-
sive frames.
6. Eye Closure: The eye state is determined using a
trained model. This model takes the detected face,
as identified by FaceBoxes, as input and provides
an output indicating whether the eyes are open or
closed.
7. Yawning: The yawning state is identified using
a modified version of MobileNet, proposed by
(Hasan and Kashevnik, 2021).
5.2 Fatigue Detection Based on the
Physiological Indicators
This subsection presents details about the dataset,
which includes physiological indicators extracted
through the computer vision techniques discussed in
subsection 5.1. This encompasses information such
as the distribution of fatigue states and the corre-
lations between these indicators and fatigue levels.
Then, the models employed for fatigue evaluation are
introduced and their their performance is evaluated to
identify the most effective model.
5.2.1 Data Exploration and Balancing
As previously stated, the dataset encompasses 15 in-
dicators, including respiratory rate, rhythmicity and
stability of breathing, eye closure ratio, mouth open-
ness ratio, head Euler angles (Roll, Pitch, Yaw), the
ratio of frames where any Euler angle exceeds 30 de-
grees relative to the total frames in one minute (angles
> 30), the count of eye closures lasting more than
2 seconds (count of eye closure > 2 sec), count of
yawns, heart rate, systolic and diastolic blood pres-
sure, and blood oxygen saturation. To assess the rela-
tionship between physiological indicators and the fa-
tigue state, we firstly found the correlation between
the two. This involved calculating the correlation co-
efficient for each indicator with the fatigue state, as
presented in Table 1 .
Table 1: The correlation between the physiological indica-
tors and the fatigue state.
Physiological Correlation
indicator coefficient
Head: average Roll 0.228
Head: average Pitch 0.211
Mouth openness ratio 0.198
Eye closure ratio 0.195
Blood oxygen saturation 0.175
Count of eye closure > 2 sec 0.147
Heart rate 0.087
Angles > 30 0.072
Head: average Yaw 0.056
Diastolic blood pressure 0.025
Breathing stability 0.014
Count of yawns 0.012
Average respiratory rate 0.011
Systolic blood pressure 0.002
Breathing rhythmicity 0.001
Furthermore, the distribution of the fatigue state in
the dataset has been investigated to avoid biasing over
the majority class and ensure a more balanced repre-
sentation, which is essential for robust model train-
ing and accurate predictions. As illustrated in Fig.
3, the dataset demonstrates an imbalance between the
not fatigued (class 0) and fatigued (class 1) categories,
where the not fatigued class comprises a larger num-
ber of samples than the fatigued class.
To address the issue of class imbalance in the ma-
chine learning dataset, the Synthetic Minority Over-
sampling Technique (SMOTE) has been employed.
This method involves identifying instances belong-
ing to the minority class, which is underrepresented,
and generating synthetic samples to balance the class
distribution. The process entails randomly select-
ing a minority class instance, identifying its k-nearest
neighbors (in the experiment described the k was cho-
sen to be 5), and creating synthetic instances through
linear interpolation between the selected instance and
its neighbors. This procedure is repeated until the
desired balance between the minority and majority
ICEIS 2024 - 26th International Conference on Enterprise Information Systems
428
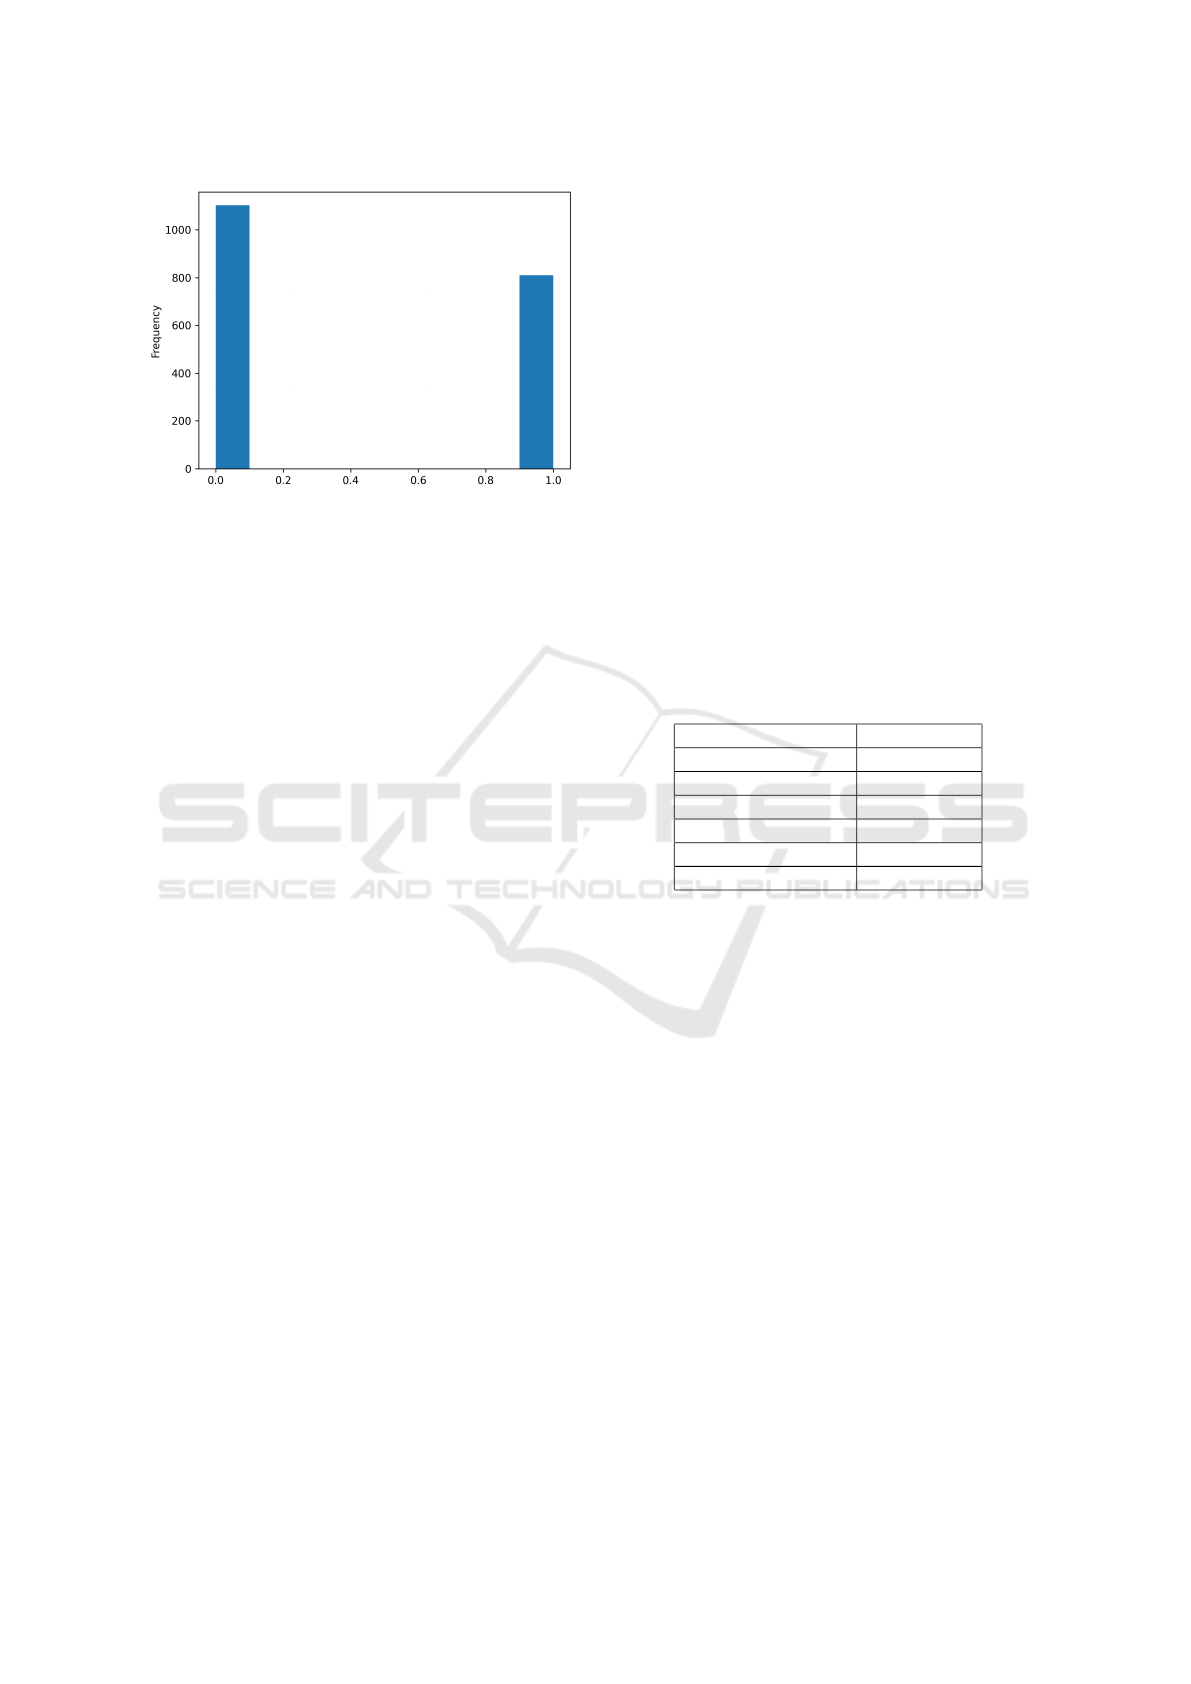
Figure 3: The distribution of the fatigue state.
classes is achieved. The aim of applying the SMOTE
is to mitigate the bias and enhance the model’s abil-
ity to generalize to both classes in a more equitable
manner.
5.2.2 Machine Learning Based Models for
Operator Fatigue Detection
To identify the operator fatigue based on extracted
physiological indicators, various machine learning
techniques have been employed. More specifically,
the analyzed machine learning techniques include:
1. Support Vector Classifier (SVC): SVC is a su-
pervised learning algorithm used for classification
tasks. It works by finding the optimal hyperplane
that best separates different classes in the feature
space.
2. Logistic Regression: Logistic Regression is a re-
gression analysis method that is adapted for bi-
nary classification. It models the probability of
the occurrence of a binary event through a logistic
function.
3. Decision Tree: Decision Trees are tree-like mod-
els where each internal node represents a deci-
sion based on a feature, and each leaf node rep-
resents the predicted outcome. They are versatile
and easy to interpret.
4. XGBoost: XGBoost is an efficient and scalable
implementation of gradient boosting. It is an en-
semble learning method that combines the predic-
tions from multiple weak models (typically deci-
sion trees) to improve overall accuracy.
5. RandomForest: RandomForest is an ensemble
learning technique that constructs a multitude of
decision trees during training and outputs the
mode of the classes for classification tasks.
6. Multi-layer Perceptron (MLP): a neural network
with several layers of neurons (three linear layers
in this particular experiment).
By employing this diverse set of machine learning
techniques, it is aimed to evaluate and compare their
performance in order to find the best model to detect
the operator fatigue based on the physiological indi-
cators identified using computer vision techniques.
5.2.3 Implementation Details and Results
The dataset was split into the training set (80%) and
testing set (20%). The Logistic Regression utilized
the lbfgs solver with a maximum iteration set to 1000.
Random Forest was configured with 100 estimators.
The neural network architecture comprised three lay-
ers: the first layer had 64 neurons with the ReLU
activation function, the second had 32 neurons with
ReLU activation, and the final layer had 1 neuron with
a sigmoid activation function. Binary cross-entropy
was employed as the loss function during training. Ta-
ble 2 shows the results of each model on the testing
dataset.
Table 2: The models results on the testing dataset.
Method Accuracy, %
SVC 73.30
Logistic Regression 73.98
Decision Tree 83.26
MLP 86.20
XGBoost 91.86
Random Forest 93.89
As it is evident from the table, the random forest
model demonstrated the highest accuracy in detect-
ing the operator fatigue together with XGBoost and
multi-layer perceptron. It can be considered as the
top priority candidate for further research.
6 CONCLUSIONS
The paper considers the problem of operator fatigue
detection. It is noted that computer vision can be con-
sidered as a promising technique to collect data for
fatigue detection since, on the one hand, it does not re-
quire attaching any devices to the operator, and, on the
other hand, surveillance systems are already widely
used and collecting video data of working operators
often will not require any additional equipment.
The conducted experiment was based on the
available dataset and analysed dependencies between
physiological indicators identified via state-of-the art
computer vision models and the operator fatigue state.
It was shown that there is significant correlation be-
tween the fatigue state and such indicators as head
Operator Fatigue Detection via Analysis of Physiological Indicators Estimated Using Computer Vision
429

pose angles, mouth openness ratio, eye closure ra-
tio, blood oxygen saturation, and count of eye clo-
sure longer than 2 seconds. It can be concluded that
it is reasonable to consider these indicators for further
analysis. Among the analyzed machine learning mod-
els, the multi-layer perceptron, XGBoost and random
forest were identified as the most promising ones re-
sulting in accuracy of 86.20%, 91.86%, and 93.89%
respectively.
The main limitation of the presented research is
the relatively small used dataset (only ten partici-
pants). Therefore, future planned work will be aimed
at extension of the dataset. Besides, separate analysis
of the most relevant physiological indicators will be
carried out with further integration of several indica-
tors for achieving the best fatigue detection capabili-
ties.
ACKNOWLEDGEMENTS
The research is funded by the Russian Science Foun-
dation (project 24-21-00300).
REFERENCES
Akamatsu, Y., Onishi, Y., and Imaoka, H. (2023). Blood
oxygen saturation estimation from facial video via
dc and ac components of spatio-temporal map. In
ICASSP 2023 - 2023 IEEE International Confer-
ence on Acoustics, Speech and Signal Processing
(ICASSP). IEEE.
Al-Zyoud, I., Laamarti, F., Ma, X., Tob
´
on, D., and El Sad-
dik, A. (2022). Towards a machine learning-based
digital twin for non-invasive human bio-signal fusion.
Sensors, 22(24).
Argyle, E. M., Marinescu, A., Wilson, M. L., Lawson, G.,
and Sharples, S. (2021). Physiological indicators of
task demand, fatigue, and cognition in future digital
manufacturing environments. International Journal of
Human-Computer Studies, 145:102522.
Borghini, G., Astolfi, L., Vecchiato, G., Mattia, D., and Ba-
biloni, F. (2014). Measuring neurophysiological sig-
nals in aircraft pilots and car drivers for the assessment
of mental workload, fatigue and drowsiness. Neuro-
science & Biobehavioral Reviews, 44:58–75. Applied
Neuroscience: Models, methods, theories, reviews. A
Society of Applied Neuroscience (SAN) special issue.
Bulat, A. and Tzimiropoulos, G. (2017). How far are we
from solving the 2d & 3d face alignment problem?
(and a dataset of 230,000 3d facial landmarks). In
ICCV 2017, pages 1021–1030. IEEE.
Dewi, C., Chen, R.-C., Chang, C.-W., Wu, S.-H., Jiang, X.,
and Yu, H. (2022a). Eye aspect ratio for real-time
drowsiness detection to improve driver safety. Elec-
tronics, 11(19):3183.
Dewi, C., Chen, R.-C., Jiang, X., and Yu, H. (2022b). Eye
aspect ratio for real-time drowsiness detection to im-
prove driver safety. PeerJ Computer Science, 8:e943.
Ding, X., Nassehi, D., and Larson, E. C. (2019). Mea-
suring oxygen saturation with smartphone cameras
using convolutional neural networks. IEEE Journal
of Biomedical and Health Informatics, 23(6):2603–
2610.
Fiedler, M.-A., Rapczynski, M., and Al-Hamadi, A. (2020).
Fusion-based approach for respiratory rate recogni-
tion from facial video images. IEEE Access, 8:103
036–130 047.
Franceschi, J.-Y., Dieuleveut, A., and Jaggi, M. (2020). Un-
supervised scalable representation learning for multi-
variate time series.
Gupta, N. K., Bari, A. K., Kumar, S., Garg, D., and Gupta,
K. (2021). Review paper on yawning detection pre-
diction system for driver drowsiness. In 2021 5th In-
ternational Conference on Trends in Electronics and
Informatics (ICOEI), pages 1–6. IEEE.
Hallac, D., Vare, S., Boyd, S. P., and Leskovec, J. (2017).
Toeplitz inverse covariance-based clustering of multi-
variate time series data. CoRR, abs/1706.03161.
Hamoud, B., Kashevnik, A., Othman, W., and Shilov,
N. (2023a). Neural network model combination for
video-based blood pressure estimation: New approach
and evaluation. Sensors, 23(4).
Hamoud, B., Othman, W., Shilov, N., and Kashevnik,
A. (2023b). Contactless oxygen saturation detection
based on face analysis: An approach and case study.
In 2023 33rd Conference of Open Innovations Associ-
ation (FRUCT), pages 54–62.
Hasan, F. and Kashevnik, A. (2021). State-of-the-art anal-
ysis of modern drowsiness detection algorithms based
on computer vision. In 2021 29th Conference of Open
Innovations Association (FRUCT), pages 141–149.
Hu, X. and Lodewijks, G. (2020). Detecting fatigue in car
drivers and aircraft pilots by using non-invasive mea-
sures: The value of differentiation of sleepiness and
mental fatigue. Journal of Safety Research, 72:173–
187.
Hu, Z., Xing, Y., Lv, C., Hang, P., and Liu, J. (2021).
Deep convolutional neural network-based bernoulli
heatmap for head pose estimation. Neurocomputing,
436:198–209.
Islam, A. T., Rahaman, N., and Ahad, M. A. R. (2019).
A study on tiredness assessment by using eye blink
detection. Jurnal Kejuruteraan.
Jain, M., Deb, S., and Subramanyam, A. V. (2016). Face
video based touchless blood pressure and heart rate es-
timation. In 2016 IEEE 18th International Workshop
on Multimedia Signal Processing (MMSP), pages 1–5.
Jiang, W., Chen, Z., Xu, H., Liu, T., Li, L., and Xu, X.
(2022). Establishment and verification of flight fa-
tigue model induced by simulated aircraft driving.
In MMESE 2022: Man-Machine-Environment System
Engineering, pages 146–152. Springer.
Kamran, M. A., Mannan, M. M. N., and Jeong, M. Y.
(2019). Drowsiness, fatigue and poor sleep’s causes
ICEIS 2024 - 26th International Conference on Enterprise Information Systems
430

and detection: A comprehensive study. IEEE Access,
7:167172–167186.
Kashevnik, A., Ali, A., Lashkov, I., and Zubok, D. (2021a).
Human head angle detection based on image analy-
sis. In Arai, K., Kapoor, S., and Bhatia, R., edi-
tors, Proceedings of the Future Technologies Confer-
ence (FTC) 2020, Volume 1, pages 233–242, Cham.
Springer International Publishing.
Kashevnik, A., Shchedrin, R., Kaiser, C., and Stocker, A.
(2021b). Driver distraction detection methods: A lit-
erature review and framework. IEEE Access, PP:1–1.
Kazemi, V. and Sullivan, J. (2014). One millisecond face
alignment with an ensemble of regression trees. In
CVPR 2014, pages 1867–1874. IEEE.
Kovalenko, S., Mamonov, A., Kuznetsov, V., Bulygin, A.,
Shoshina, I., Brak, I., and Kashevnik, A. (2023). Op-
eratoreyevp: Operator dataset for fatigue detection
based on eye movements, heart rate data, and video
information. Sensors, 23(13).
Landolt, E. (1888). Methode optometrique simple. Bull
Mem Soc Fran Ophtalmol, 6:213–4.
Liu, X., Fang, Z., Liu, X., Zhang, X., Gu, J., and Xu,
Q. (2017). Driver Fatigue Detection Using Multi-
task Cascaded Convolutional Networks. In Shi, Z.,
Goertzel, B., and Feng, J., editors, 2nd International
Conference on Intelligence Science (ICIS), volume
AICT-510 of Intelligence Science I, pages 143–152,
Shanghai, China. Springer International Publishing.
Part 3: Big Data Analysis and Machine Learning.
Louppe, G. (2015). Understanding random forests: From
theory to practice.
Luo, H., Lee, P.-A., Clay, I., Jaggi, M., and De Luca, V.
(2020). Assessment of Fatigue Using Wearable Sen-
sors: A Pilot Study. Digital Biomarkers, 4(Suppl.
1):59–72.
Luo, H., Yang, D., Barszczyk, A., Vempala, N., Wei, J., Wu,
S. J., Zheng, P. P., Fu, G., Lee, K., and Feng, Z.-P.
(2019). Smartphone-based blood pressure measure-
ment using transdermal optical imaging technology.
Circulation. Cardiovascular imaging, 12 8:e008857.
Mathew, J., Tian, X., Wu, M., and Wong, C.-W. (2022).
Remote blood oxygen estimation from videos using
neural networks.
Matuz, A., van der Linden, D., Kisander, Z., Hern
´
adi, I.,
K
´
azm
´
er, K., and Csath
´
o, r. (2021). Enhanced car-
diac vagal tone in mental fatigue: Analysis of heart
rate variability in time-on-task, recovery, and reactiv-
ity. PLOS ONE, 16(3):e0238670.
Meng, J., Zhao, B., Ma, Y., Yiyu, J., and Nie, B. (2014).
Effects of fatigue on the physiological parameters of
labor employees. Natural Hazards, 74.
Mizuno, K., Tanaka, M., Kouzi, Y., Kajimoto, O., Kurat-
sune, H., and Watanabe, Y. (2011). Mental fatigue
caused by prolonged cognitive load associated with
sympathetic hyperactivity. Behavioral and brain func-
tions : BBF, 7:17.
Oiwa, K., Bando, S., and Nozawa, A. (2018). Contactless
blood pressure sensing using facial visible and thermal
images. Artificial Life and Robotics, 23.
Othman, W. and Kashevnik, A. (2022). Video-based real-
time heart rate detection for drivers inside the cabin
using a smartphone. In 2022 IEEE International Con-
ference on Internet of Things and Intelligence Systems
(IoTaIS), pages 142–146.
Othman, W., Kashevnik, A., Ali, A., Shilov, N., and Ryu-
min, D. (2024). Remote heart rate estimation based
on transformer with multi-skip connection decoder:
Method and evaluation in the wild. Sensors, 24(3).
Othman, W., Kashevnik, A., Ryabchikov, I., and Shilov, N.
(2022). Contactless camera-based approach for driver
respiratory rate estimation in vehicle cabin. Lecture
Notes in Networks and Systems, 5431:429–442.
Qin, H., Zhou, X., Ou, X., Liu, Y., and Xue, C. (2021). De-
tection of mental fatigue state using heart rate variabil-
ity and eye metrics during simulated flight. Human
Factors and Ergonomics in Manufacturing & Service
Industries.
Ranjan, R., Sankaranarayanan, S., Castillo, C. D., and Chel-
lappa, R. (2017). An all-in-one convolutional neural
network for face analysis. In IEEE FG 2017, pages
17–24. IEEE.
Ravindran, K., Subha, P., Rajkumar, S., and Muthuvelu, K.
(2022). Implementing opencv and dlib open-source
library for detection of driver’s fatigue. In Innovative
Data Communication Technologies and Application,
pages 353–367. Springer.
Revanur, A., Dasari, A., Tucker, C. S., and Jeni, L. A.
(2022). Instantaneous physiological estimation using
video transformers.
Rogers, W. P., Marques, J., Talebi, E., and Drews, F. A.
(2023). Iot-enabled wearable fatigue-tracking system
for mine operators. Minerals, 13(2).
Rudari, L., Johnson, M. E., Geske, R. C., and Sperlak, L. A.
(2016). Pilot perceptions on impact of crew rest regu-
lations on safety and fatigue. International Journal of
Aviation, Aeronautics, and Aerospace, 3:4.
Ruiz, N., Chong, E., and Rehg, J. M. (2018). Fine-grained
head pose estimation without keypoints. In CVPR
2018, pages 2187–2196. IEEE.
Sampei, K., Ogawa, M., Torres, C. C. C., Sato, M., and
Miki, N. (2016). Mental fatigue monitoring using a
wearable transparent eye detection system. Microma-
chines, 7(2).
Sarada Devi, M. and Bajaj, P. (2008). Driver fatigue detec-
tion using mouth and yawning analysis. 8.
Saurav, S., Mathur, S., Sang, I., Prasad, S. S., and Singh, S.
(2019). Yawn detection for driver’s drowsiness pre-
diction using bi-directional lstm with cnn features. In
IHCI 2019: Intelligent Human Computer Interaction,
pages 189–200. Springer.
Savas¸, B. K. and Becerikli, Y. (2020). Real time driver
fatigue detection system based on multi-task connn.
IEEE Access, 8:12491–12498.
Scebba, G., Da Poian, G., and W., K. (2021). Multispectral
video fusion for noncontact monitoring of respiratory
rate and apnea. IEEE Transactions on Biomedical En-
gineering, 68(1):350–359.
Slapni
ˇ
car, G., Mlakar, N., and Lu
ˇ
strek, M. (2019). Blood
pressure estimation from photoplethysmogram using
Operator Fatigue Detection via Analysis of Physiological Indicators Estimated Using Computer Vision
431

a spectro-temporal deep neural network. Sensors,
19(15).
Soukupov
´
a, T. and Cech, J. (2016). Real-time eye blink
detection using facial landmarks.
Tanaka, M., Tajima, S., Mizuno, K., Ishii, A., Konishi, Y.,
Miike, T., and Watanabe, Y. (2015). Frontier studies
on fatigue, autonomic nerve dysfunction, and sleep-
rhythm disorder. The Journal of Physiological Sci-
ences : JPS, 65:483 – 498.
Wu, B.-F., Chiu, L.-W., Wu, Y.-C., Lai, C.-C., and Chu,
P.-H. (2022). Contactless blood pressure measure-
ment via remote photoplethysmography with syn-
thetic data generation using generative adversarial net-
work. In 2022 IEEE/CVF Conference on Computer
Vision and Pattern Recognition Workshops (CVPRW),
pages 2129–2137.
Xie, D., Wang, X., and Yin, C. (2024). Research on the
influence of operator fatigue factors on port service
capability based on discrete system simulation. SHS
Web of Conferences, 181:6.
Yang, H., Liu, L., Min, W., Yang, X., and Xiong, X. (2020).
Driver yawning detection based on subtle facial ac-
tion recognition. IEEE Transactions on Multimedia,
23:572–583.
Yang, T. Y., Chen, Y., Lin, Y., and Chuang, Y. (2019). Fsa-
net: Learning fine-grained structure aggregation for
head pose estimation from a single image. In CVPR
2019, pages 1087–1096. IEEE.
Yang, T. Y., Huang, Y. H., Lin, Y. Y., Hsiu, P. C., and
Chuang, Y. Y. (2018). Ssr-net: A compact soft stage-
wise regression network for age estimation. In IJCAI
2018, pages 1078–1084.
Ye, M., Zhang, W., Cao, P., and Liu, K. (2021). Driver
fatigue detection based on residual channel attention
network and head pose estimation. Applied Sciences,
11(19).
Zhao, Q., Nie, B., Bian, T., Ma, X., Sha, L., Wang, K., and
Meng, J. (2023). Experimental study on eye move-
ment characteristics of fatigue of selected college stu-
dents.
Zhu, X., Lei, Z., Liu, X., Shi, H., and Li, S. Z. (2016). Face
alignment across large poses: A 3d solution. In CVPR
2016, pages 146–155. IEEE.
ICEIS 2024 - 26th International Conference on Enterprise Information Systems
432
