
Improved Analysis of EGMS Data for Displacement Monitoring:
The Case Study of Regina Montis Regalis Basilica in Vicoforte, Italy
Davide Lodigiani
a
, Marica Franzini
b
and Vittorio Casella
c
Department of Civil Engineering and Architecture, University of Pavia, Via Ferrata 3, Pavia, Italy
Keywords: Cultural Heritage Conservation, SAR, Persistent Scatterers, Deformation Monitoring, Time Series.
Abstract: The Basilica of Vicoforte has always interested geotechnical engineers due to its location in a geologically
complex area. One part of the Basilica is built on marl, while the other is built on clay. These two types of
soil have different mechanical properties, which have caused the Basilica to experience various foundation
failures over time. Monitoring is necessary to evaluate structural evolution and prevent further damage. Radar
images are one of the geomatics techniques that can be used to perform these types of analyses; however,
SAR data processing is challenging and requires specialized skills and software to monitor deformations using
the PSInSAR approach. The European Ground Motion Service (EGMS) is useful for users and researchers,
but analyzing specific buildings or monuments requires a more refined grid. The paper proposes a package of
codes implemented using MATLAB release 2023b to manage grid spacing flexibly, customize it according
to structure dimensions, and manage potential blunders. After a thorough data analysis, it was concluded that
the monument exhibits no signs of subsidence trends. Instead, the analysis revealed that it undergoes seasonal
fluctuations closely associated with temperature changes. The proposed approach enhances data accuracy and
reliability, resulting in valuable insights and informed decisions.
1 INTRODUCTION
Italy is a country that boasts a diverse and extensive
cultural heritage, which has made it a popular tourist
destination for decades. The country's cultural
treasures are spread across its diverse regions and
span several millennia of human history. Artistically,
Italy is home to some of the world's most famous
artworks, from the masterpieces of the Renaissance to
contemporary art. The country's archaeological
heritage is equally impressive, with ancient ruins and
monuments scattered throughout its countryside.
According to UNESCO estimates, Italy is home
to a significant portion of Europe's cultural heritage,
including artistic, archaeological, architectural, and
environmental treasures (Benedikter, 2004). Since its
establishment, UNESCO has organized and
facilitated several conferences and conventions that
focus on conserving and restoring cultural artifacts,
historical sites, and traditions significant to
humanity's shared history and knowledge (Accardo et
a
https://orcid.org/0009-0009-5082-2022
b
https://orcid.org/0000-0002-3921-5178
c
https://orcid.org/0000-0003-2086-7931
al., 2003). The Italian Government has actively
promoted and founded various projects to provide
tools for preserving cultural heritage and mitigating
risks. Some of these projects are focused on raising
awareness about the importance of damage
prevention and reducing or eliminating its causes.
Geological hazards such as soil movements,
landslides, flooding, earthquakes, vulcanism,
sinkholes, cavities, and subsidence are among these
causes and pose significant risks to preserving Italian
cultural heritage. The Geo-Risks Assessment and
Mitigation for the Protection of Cultural Heritage
(GIANO) project is an Italian initiative that focuses
on assessing and mitigating geohazards that risk the
country's cultural heritage. The project has two main
objectives. Firstly, it aims to develop a robust
protocol for accurately quantifying the risks posed by
geohazards to Italy's cultural heritage. Secondly, it
aims to identify the most effective and least invasive
geotechnical mitigation techniques that can be used
Lodigiani, D., Franzini, M. and Casella, V.
Improved Analysis of EGMS Data for Displacement Monitoring: The Case Study of Regina Montis Regalis Basilica in Vicoforte, Italy.
DOI: 10.5220/0012730900003696
Paper published under CC license (CC BY-NC-ND 4.0)
In Proceedings of the 10th International Conference on Geographical Information Systems Theory, Applications and Management (GISTAM 2024), pages 71-82
ISBN: 978-989-758-694-1; ISSN: 2184-500X
Proceedings Copyright © 2024 by SCITEPRESS – Science and Technology Publications, Lda.
71

for different monumental constructions to address
these hazards.
The GIANO project examines 14 noteworthy
combinations of historical landmarks and geo-
hazards. The list includes famous archaeological sites
like the Etruscan necropolis of Tarquinia and Pompeii,
churches such as Santa Maria Maggiore in Maratea
and San Paolo Cathedral in Rome, and castles like
Calatabiano and San Felice in Panaro. Among these
sites, and the subject of this paper, is the Basilica of
Regina Montis Regalis in Vicoforte. In particular, this
church is facing a geological hazard due to uneven
foundation settling caused by non-uniform deposits.
Unfortunately, the involved structures often lack
the monitoring systems that are helpful for the
GIANO project, resulting in insufficient data to
assess the structural conditions and any deformations
over time. This also makes it challenging to determine
the history of past deformations that the structure has
undergone. Consequently, conducting reliable
numerical and risk scenario modeling becomes
impossible, reducing the ability to protect and prevent
these monuments from the effects of natural hazards.
Despite having some structural information, the
Basilica of Vicoforte lacks a historical terrain
deformation dataset.
Geomatics has several effective non-invasive
monitoring systems for identifying and tracking
geohazards associated with ground movement or
slope instability affecting cultural heritage structures.
Deformation monitoring can be accomplished using
techniques like high-precision GNSS, spirit leveling,
high-precision topographic surveying, and satellite-
based SAR (Synthetic Aperture Radar)
interferometry. Differential Interferometric Synthetic
Aperture Radar (DInSAR) is a sophisticated type of
radar technology that employs multiple Synthetic
Aperture Radar (SAR) images to detect and measure
even the slightest changes in the Earth's surface over
time(Blanco-Sánchez et al., 2008). The technique
compares SAR images acquired at different times and
uses the data to generate precise ground deformation
maps. This remote sensing technique is especially
valuable for detecting and monitoring surface
deformation in areas with geological hazards, such as
landslides (Cascini et al., 2010), volcanic activities
(Hooper et al., 2004), and earthquakes (Wright et al.,
2004). By allowing scientists to detect and monitor
subtle ground movements, DInSAR plays a crucial
role in understanding and predicting geological
phenomena and ensuring the safety of people and
infrastructure in vulnerable areas (Crosetto et al.,
2016).
Persistent Scatterers InSAR (PSInSAR) falls
under the differential interferometric Synthetic
Aperture Radar (SAR) group. This technique uses
stable reflective points with strong radar signal
reflectivity and maintains temporal stability over time
(Ferretti et al., 2001). Exploiting the permanent
properties of scatterers, atmospheric effects can be
filtered out, and geometrical decorrelation can be
eliminated. Numerous missions, such as the C-band
ERS mission and the more recent X-band SAR
missions, COSMO-SkyMed and TerraSAR-X, have
been developed over the years. These missions have
enabled the systematic acquisition of thousands of
interferometric data stacks worldwide, allowing for
the precise measurement of surface deformations at a
high spatial resolution and with millimetric-level
precision. Best of all, it is a cost-effective alternative
to traditional geodetic observations and does not
require any ground-based instruments to be installed.
The historical archive of more than 30 years allows
the reconstruction of past deformations and the
analysis of their evolution over time.
The Copernicus programme (Jutz & Milagro-
Pérez, 2020; Showstack, 2014) is a crucial aspect of
this framework and deserves special attention. The
project involves two radar sensors, the Sentinel-1A
and 1B (S1A and S1B), designed to collect
interferometric C-band Synthetic Aperture Radar
(SAR) image stacks on a global scale. These sensors
are equipped to monitor ground deformation over
Earth's surface accurately. The temporal resolution of
the mission is impressive, with SAR image stacks
collected every 6 days, allowing for precise
monitoring of any changes that occur over time.
Furthermore, the spatial resolution is equally
impressive, with a resolution of about 10 meters. This
level of accuracy enables us to obtain a detailed
understanding of ground deformation processes
occurring globally (Torres et al., 2020; Torres &
Davidson, 2019).
SAR data is significant, leading to the
development of a dedicated service within the
Copernicus framework: the European Ground Motion
Service (EGMS) (EMGS, 2024). The European
Commission created this valuable tool to monitor and
detect ground deformations using InSAR technology.
The service processes and analyses all Sentinel-1
acquisitions over the Copernicus Participating States,
providing a comprehensive and reliable platform for
SAR data analysis and facilitating informed decision-
making in various domains (Costantini et al., 2022).
The paper will describe the characteristics of the
Basilica, focusing on monitoring the structures due to
geotechnical issues. Specifically, displacement trends
GISTAM 2024 - 10th International Conference on Geographical Information Systems Theory, Applications and Management
72

could impact further stability, so it is important to
conduct dedicated investigations. The EGMS will be
utilized to achieve this, and its main features are
described in Section 2. However, the online platform
has an insufficient spatial resolution to perform
reliable analysis, as discussed in Sections 2.1 and 2.2.
To address this issue, Matlab codes and routines have
been developed to manage grid spacing flexibly,
customize it according to structure dimensions, and
manage potential errors, as reported in Section 3.
Finally, the results will be presented in Section 4,
demonstrating that the Basilica does not suffer from
any displacement trend but shows significant
seasonal fluctuations closely associated with
temperature changes.
1.1 The Regina Montis Regalis Basilica
The Regina Montis Regalis Basilica is a massive
stone structure in Vicoforte, in northern Italy (Figure
1). This sanctuary is renowned for its extraordinary
oval-shaped dome, which measures around 37x25
meters internally, making it the fourth-largest dome
in the world (Chiorino et al., 2008).
Figure 1: View of the Regina Montis Regalis Basilica in
Vicoforte.
Duke Charles Emmanuel I of Savoy originally
envisioned the Basilica as the dynasty's mausoleum.
The construction of this architecture commenced in
1596, with Ascanio Vittozzi (1583-1615) serving as
the lead architect. Due to an unfortunate site
selection, the building suffered from significant
differential settlements in its foundations since the
early stages of construction (Chiorino et al., 2008).
The settlements were present due to the non-
uniformity of the deposit. The site is characterized by
a layer of compressible clayey silt that increases in
depth from east to west. This layer rests on top of a
marlstone layer that is exposed on the east side of the
Basilica. Upon investigation, five of the Basilica's
eight pillars were found on the compressible soft
layer. At the same time, the remaining three were
placed directly on the marlstone (Bandera et al.,
2023) due to this geological issue. However, concerns
over the drum-dome system's structural safety
emerged shortly after an extended system of
asymmetric wide cracks opened (Figure 2).
Figure 2: Pattern of the cracks observed by Eng. Garro on
the Basilica of Vicoforte (Bandera et al., 2023).
The structural integrity of the Basilica has been
monitored through permanent static (since 2004) and
dynamic (since 2015) multi-sensor monitoring
systems. The GIANO project aims to recreate
settlements and study how the subsoil's stress-strain
properties and behavior relate to the structure's
behavior. An essential aspect of geotechnical
numerical analyses is the geotechnical
characterization of the site, which includes analyzing
large-scale terrain deformations. This necessity forms
the basis of using the PSInSAR technique for
deformation monitoring.
2 THE EGMS SERVICE
EGMS is part of the Copernicus program, which
involves 30 European states that process and analyze
the Sentinel-1 dataset using a PSInSAR approach.
The project has a monitoring timeframe from 2015 to
2021, with an annual update (European
EnvironmentAgency (EEA), 2020).
The OpeRatIonal Ground motion INsar Alliance
(ORIGINAL) consortium, spearheaded by e-GEOS
from Italy, is responsible for data processing. The
consortium also comprises TRE Altamira from Italy,
NORCE from Norway, GAF AG from Germany, and
the support of five other companies. The processing
considers 750 S1 SAR SLC images, and each stack
consists of 260 SAR scenes for the baseline product.
The data utilized for processing requires a large
Improved Analysis of EGMS Data for Displacement Monitoring: The Case Study of Regina Montis Regalis Basilica in Vicoforte, Italy
73
amount of disk space, approximately 1.5 PB, which is
expected to increase by 350 TB annually (Crosetto et
al., 2020, 2022).
As previously mentioned, this service is based on
the Sentinel-1 constellation, which consists of two
satellites: Sentinel-1A and Sentinel-1B. Sentinel-1A
has operated since April 3, 2014, while its twin,
Sentinel-1B, was launched into orbit on April 25,
2016. Both satellites have a C-band SAR sensor and
use the Terrain Observation Progressive Scan SAR
(TOPSAR) mode to acquire data (De Zan &
Guarnieri, 2006). The Interferometric Wide Swath
(IWS) satellite imaging mode is a feature that enables
the sensor to capture high-resolution satellite images
with exceptional detail and coverage. With this mode,
the images can be obtained with a remarkable spatial
resolution of 5 meters in the direction parallel to the
satellite's line of flight (azimuth) and 20 meters along
the range. Moreover, the acquired area is extensive,
covering 200 kilometers along the azimuth and 250
kilometers along the range. This wide coverage
provides a more comprehensive view of the area,
making it ideal for large-scale mapping, land-use
monitoring, and environmental studies. Additionally,
this mode provides a revisit time of 12 days for a
single satellite, which means that the same area can
be imaged every 12 days. When two satellites are in
orbit, the revisit time is reduced to only six days,
allowing for more frequent and timely monitoring of
the area (Torres et al., 2012). EGMS is a well-
documented service reported in Costantini et al.,
2021; Crosetto et al., 2020, 2021; Del Soldato et al.,
2021.
The system offers a web-based interface that is
available to all users. This interface allows users to
search for a specific location and view a map of all
scatterers detected in the selected area. By selecting a
scatterer, the system generates a graph that displays
its displacements over time. Noticeable, the platform
is not limited to displaying time series; it allows
registered users to download the raw data in the form
of tables in three different ways (Crosetto et al.,
2021):
1. Basic (Level L2A): basic units of measurement,
which contain the displacement data along the
satellite’s line of sight as provided in the original
radar geometry grid, with geolocation and quality
indicators for each measurement point. These
products are generated for each relative orbit of
satellite image stacks;
2. Calibrated (Level L2B): these products are
derived from Level 2A products and are aligned
to a standard reference frame using external
information such as GNSS data. The Level 2B
products are also integrated and mosaicked using
best geodetic practices, and they are connected to
the EUREF datum for consistency;
3. Ortho (Level 3): East-West and Up-Down
deformation rates produced by combining Level
2B data from ascending and descending orbits,
allowing the East-West and Up-Down
components of the deformation rates to be
estimated. The Level 3 products are resampled on
a grid with 100 m x 100 m.
2.1 Data Visualization
On the EGMS platform, you can view points at
different levels - L2A, L2B, or L3. The L2A and L2B
levels only show movement along the line of sight,
while the L3 level allows you to separate horizontal
(East-West) and vertical (Up-Down) displacements.
However, it is worth noting that the PSs are divided
into 100x100 meter cells at the L3 level, which might
not be appropriate for all applications. Besides, the
grid is set by the platform and cannot be adapted to
the different needs of the users.
This limitation becomes even more apparent
when analyzing a structure's deformation or
displacement, such as the Basilica of Vicoforte. In
this scenario, the platform identifies the grid points
near the church rather than directly on it. As a result,
the displayed displacements are the outcome of
averaging results originating from permanent
scatterers located on the cathedral and its neighboring
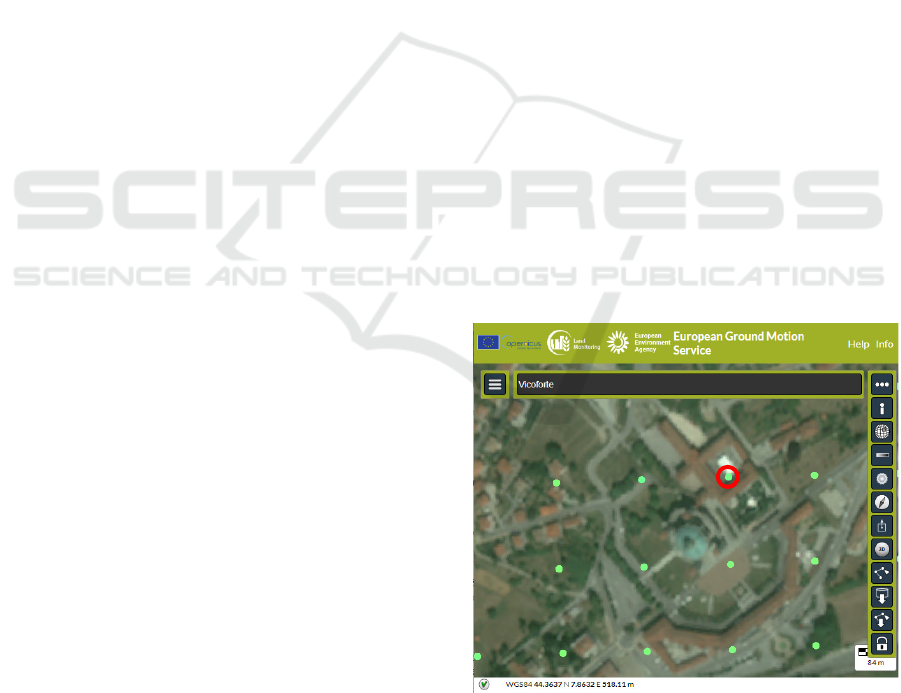
elements (Figure 3).
Figure 3: The 100x100-meter grid over the Basilica of
Vicoforte available on the EGMS platform. The
background is the VHR Image Mosaic 2018 (Copernicus,
European Environment Agency).
GISTAM 2024 - 10th International Conference on Geographical Information Systems Theory, Applications and Management
74

Then, after selecting a location of interest, such as
the red circle shown in Figure 3, a time series graph
corresponding to that location is opened. The chart
displays the date of each acquisition on the x-axis and
the corresponding displacements in millimeters on
the y-axis. The default setting shows the vertical
displacements for the L3 level, but using the Data
Selection Window, it is also possible to display the
other information.
Figure 4 displays a visualization example,
precisely the gridded point highlighted in Figure 3.
This visualization illustrates horizontal and vertical
displacement and includes a synthetic summary
showing the annual mean velocity and the standard
deviation. However, the 100 x 100-meter grid
averaging process makes identifying any clear trend
or seasonality difficult.
Figure 4: Example EGMS chart showing both horizontal
and vertical displacement for a gridded point (L3 level).
2.2 Anomalous Data Management
It is crucial to remove any outliers from a dataset as
they deviate significantly from the behavior of the
rest of the data. In SAR data, outliers may arise from
measurement errors, atmospheric errors, or surface
changes. When considering displacement time series,
removing anomalous or erroneous values is
particularly important because they could
significantly affect the interpretation of the outcomes.
Rejecting blunders makes it possible to obtain a
homogeneous and reliable time series.
Unfortunately, the EGMS platform does not allow
the user to control the removal of outliers from the
displacement time series. The user cannot select the
most suitable method for rejecting data in their case
study, nor can they assess the effect of outliers on the
results. This inflexibility limits the user's capacity to
interpret the data accurately and draw sound
conclusions.
Figure 4 depicts an example of this issue with
some isolated points. Without proper knowledge and
control of data processing, it is challenging to
differentiate between blunders and actual values.
3 METHODOLOGY
Processing SAR datasets can be challenging,
requiring specific skills and dedicated software
packages. The PSInSAR approach is necessary to
monitor deformations. Therefore, massive data must
be processed to create the time series.
The EGMS service is a valuable tool for
conducting this analysis, especially for newbies. The
EGMS consortium extracts persistent scatterers (PS)
for ascending and descending orbits and provides
them on the web platform. This information is then
combined at the L3 level to generate vertical and
horizontal displacements in a gridded format.
However, as mentioned in the conclusion of Section
2, the data provided may not be sufficient for
analyzing a particular building or monument. In such
instances, a more refined grid is necessary as a grid
spacing of 100 meters is too coarse.
Within the GIANO project, the dome's behavior
at the Regina Montis Regalis Basilica in Vicoforte
requires careful analysis and a comparison to
surrounding buildings; in this case, the EGMS
platform's simple consultation is insufficient.
To address these limitations, a package of codes
was implemented using MATLAB release 2023b.
This approach has two main advantages: managing
grid spacing flexibly and customized according to
structure dimension and managing the presence of
potential blunders. Implementing this approach
makes enhancing the data's accuracy, consistency,
and reliability feasible, resulting in more valuable
insights and informed decisions.
3.1 EGMS Tables Management
The first step involves downloading the tables that
contain L2B data for both ascending and descending
geometry for a selected area. However, even if a
region of interest (ROI) is given, the platform
manages the data according to the burst of reference
S1 image. Hence, the persistent scatters downloaded
refer to a larger area. This results in a significant
amount of data, which, in our case, takes up around
1.5 GB per table.
Improved Analysis of EGMS Data for Displacement Monitoring: The Case Study of Regina Montis Regalis Basilica in Vicoforte, Italy
75

A specific code enables the selection of persistent
scatterers available inside the ROI, disregarding all
others and speeding up the following steps.
3.2 Grid Generation and PSs Indexing
Once both tables have been reduced to the scatterers
present in the ROI, they can be organized according
to the analysis requirements.
The ROI usually has a square or rectangular shape,
so it can be divided into a grid with regular spacing
determined using a parametric approach. Each cell
inside the ROI can be identified by an ID consisting
of two values representing its row and column
position. The program then checks the position of
each PS concerning the generated grid and assigns the
corresponding ID.
Users can then set the cell size according to
specific requirements, such as structure dimensions.
However, it is important to note that the number of
PSs available significantly impacts component
decomposition. At least one ascending and
descending PS is required for this operation, with
having more than one PS improving robustness.
Therefore, the cell size should be calibrated while
considering this requirement.
3.3 Time Series Generation
Displacement time series can then be generated after
harmonizing the two tables and indexing the PSs
based on the selected grid. The tool is made up of
several functions that allow you to perform the
following tasks:
Removing cells that contain PSs having
discrepancies in their velocity values;
Identifying outliers in the displacement time
series and recalculating them;
Remove cells containing only one PS.
Calculate the average displacement data for
ascending and descending geometries and place
them at the cell's centroid.
Standardizing displacement dates between two
acquisition geometries by generating time-related
average data (weekly, monthly, quarterly, yearly).
Generating a series of plots useful for data
interpretation and analysis.
The code tests the congruency of velocities between
PSs in each cell; the Copernicus consortium
determines velocities and available within the
downloaded datasets. Simply removing the PSs that
present such anomalies might not be sufficient to
address the issue of inconsistent velocities. Indeed,
several scatterers in such cells are often found to be
significantly different from one another. Therefore,
removing the entire cell altogether was decided,
providing greater accuracy. To understand which
areas have adequate cell numerosity for subsequent
steps, the code generates two graphs (one for each
acquisition geometry), in which valid cells are
highlighted in green and rejected cells in red.
Besides, to perform a slant displacement
decomposition in horizontal and vertical components,
at least two PSs are necessary - one for ascendant and
one for descendant geometry. If a cell contains only
one PS, the operation cannot be performed, and also,
in this case, the cell will be removed from the next
step.
The displacement time series of every PS is then
checked for possible outliers. Sometimes, the datasets
that contain the slant displacements may have
anomalous values due to atmospheric errors or
surface changes. If these values are not managed
correctly, they can negatively impact the time series
analysis. Instead of removing these values and
creating a gap in the dataset, the code replaces them
with the mean value between the previous and
following displacement. Also, in this case, the code
generates a graphical output for better interpretation.
Once the outliers have been replaced with average
values, the code calculates the mean and standard
deviation of the slant displacement for the two
acquisition geometries in every cell. This allows the
measurement to be regularized into a gridded format;
the calculated values are associated with each cell's
centroid coordinates. A graphic plot is also available
for this step.
Finally, the observations for the two geometries,
ascending and descending, are not taken
simultaneously but with a few days' difference
between them. To overcome this issue, the code
performs a time average between the dates, according
to the user's chosen criteria: weekly, monthly,
quarterly, or yearly. This creates a consistent
timetable for both acquisition geometries, which
helps decompose the displacement into vertical and
horizontal components.
Figure 5 illustrates the workflow described, with
blue shapes representing functions and red ones
indicating graphical outputs.
3.4 Slant Displacement Decomposition
By considering the slant displacements of the
ascending and descending geometry for each cell, it
is possible to calculate both vertical (up-down) and
horizontal (east-west) displacement components
GISTAM 2024 - 10th International Conference on Geographical Information Systems Theory, Applications and Management
76
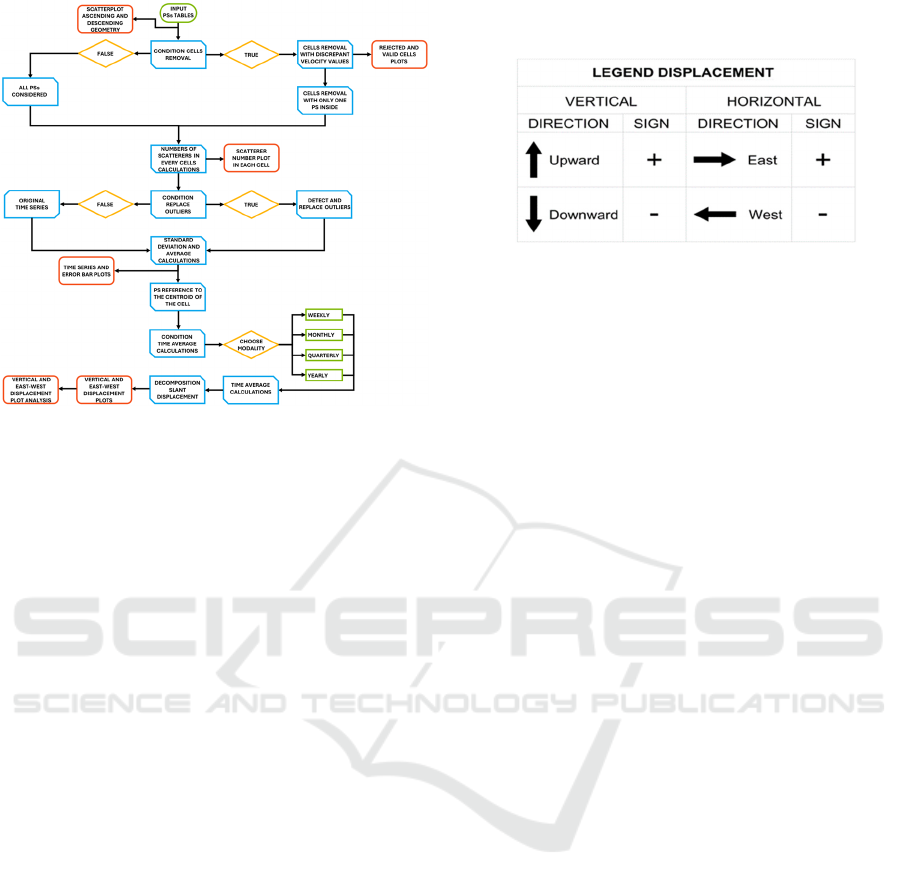
Figure 5: Workflow implemented in MATLAB
environment.
(Fuhrmann & Garthwaite, 2019).
In particular, the two elements can be obtained:
d
d
A
d
d
(1)
Matrix A has the following expression:
A
sin
θ
cos
α
cos
θ
sin
θ
cos
α
cos
θ
(2)
Variables have the following meanings:
d
: vertical displacement (Up-Down);
d
: horizontal displacement (East-West);
d
: displacement along the satellite's line of
sight in ascending geometry;
d
: displacement along the satellite's line of
sight in descending geometry;
θ
: angle of incidence of ascending geometry;
θ
: angle of incidence of descending geometry;
α
: heading angle of ascending geometry;
α
: heading angle of descending geometry.
Understanding the displacement signs is crucial to
comprehend the phenomenon in the selected area of
interest. The vertical displacement is negative when it
moves downwards away from the sensor, while it is
positive when moving upwards towards the sensor.
On the other hand, the horizontal displacement is
positive when the point moves in the East direction,
while it is negative when moving in the West
direction. For a better understanding, please refer to
Figure 6, which shows the legend of the signs for
vertical (Up-Down) and horizontal (East-West)
displacements.
Figure 6: Legend vertical (Up) and planimetric (East-West)
displacement.
4 RESULTS
The following is a selection of the results obtained for
the area of Regina Montis Regalis Basilica in
Vicoforte. The data used for the study spans five
years, from February 2016 to December 2021. The
section focuses on the immediate vicinity of the
Basilica, which covers an area of 0.15 square
kilometers, and focuses on a comprehensive analysis
of the dome's behavior.
Figure 7 presents an orthophoto of the area with
the persistent scatterers' availability displayed for
both the ascending and descending geometries. These
PSs are obtained from the L2B data collected from
the EGMS platform and are used to determine vertical
and horizontal displacements. The figure shows that
some areas have scatterers derived from only one
geometry, ascending or descending. The Basilica's
dome has this behavior due to its structure
configuration. Therefore, a careful choice of the grid
size is necessary in this case.
Based on the previous sections, a smaller grid size
is utilized to enhance the analysis of results
obtainable using the standard L3 level. In the EGMS
platform, a cell size of 100 m is used, whereas,
concerning the dome dimension and PSs location, a
cell size of 25 m is used here, which is a quarter of
that. A total of 238 cells were created and distributed
on 17 rows and 14 columns.
In order to gain a clearer understanding of the
distribution of cells within the area of interest, a plot
containing the grid and cell IDs is created. Figure 8
shows the generated grid, represented in black,
superimposed onto the orthophoto of the area. Each
cell containing at least one PS reports its index,
represented by the number of rows and columns;
empty cells correspond to areas without PS.
The code generates a figure displaying the grid
with cell ID in black, the number of scatterers in
Improved Analysis of EGMS Data for Displacement Monitoring: The Case Study of Regina Montis Regalis Basilica in Vicoforte, Italy
77
ascending geometry in red, and the number of
scatterers in descending geometry in blue (Figure 9).
Figure 9 shows that many cells contain a quantity
of PSs that are insufficient for performing the
decomposition process. Therefore, cells with only
ascending or descending scatterers and cells with
velocity incongruent values must be discarded. Table
1 reports some statistical values on valid and rejected
cells.
Figure 7: PSs positions for ascending acquisition geometry
are in red, and the descending one is in blue. The
background is the WMS service of the Piedmont region for
the orthophoto AGEA 2018.
Figure 8: The grid created for the ROI has a cell size of 25
m. Each cell containing the PSs reports its index,
represented by the number of rows and columns.
The EGMS platform partially bypasses the first
issue, choosing to discretize the ground into cells of
100 m in size since there is more possibility of having
ascending and descending PSs.
Fortunately, for GIANO project purposes, the
cells containing the Basilica’s Dome are sufficient in
number and quality for the next steps. The cells
involved are the (8,6) and (9,6).
Figure 9: Each cell displays the ID in black, the number of
ascending acquisition geometry scatterers in red, and the
number of descending geometry scatterers in blue.
Table 1: Total number of valid and rejected cells.
Acquisition
geometry
Total
cells
Valid
cells
Rejected
cells
Ascending 108 71 (66%) 37 (34%)
Descending 107 73 (68%) 34 (32%)
4.1 Dome Displacements Analysis
Out of the two cells covering the dome, only the cell
(8,6) will be considered as it has more PSs. This cell
is located in the South-Western part of the Basilica's
dome. Specifically, it consists of seven scatterers with
ascending geometry and six with descending
geometry.
The data was analyzed for outliers before
performing slant displacement decomposition. Two
figures were created to display the time series for
ascending and descending geometry - Figure 10 and
Figure 11, respectively. All present PSs (seven in the
first figure and six in the second) were considered.
GISTAM 2024 - 10th International Conference on Geographical Information Systems Theory, Applications and Management
78
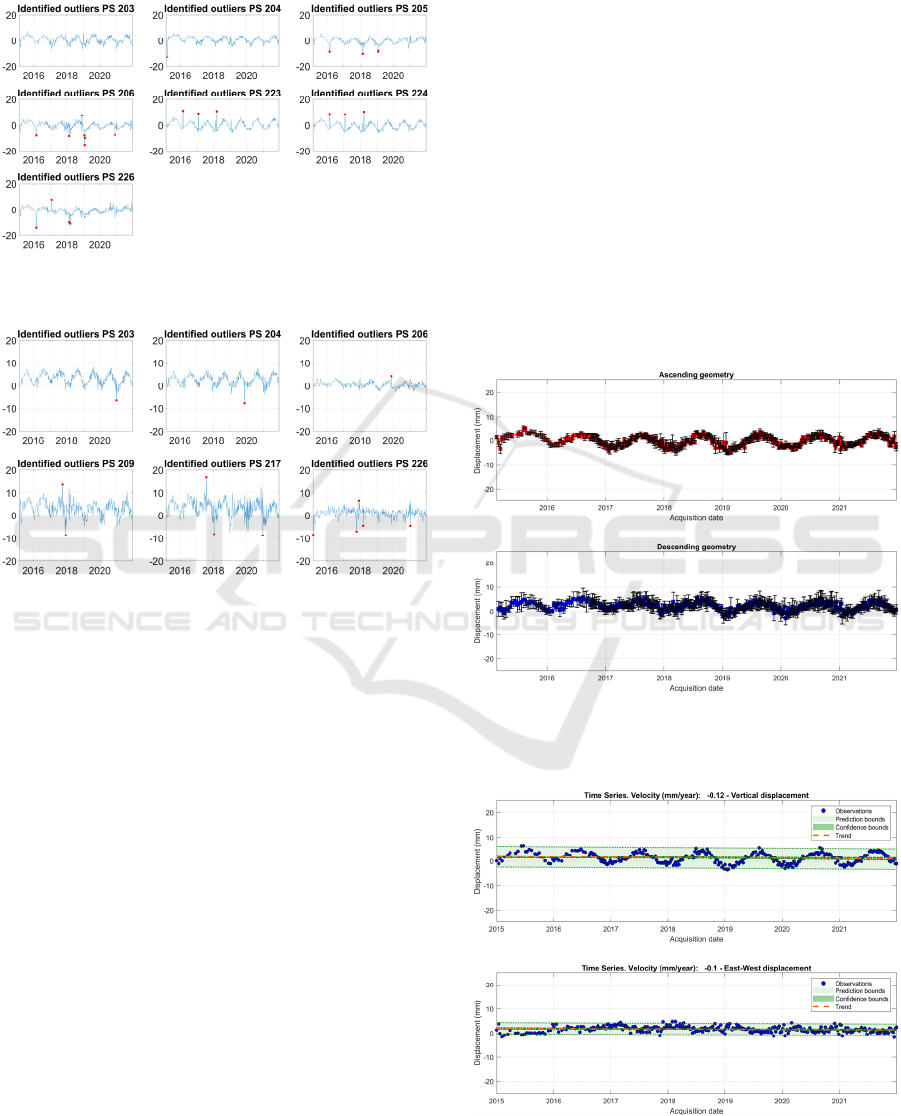
The code highlights any blunders found with a red
point. Some values found blunders are relatively high
for some PSs, especially for ascending geometry.
Figure 10: The outliers identified for the ascending
geometry are indicated in red.
Figure 11: The outliers identified for the descending
geometry are indicated in red.
After replacing the outliers with the mean
displacement between the previous and following
data points, the displacement values for all the PSs in
the same cell are averaged and grouped by geometry.
The plot in Figure 12 shows the time series for the
slant displacement of the considered cell and the two
geometries. The results for the ascending orbit are
displayed in red, while those for the descending orbit
are in blue. The vertical bars in a graph show the
confidence interval of the mean, which is derived
from the standard deviation. This allows us to
visualize the spread of the data that contributed to the
mean. The former geometry generally shows low
standard deviation values, except for a few cases with
high values.
Upon analyzing the time series data, it becomes
immediately apparent that a recurring seasonal
pattern is present over time. Instead, when analyzing
the L3-level data present on the EGMS portal, this
phenomenon is not readily discernible. This is
because the L3-level data are aggregated at a coarser
level, masking the underlying seasonal pattern in the
raw data.
Decomposing the displacement into its vertical
and horizontal components is now possible. Figure 13
displays the displacement trend along with the
associated confidence interval and confidence bounds.
Both displacements exhibit a negligible annual
displacement rate of -0.1 mm/year. Besides, the
previously observed cyclic phenomenon depends
mainly on vertical displacement. Focusing on 2020
and 2021, Figure 14 shows that the positive peaks
occur in July-August, whereas the negative peaks
occur in January-February. This seasonal variation is
probably due to the material used to construct the
dome of the Basilica; indeed, it is made of copper,
which tends to expand and contract based on the
temperature, causing a change in its size. The
horizontal displacement, on the other hand, seems to
remain mostly stable.
Figure 12: Slant displacement time series for the selected
cell. Outcomes for ascending acquisition geometry are in
red, whereas those for descending one are in blue.
Figure 13: Vertical and horizontal displacement time series
for the selected cell.
Improved Analysis of EGMS Data for Displacement Monitoring: The Case Study of Regina Montis Regalis Basilica in Vicoforte, Italy
79
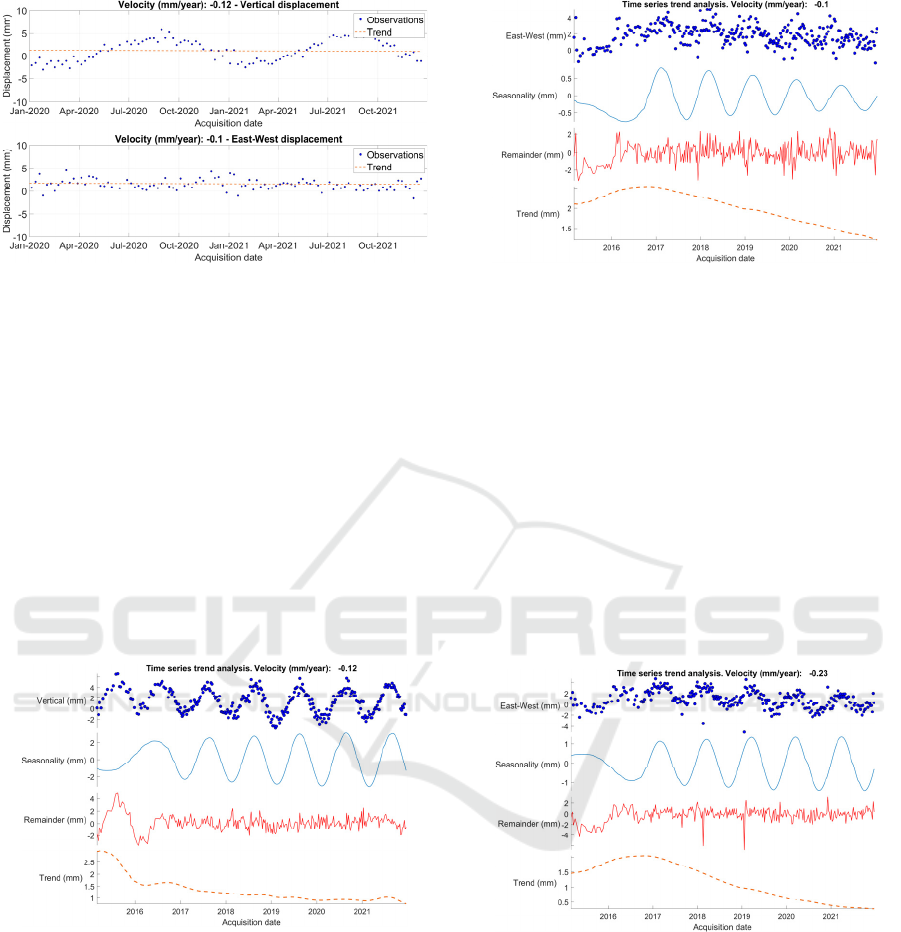
Figure 14: At the top is the vertical displacement time
series, and at the bottom is the horizontal one. The time
interval has been reduced to the last two years to show how
the maximum peaks occur in the summer period (July-
August) and the minimum peaks in the winter period
(February-March).
The vertical and horizontal displacement signals
were decomposed to understand the displacements
better. This process allows the time series to be
broken down into its components, which include the
trend, seasonality, and residual. Figure 15 displays
the vertical component of the displacement, where the
trend indicates a drop in the structure's position by
around 1.5 mm between 2015 and 2021. The
seasonality is evident with a fluctuation of ±2 mm,
and the residual falls within the same range.
Figure 15: Decomposition of the vertical displacement time
series for cell (8,6). From top to bottom, vertical
displacement seasonality, remainder, and the time series
trend.
Similarly, Figure 16 illustrates the horizontal
displacement, which also shows a decreasing trend,
although the displacement is only 0.6 mm over the
considered period. From 2017 onwards, the
contribution of seasonality appears to be much less
pronounced than for the vertical component, with
variations of ±1 mm. Like the vertical shift, the
residual seems to be within a range of ±2 mm.
Figure 16: Decomposition of the horizontal displacement
time series for cell (8,6). From top to bottom, vertical
displacement seasonality, remainder, and the time series
trend.
Based on the time series of displacement data,
there are no significant deformations in the structure
or the surrounding area. The deformations are
negligible. No localized deformations were observed
in the structure, but a seasonal pattern was identified
in the vertical component. Specifically, a periodic
signal was observed in the vertical displacement, with
maximum peaks occurring in August and minimum
peaks in January. Additionally, there is a slight
seasonal component in the horizontal component,
although it is not as significant as that of the vertical
displacement.
Figure 17: Decomposition of the vertical displacement time
series for cell (9,6). From top to bottom, vertical
displacement seasonality, remainder, and the time series
trend.
It is worth noting that while cell (8,6) has the most
significant number of PSs, it is possible to obtain
similar information for other cells as well. For
instance, Figure 17 shows the vertical displacement
of another cell, cell (9,6), located in the Basilica
dome. The two cells display similar trends regarding
average speed of movement and periodicity. This
similar behavior demonstrates that using tuned
parameters for PS analysis can improve the
GISTAM 2024 - 10th International Conference on Geographical Information Systems Theory, Applications and Management
80

interpretation of the EGMS datasets. However,
further investigation is needed for 2016, as there are
some conflicting values in Figures 15, 16, and 17.
5 CONCLUSION
The Basilica of Vicoforte is a magnificent religious
structure in a geologically complex area. It is even
more fascinating because it is built on two distinct
geological formations - marl and clay. These two
types of soil have different mechanical properties,
which have caused the Basilica to experience various
foundation failures over time. These failures have
resulted in cracks, detachments, and deformations in
the dome and other structure parts. Due to these issues,
the Basilica has required numerous restoration and
consolidation works since its construction. As a result,
geo-technicians continually monitor the Basilica to
detect new subsidence and intervene promptly to
ensure the structure's integrity.
Geomatics offers a range of noninvasive systems
to monitor structural deformation and displacement.
The Basilica has some monitoring systems, primarily
consisting of accelerometers, which measure the
frequency of structural movements. However, a
means to measure deformation concerning an
external stable framework was not available in the
short or long term. Therefore, a radar approach was
employed.
SAR data processing is a complex and
challenging task that requires specialized skills and
software. A more refined grid is necessary to monitor
deformations using the PSInSAR approach,
especially when analyzing specific buildings or
monuments. While the EGMS service can be helpful
for general purposes, it may not provide the necessary
detail for analyzing specific structures. Fortunately, a
package of codes implemented using MATLAB
release 2023b can flexibly manage grid spacing,
customized according to the dimensions of the
structure under consideration. This approach offers
greater control over the data, making it possible to
identify and manage potential blunders. It also
enhances data accuracy and reliability, providing
valuable insights to inform decisions.
The analysis with a customized MATLAB code
package helped refine the size of the interpolation
grid, manage the presence of any outliers, and analyze
the vertical and horizontal movements in terms of
seasonality and trends. Due to the aggregation level
present on the EGMS platform, this was not directly
possible with the original L3 level. The analysis
highlighted a seasonal phenomenon on the dome of
the Basilica, presumably due to the expansion of the
metal linked to temperatures, having an extent of
around two millimeters. However, no subsidence
trend is evident, recording movements of only 0.1
mm per year.
As no other displacement monitoring systems are
available, comparing the obtained results with other
measurements is not feasible. Nonetheless, the
paper's primary aim was to enhance the analysis of
data extracted from the EGMS database, and this
objective was achieved successfully. As part of the
GIANO project scope, other monitored monuments
will be tested with the same analysis approach,
selecting those with additional monitoring sensors.
ACKNOWLEDGMENTS
The authors thank the Italian Ministry of University
and Research (MUR) for funding the project through
the PRIN 2020 scheme.
REFERENCES
Accardo, G., Giani, E., & Giovagnoli, A. (2003). The risk
map of Italian cultural heritage. Journal of
Architectural Conservation, 9(2). https://doi.org/
10.1080/13556207.2003.10785342
Bandera, S., Gioffrè, D., & Lai, C. G. (2023). Geotechnical
Characterization of the Subsoil at the “Regina Montis
Regalis” Basilica in Vicoforte, Italy. Springer Series in
Geomechanics and Geoengineering. https://doi.org/
10.1007/978-3-031-34761-0_59
Benedikter, R. (2004). Privatisation of Italian cultural
heritage. International Journal of Heritage Studies,
10(4). https://doi.org/10.1080/ 1352725042000257393
Blanco-Sánchez, P., Mallorquí, J. J., Duque, S., & Monells,
D. (2008). The coherent pixels technique (CPT): An
advanced DInSAR technique for nonlinear deformation
monitoring. Pure and Applied Geophysics, 165(6).
https://doi.org/10.1007/s00024-008-0352-6
Cascini, L., Fornaro, G., & Peduto, D. (2010). Advanced
low- and full-resolution DInSAR map generation for
slow-moving landslide analysis at different scales.
Engineering Geology, 112(1–4). https://doi.org/
10.1016/j.enggeo.2010.01.003
Chiorino, M. A., Spadafora, A., Calderini, C., &
Lagomarsino, S. (2008). Modeling strategies for the
world’s largest elliptical dome at Vicoforte.
International Journal of Architectural Heritage, 2(3).
https://doi.org/10.1080/15583050802063618
Costantini, M., Minati, F., Trillo, F., Ferretti, A., Novali, F.,
Passera, E., Dehls, J., Larsen, Y., Marinkovic, P.,
Eineder, M., Brcic, R., Siegmund, R., Kotzerke, P.,
Probeck, M., Kenyeres, A., Proietti, S., Solari, L., &
Andersen, H. S. (2021). EUROPEAN GROUND
Improved Analysis of EGMS Data for Displacement Monitoring: The Case Study of Regina Montis Regalis Basilica in Vicoforte, Italy
81

MOTION SERVICE (EGMS). International
Geoscience and Remote Sensing Symposium (IGARSS),
2021-July. https://doi.org/10.1109/
IGARSS47720.2021.9553562
Costantini, M., Minati, F., Trillo, F., Ferretti, A., Passera,
E., Rucci, A., Dehls, J., Larsen, Y., Marinkovic, P.,
Eineder, M., Brcic, R., Siegmund, R., Kotzerke, P.,
Kenyeres, A., Proietti, S., Solari, L., & Andersen, H.
(2022). EGMS: a New Copernicus Service for Ground
Motion Mapping and Monitoring. EGU General
Assembly 2022, 23-27 May 2022.
Crosetto, M., Monserrat, O., Cuevas-González, M.,
Devanthéry, N., & Crippa, B. (2016). Persistent
Scatterer Interferometry: A review. In ISPRS Journal of
Photogrammetry and Remote Sensing (Vol. 115).
https://doi.org/10.1016/j.isprsjprs.2015.10.011
Crosetto, M., Solari, L., Balasis-Levinsen, J., Bateson, L.,
Casagli, N., Frei, M., Oyen, A., Moldestad, D. A., &
Mróz, M. (2021). Deformation monitoring at european
scale: The copernicus ground motion service.
International Archives of the Photogrammetry, Remote
Sensing and Spatial Information Sciences - ISPRS
Archives, 43(B3-2021). https://doi.org/10.5194/isprs-
archives-XLIII-B3-2021-141-2021
Crosetto, M., Solari, L., Barra, A., Monserrat, O., Cuevas-
González, M., Palamà, R., Wassie, Y., Shahbazi, S.,
Mirmazloumi, S. M., Crippa, B., & Mróz, M. (2022).
ANALYSIS OF THE PRODUCTS OF THE
COPERNICUS GROUND MOTION SERVICE.
International Archives of the Photogrammetry, Remote
Sensing and Spatial Information Sciences - ISPRS
Archives, 43(B3-2022). https://doi.org/10.5194/isprs-
archives-XLIII-B3-2022-257-2022
Crosetto, M., Solari, L., Mróz, M., Balasis-Levinsen, J.,
Casagli, N., Frei, M., Oyen, A., Moldestad, D. A.,
Bateson, L., Guerrieri, L., Comerci, V., & Andersen, H.
S. (2020). The evolution of wide-area DInSAR: From
regional and national services to the European ground
motion service. In Remote Sensing (Vol. 12, Issue 12).
https://doi.org/10.3390/RS12122043
De Zan, F., & Guarnieri, A. M. (2006). TOPSAR: Terrain
observation by progressive scans. IEEE Transactions
on Geoscience and Remote Sensing, 44(9). https://
doi.org/10.1109/TGRS.2006.873853
Del Soldato, M., Confuorto, P., Bianchini, S., Sbarra, P., &
Casagli, N. (2021). Review of works combining GNSS
and insar in Europe. In Remote Sensing (Vol. 13, Issue
9). https://doi.org/10.3390/rs13091684
EMGS. (2024). EGMS. https://egms.land.copernicus.eu/
European Environmnet Agency (EEA). (2020). Copernicus
Land Monitoring Service 2020. European Environment
Agency (EEA).
Ferretti, A., Prati, C., & Rocca, F. (2001). Permanent
scatterers in SAR interferometry. IEEE Transactions on
Geoscience and Remote Sensing, 39(1). https://
doi.org/10.1109/36.898661
Fuhrmann, T., & Garthwaite, M. C. (2019). Resolving
three-dimensional surface motion with InSAR:
Constraints from multi-geometry data fusion. Remote
Sensing, 11(3). https://doi.org/10.3390/rs11030241
Hooper, A., Zebker, H., Segall, P., & Kampes, B. (2004). A
new method for measuring deformation on volcanoes
and other natural terrains using InSAR persistent
scatterers. Geophysical Research Letters, 31(23).
https://doi.org/10.1029/2004GL021737
Jutz, S., & Milagro-Pérez, M. P. (2020). Copernicus: The
European earth observation programme. Revista de
Teledeteccion, 2020(56). https://doi.org/10.4995/
raet.2020.14346
Showstack, R. (2014). Sentinel Satellites Initiate New Era
in Earth Observation. Eos, Transactions American
Geophysical Union, 95(26). https://doi.org/10.1002/
2014eo260003
Torres, R., & Davidson, M. (2019). Overview of
Copernicus SAR Space Component and its Evolution.
International Geoscience and Remote Sensing
Symposium (IGARSS). https://doi.org/10.1109/
IGARSS.2019.8899134
Torres, R., Davidson, M., & Geudtner, D. (2020).
Copernicus Sentinel Mission at C- and L-Band: Current
Status and Future Perspectives. International
Geoscience and Remote Sensing Symposium (IGARSS).
https://doi.org/10.1109/IGARSS39084.2020.9323149
Torres, R., Snoeij, P., Davidson, M., Bibby, D., & Lokas,
S. (2012). The Sentinel-1 mission and its application
capabilities. International Geoscience and Remote
Sensing Symposium (IGARSS). https://doi.org/10.1109/
IGARSS.2012.6351196
Wright, T. J., Parsons, B. E., & Lu, Z. (2004). Toward
mapping surface deformation in three dimensions using
InSAR. Geophysical Research Letters, 31(1).
https://doi.org/10.1029/2003GL018827
GISTAM 2024 - 10th International Conference on Geographical Information Systems Theory, Applications and Management
82
