
Decoding the Gap: A Retrospective Analysis of Women’s Experiences in
Software Engineering
Lucia Happe, Kai Marquardt, Ricarda Trumpf and Ingo Wagner
Karlsruhe Institute of Technology, Germany
Keywords:
Computer Science Education, Stereotypes in Computing, Diversity, Inclusive Education, Early Computing
Exposure, Career Aspirations in Technology, Educational Policy, Societal Perceptions.
Abstract:
The persistent gender gap in software engineering (SE) poses a significant challenge in a world where digital
innovation is crucial to societal progress. This paper explores the underlying factors contributing to the low
participation of women in SE education and careers. Through a retrospective questionnaire study, we sought
to capture the experiences and perceptions that deter women from pursuing SE despite initial interest. Our
findings indicate that stereotypes, misconceptions about the field, and a lack of early positive exposure influ-
ence women’s decisions regarding SE. The study reveals that barriers such as the perceived incompatibility of
SE with personal interests, the daunting image of the SE work environment, and the absence of female role
models are critical deterrents. Furthermore, we discuss how early and continuous engagement with computing
can reshape perceptions and foster a more inclusive environment. The paper concludes with actionable rec-
ommendations, emphasizing that efforts to close the gender gap in SE should not only aim for demographic
balance but also harness the full potential of diversity for driving innovation. Ultimately, the study underscores
the need for systemic changes in education and policy to create a more equitable and dynamic SE landscape.
1 INTRODUCTION
The digital age has ushered in an era where innova-
tion is no longer the sole domain of large corpora-
tions or research labs. This democratization of tech-
nology, characterized by accessible digital tools and
lower barriers to entry, has transformed the landscape
of creation and dissemination. Yet, as we navigate
towards a sustainable and equitable future, a glaring
disparity persists in the composition of those who par-
take in technological advancement – particularly in
the field of software engineering (SE). This disparity
is most pronounced in the gender divide, with women
significantly underrepresented in SE education and
careers. The integration of diverse talents, especially
those of women who constitute half of the global de-
mographic, is not merely a matter of social justice but
a strategic imperative for innovation. A diverse work-
force guarantees products that cater to a broader spec-
trum of society, amplifying the collective earning po-
tential and, consequently, strengthening the economic
fabric (Albusays et al., 2021; Rodr
´
ıguez-P
´
erez et al.,
2021; Lorenzo et al., 2018).
Despite marginal advancements in female par-
ticipation in SE, the pace is lacklustre. The pre-
vailing barriers are not insurmountable; rather, they
are steeped in perceptions and myths that have long
coloured the narrative of SE. As identified by leaders
in the field like Maria Klawe (Fidelman, 2012), mis-
conceptions around the allure, approachability, and
professional milieu of SE contribute significantly to
the reluctance among women to enter the field. How-
ever, evidence suggests that early exposure to com-
puting can reshape these narratives. Google’s 2014
study (Google, 2014) highlights the stark contrast in
attitudes towards computing between girls who re-
ceived academic exposure and those who did not.
The former group associated computing with ’future’,
’fun’, and ’interesting’, whereas the latter leaned
towards ’boring’ and ’difficult’. This underscores
the impact that educational frameworks and curricula
have on the perception of SE among young women.
Despite these insights, a significant number of
women who exhibit enthusiasm for SE are deterred
by the frustrations encountered in their learning jour-
ney (Happe et al., 2021; Happe and Buhnova, 2022;
Marquardt et al., 2023; Marquardt and Happe, 2023).
Addressing these barriers calls for interventions that
extend beyond tokenistic efforts for gender balance
(Gorbacheva et al., 2019). It necessitates a genuine
Happe, L., Marquardt, K., Trumpf, R. and Wagner, I.
Decoding the Gap: A Retrospective Analysis of Women’s Experiences in Software Engineering.
DOI: 10.5220/0012732100003693
Paper published under CC license (CC BY-NC-ND 4.0)
In Proceedings of the 16th International Conference on Computer Supported Education (CSEDU 2024) - Volume 1, pages 227-236
ISBN: 978-989-758-697-2; ISSN: 2184-5026
Proceedings Copyright © 2024 by SCITEPRESS – Science and Technology Publications, Lda.
227

recognition of the value that women bring to SE and a
concerted effort to cultivate an environment that nur-
tures their interests and skills.
This paper probes deeper into the factors that dis-
suade women from pursuing SE. Through a retro-
spective analysis of survey data, we uncover the spe-
cific challenges and frustrations that lead to attrition
among women in SE. We shed light on the often in-
visible hurdles and aim to pave the way for actionable
solutions that will encourage and sustain women’s
involvement in SE. In our preceding study (Happe
and Buhnova, 2022) (focusing on P1 and P2 only),
we pinpointed various frustrations through quotations
and the deployment of personas within our dataset.
This paper builds upon that foundation by conducting
a comprehensive and systematic analysis of the word
lexicon employed in participants’ expressions.
2 METHODOLOGY
2.1 Study Design
The primary goal of our study was to explore the ex-
periences of women in computing, particularly focus-
ing on those who have disengaged from the field as
well as those who have remained. This approach dif-
fers significantly from previous studies such as those
by Joshi et al. (Joshi et al., 2013) and Armstrong et al.
(Armstrong et al., 2018). We aimed to understand the
pivotal moments influencing their career paths, iden-
tify major obstacles and drivers in their journey, and
gather recommendations for enhancing girls’ partici-
pation in computing.
2.2 Data Collection
Our primary instrument for data collection was a
questionnaire, crafted to delve into women’s engage-
ment with computing. In this study, we focus on
six open-ended questions of the questionnaire, which
encouraged respondents to reflect on their journey
in computing. These questions covered perceptions
of computer scientists, motivational factors, barriers
faced, and suggestions for improving computing ed-
ucation for girls. Participant demographics such as
age, gender, and major interests were also collected.
The open-ended questions asked were:
• Q1. What do you think about computer scientists?
Who are they? What do they do? Is there some
experience you have and would like to share with
us?
• Q2. What makes you feel most enthusiastic about
and interested in computing? What do you use a
computer for? What do you enjoy most?
• Q3. What was or would be the biggest driver on
your way to computing?
• Q4. What was or would be the biggest obstacle
on your way to computing?
• Q5. Are there any key points you think or feel we
need to know to make computing education better
for you or other girls?
• Q6. If you had any computing skills necessary,
what would you do with it (e.g., get a new job,
start a new company, become a teacher, imple-
ment your idea, etc.)?
2.3 Distribution and Sample
The questionnaire was disseminated through channels
catering to individuals with an interest in computing,
with a particular focus on organizations like Czechi-
tas (www.czechitas.cz) that offer late-education op-
portunities for adult women. Our global outreach
predominantly utilized Facebook groups dedicated to
late computing education for women. This strategy
was designed to attract respondents who had a strong
potential for pursuing computer science in their ear-
lier years, setting our study apart from previous re-
search.
From the initial pool of 151 responses, we ana-
lyzed 140 valid submissions after excluding incom-
plete entries and those not matching our target demo-
graphic criteria, such as responses from men. Our
respondents were categorized into three age groups:
18-26 (18%), 27-34 (41%), and over 34 (33%). The
engagement level was high, with 90% of participants
completing all open-ended questions, often providing
thoughtful and detailed responses.
2.4 Analysis Method
The analysis of open-ended responses was conducted
systematically through the following steps:
1. Data Cleaning. We began by removing filler and
overly frequent words, such as redundant terms
from the questions themselves or common filler
language.
2. Word Cloud Generation. Utilizing Mon-
keyLearn’s word cloud tool (https://monkeylearn.
com/word-cloud), we identified prevalent words
in the responses, which guided our initial catego-
rization.
3. Categorization and Labeling. We scanned
the responses for prominent words, their syn-
CSEDU 2024 - 16th International Conference on Computer Supported Education
228

onyms, and expressions conveying similar mean-
ings. These terms were then grouped into cat-
egories and assigned labels. Notably, responses
often received multiple labels due to the nuanced
nature of the data.
4. Frequency Analysis. Using the ”COUNTIF”
function, we quantified the frequency of each la-
bel. This was complemented by a custom ”fin-
dIDs” function to trace the occurrences back to
individual responses. The categorized data, trans-
formed from qualitative responses, was then sub-
jected to quantitative analysis.
2.5 Persona Segmentation and
Typification
Our survey garnered a total of 140 valid responses,
which were categorized into three distinct Personas
(Happe and Buhnova, 2022) based on their career
paths and relationship with computing (e.g. studied
CS as a primary degree or secondary, first choice or
later in life). This diverse participant pool spanned
across three age groups and was nearly evenly dis-
tributed across the Czech Republic, Germany, and
other regions.
Persona 1 (P1) (42% of Respondents). This group
represents women who have pursued a career in com-
puting from the outset. They typically have a back-
ground in computer science or a related field and have
maintained a continuous trajectory in SE. This per-
sona encapsulates those who found their calling in
computing early on and followed it through their ed-
ucational and professional journey. Typical Quote.
”I think computer scientists are cool people, gen-
erally socially awkward in my experience but well-
meaning... Also, I think computer scientists have a
hard time maintaining a work-life balance... comput-
ing problems require a lot of attention and sometimes
everything else in life gets sidetracked.”
Persona 2 (P2) (17% of Respondents). Constitut-
ing women who transitioned to computing later in
their lives, this persona reflects a non-linear path to
SE. These respondents may have initially pursued ed-
ucation and careers in fields unrelated to computing
but eventually found their way into SE. This group
is particularly noteworthy as it highlights the appeal
of SE to individuals with diverse initial career paths
and the permeability of the field to professionals from
various backgrounds. Typical Quote. ”I am not a
person that enjoys computing on its own, I need some
higher goal. I like to think of it as means of fulfilling
my other goals in different fields. That’s what I’d like
to see more of – showing that IT is not just IT, more
commonly it is connected to some other field and you
can work with anything being in IT.”
Persona 3 (P3) (40% of Respondents). This per-
sona includes women who have never considered en-
tering the computing field. Their perspectives are
crucial for understanding the barriers and misconcep-
tions about SE that deter women from considering
a career in this area. This group provides insights
into external factors, societal perceptions, or personal
preferences that influence the decision against pursu-
ing a career in computing. Typical Quote. ”Hm, I
wouldn’t say there was one (obstacle). In retrospect,
it was a smooth autodidactic slide (away from CS) fu-
elled by personal interest.”
2.6 Comparative Analysis Methodology
This comparative analysis aims to discern the expe-
riences that influenced the career decisions of P1, P2
and P3. We specifically investigate what factors drove
P2 to eventually pursue computing despite initial de-
cisions against it, or P3 completely against it from
the beginning, and contrast these with the experiences
of P1 who consistently pursued a path in comput-
ing. The analysis seeks to uncover the frustrations and
challenges that steered P2 and P3 away from com-
puting initially and the driving forces that drew them
back to the field.
3 RESULTS
This section presents the findings from our retrospec-
tive questionnaire study, aimed at understanding the
reasons behind the attrition of women in software en-
gineering (SE). The results are organized into several
thematic subsections, each addressing a specific as-
pect of our investigation.
3.1 Q1: Perceptions of Computer
Scientists
The key perceptions of computer scientists as iden-
tified by our respondents are described as ’problem-
solving’, ’diversity’, and ’social skills’, with ’prob-
lem’, ’women’, and ’work’ being the most prominent
words depicted. Table 1 reflects the frequency and
percentage of specific terms mentioned by respon-
dents when discussing their views on computer sci-
entists.
Decoding the Gap: A Retrospective Analysis of Women’s Experiences in Software Engineering
229
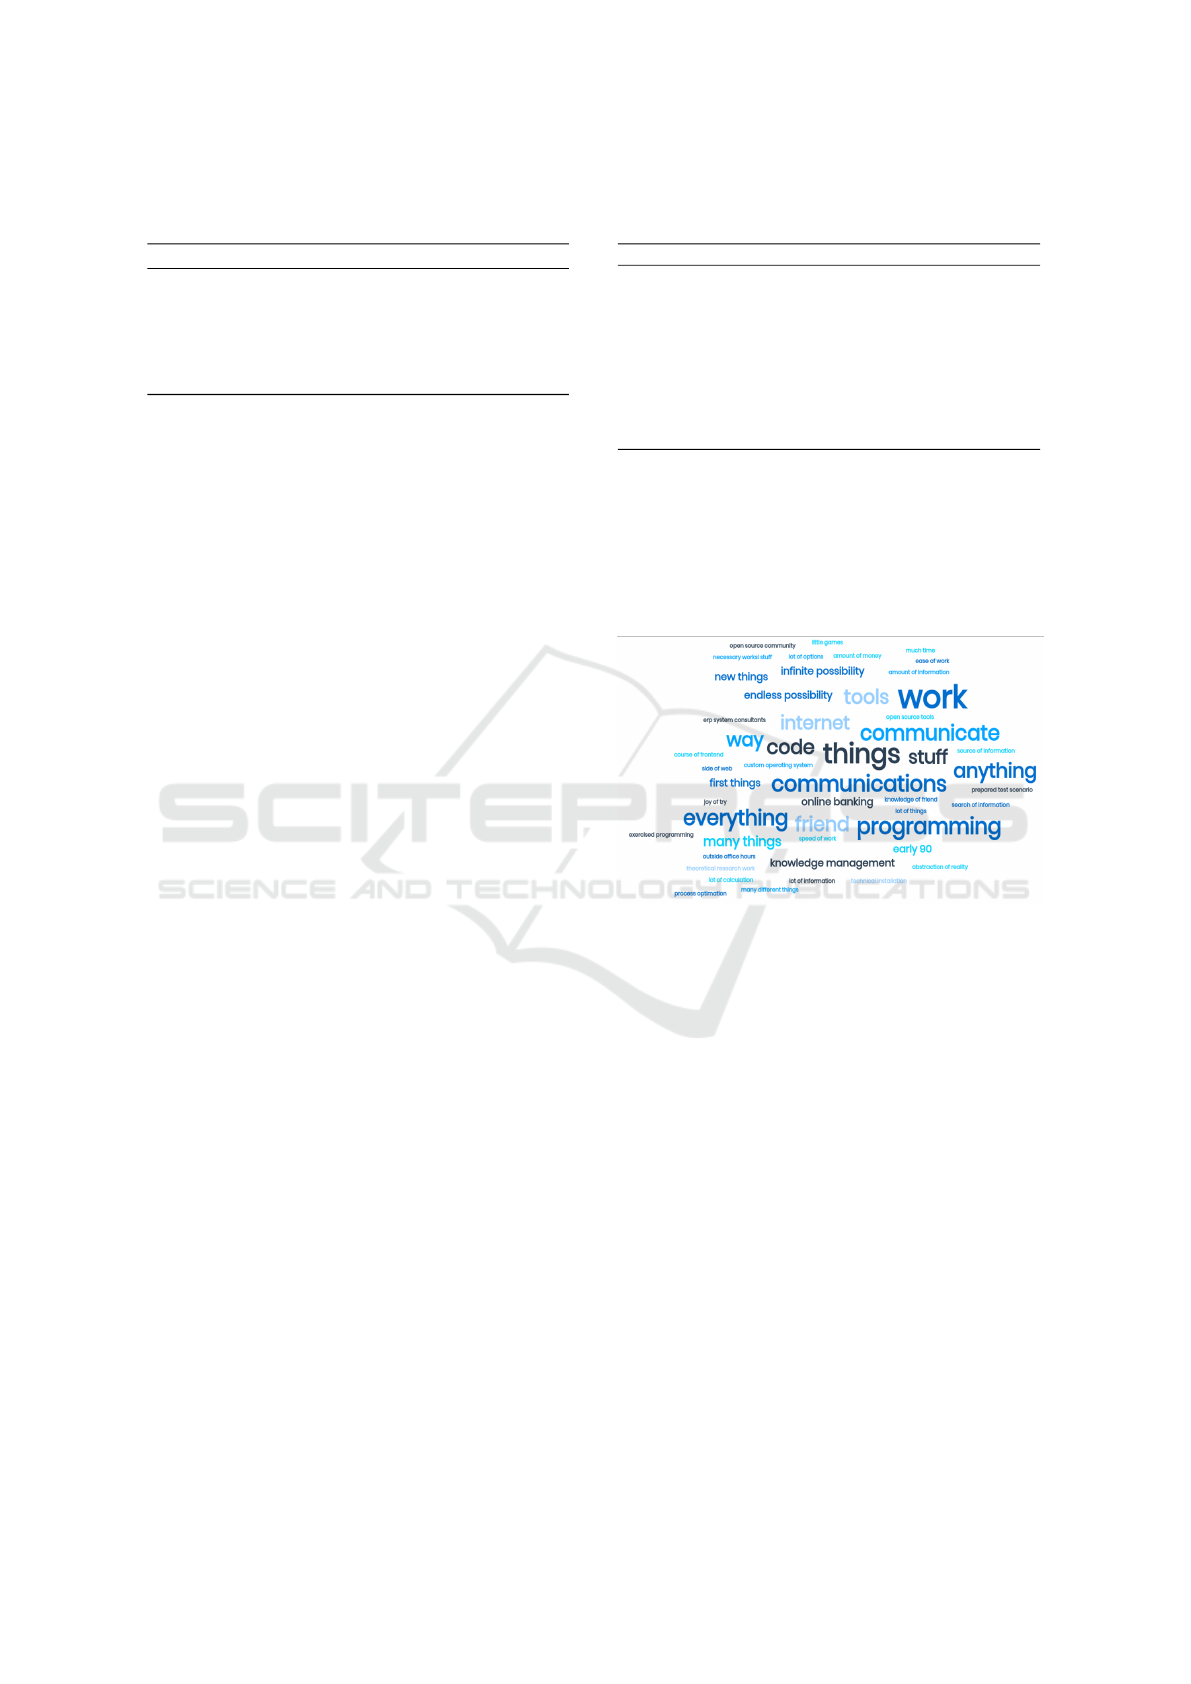
Table 1: Frequency and percentage of specific perceptions
of computer scientists.
Perception Category All P1 P2 P3
Problem solver 12 (9% ) 5 (8%) 2 (8%) 5 (9%)
Normal, nothing special 12 (9%) 6 (10%) 2 (8%) 4 (7%)
Introvert, low social skills 8 (6% ) 6 (10%) 1 (4%) 1 (2%)
Logical, analytical 7 (5%) 3 (5%) 1 (4%) 3 (5%)
Contributing, altruistic 7 (5%) 2 (3%) 2 (8%) 3 (5%)
Toxic, non-ethical 6 (4%) 2 (3%) 2 (8%) 2 (4%)
Intelligent 6 (4%) 4 (7%) 2 (8%) 0 (0%)
The data indicate a complex and multifaceted
view of the computer science profession among the
participants. While problem-solving skills are highly
recognized, there is also an acknowledgement of the
diversity within the field. Social challenges and gen-
der disparities are noted, reflecting the need for cul-
tural and educational shifts in the computing environ-
ment. The comparative analysis of the responses to
the perceptions of computer scientists across the three
personas (P1, P2, P3) reveals the following distribu-
tion of responses within various categories:
• P1, who studied and stayed in computing, re-
sponses suggest a more nuanced understanding of
the field, with higher mentions of both positive
(problem solver, logical) and negative (introvert,
toxic) traits.
• P2, who transitioned to computing later in life,
seems to have a slightly more idealistic view,
emphasizing altruistic and intellectual aspects, as
well ascontribution to society.
• P3, who never considered entering computing,
tends to have a lower incidence in several cate-
gories and may indicate less familiarity or engage-
ment with the stereotypes or realities of the pro-
fession, as well as it seems they may not strongly
associate intelligence with the field.
An interesting observation is as well that all personas
perceive computer scientists as problem solvers at
similar rates (8% and 9%, respectively), and the view
that they are normal is held by 9% overall, suggests
an emerging view of these professionals as ordinary
individuals, challenging the stereotype of them being
markedly distinct or eccentric from the general pop-
ulation. Overall, these observations point to a com-
plex and evolving public image of computer scien-
tists, one that balances the recognition of their spe-
cialized skills and intellectual capacities with an ap-
preciation of their ordinariness and approachability.
This duality suggests a shift towards a more nuanced
and humanized understanding of professionals in the
tech industry, which could have implications for how
the field is perceived and engaged with by the broader
society.
Table 2: Frequency and percentage of aspects associated
with enthusiasm for computing.
Perception Category All P1 P2 P3
Social interaction 29 (21% ) 8 (14%) 4 (17%) 17 (30%)
Programming 24 (17%) 9 (15%) 4 (17%) 11 (19%)
Creativity, creating, tinkering 12 (16% ) 12 (20%) 5 (21%) 5 (9%)
Makes work easier 21 (15%) 5 (8%) 4 (17%) 12 (21%)
Finding answers, research 18 (13%) 6 (10%) 4 (17%) 8 (14%)
Data analyses, simulation 16 (11%) 5 (8%) 3 (13%) 8 (14%)
Learning, exploring 15 (11%) 5 (8%) 4 (17%) 6 (11%)
Solving problems 9 (6% ) 4 (7%) 0 (0%) 5 (9%)
Endless possibilities 9 (6%) 5 (8%) 1 (4%) 3 (5%)
Supporting/helping others 9 (6%) 5 (8%) 2 (8%) 2 (4%)
Gaming 8 (6%) 4 (7%) 2 (8%) 2 (4%)
Entertainment (videos, music) 8 (6%) 4 (7%) 2 (8%) 2 (4%)
3.2 Q2: Enthusiasm and Interests in
Computing
Respondents expressed a diverse range of enthusi-
asms and interests within the realm of computing, as
depicted in the word cloud in Figure 1.
Figure 1: Word cloud visualizing the aspects of computing
that participants find most engaging.
Respondents expressed a diverse range of enthu-
siasms and interests within the realm of computing.
Communication, coding, and creativity emerged as
the most engaging aspects, highlighting the multi-
faceted nature of computing that captivates interests.
Table 2 details the frequency and percentage of the
mentioned aspects, providing a quantitative measure
of the specific areas that participants associate with
their enthusiasm for computing.
The analysis suggests that while technical aspects
such as programming and data analysis are signifi-
cant, the social dimension of computing and the abil-
ity to facilitate work and creativity also play a vital
role in sustaining interest in the field. The compara-
tive analysis of enthusiasm and interests in computing
across the three personas (P1, P2, P3) for selected cat-
egories reveals the following distribution:
• The category Chat-
ting/Communication/Interacting with People
is represented across all personas, with P3 (30%)
CSEDU 2024 - 16th International Conference on Computer Supported Education
230
showing the highest association, suggesting that
they might view computing as more collaborative
than P1 (14%) and P2 (17%). This indicates a
general interest in the social aspect of computing
across all groups.
• In the category Write
Code/Programming/Coding, P1 and P3 are
quite similar in their number of responses, while
P2 is slightly less represented. This suggests that
coding is a significant interest area for those who
stayed in computing (P1) and those who never
considered it (P3).
• The category Creativity/Create Some-
thing/Stuff/Tinkering shows a notable difference,
with P2 having the highest number of responses.
This indicates that individuals who transitioned
to computing later in life (P2) are particularly
drawn to the creative and hands-on aspects of
computing.
The data shows that enthusiasm for computing
spans a broad range of aspects, from the tech-
nical (like programming and data analysis) to the
more human-centric (like social interaction and help-
ing others). Notably, P3 often exhibits higher per-
centages in categories related to practical applications
(like making work easier and social aspects), whereas
P2 show more inclination towards creative and P1 to-
wards problem-solving aspects. This suggests that
different groups may be drawn to computing for var-
ied reasons, and these motivations need to be recog-
nized and nurtured to foster a more inclusive comput-
ing environment.
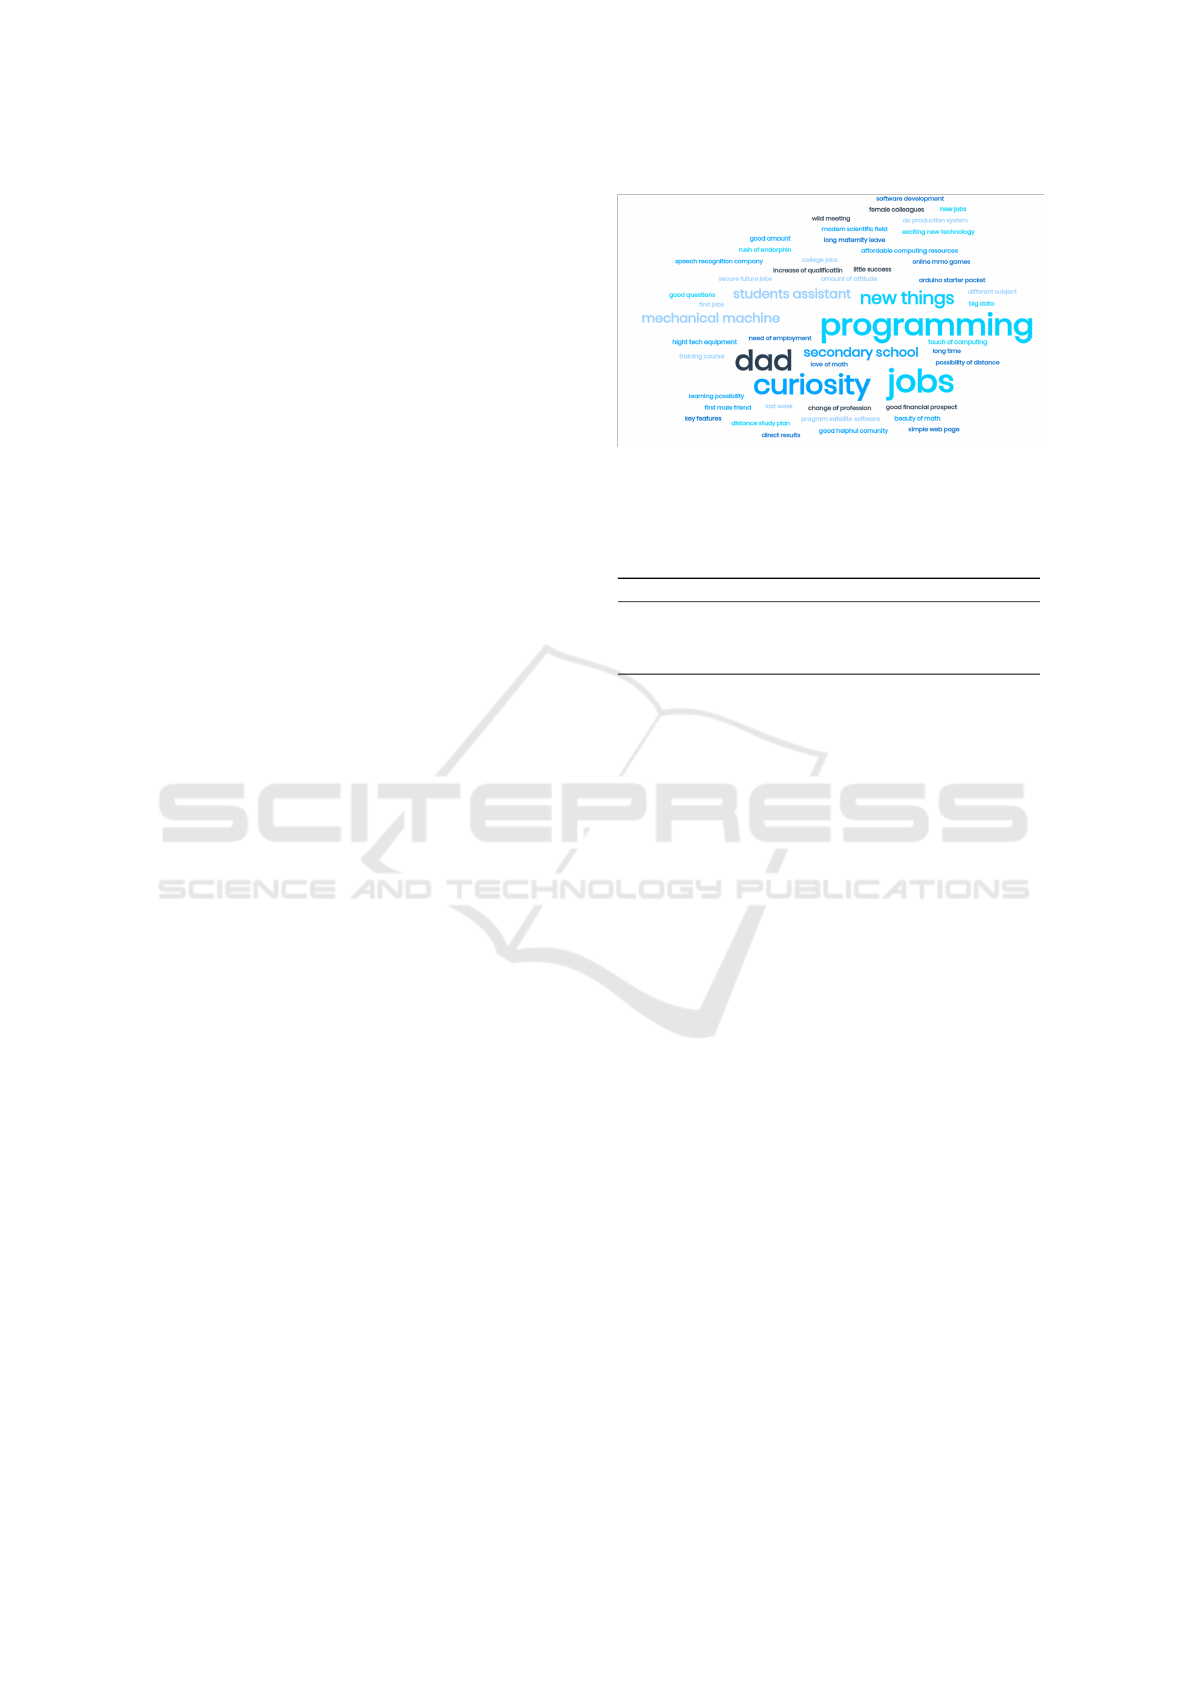
3.3 Q3: Drivers to Computing
The driving factors that propel individuals towards a
career or interest in computing were derived from the
data collected and are illustrated in the word cloud
in Figure 2. Personal interest, family influence (espe-
cially by fathers), and financial prospects were among
the most cited reasons.
In this section, we investigate driving factors that
propel individuals towards a career or interest in com-
puting were derived from the data collected based on
responses to the questionnaire item Q6: What was or
would be the biggest driver on your way to comput-
ing?. A detailed breakdown of these motivating fac-
tors is presented in Table 3, showing the frequency
and corresponding percentage of responses.
This distribution of drivers underscores the impor-
tance of personal passion and interest in computing
as leading factors, followed closely by familial sup-
port where particularly often ’dad’ was mentioned,
Figure 2: Word cloud representing the drivers to computing
as reported by participants.
Table 3: Frequency and percentage of reported drivers to
computing.
Perception Category All P1 P2 P3
Personal interest 22 (16% ) 11 (19%) 6 (25%) 5 (9%)
Family 13 (9%) 11 (19%) 0 (0%) 2 (4%)
Job opportunities, money 11 (8% ) 3 (5%) 3 (13%) 5 (9%)
Creativity, projects 11 (8%) 6 (10%) 2 (8%) 3 (5%)
and economic incentives. It suggests that while in-
trinsic motivation is paramount, external factors such
as financial benefits and social environment also sig-
nificantly influence one’s pursuit in the field of com-
puting. The comparative analysis of responses to the
question about drivers to computing across the three
personas (P1, P2, P3) for selected categories reveals
the following distribution:
• The category Myself/Curiosity/Passion or per-
sonal interest and creativity is a predominant
driver, especially for P1 and those who transition
to computing later (P2), suggesting that intrinsic
motivation is crucial for this group.
• Family Influence is most prominent in P1, indicat-
ing that early familial support or exposure plays a
significant role in shaping a career in computing
and suggesting that familial factors play a signifi-
cant role in deterring the P3 group from consider-
ing a computing career.
• In Financial Prospects, Persona 2 (P2) is more
represented, which could indicate a perception of
better financial opportunities in computing and
possibly reflect pragmatic considerations in their
decision to transition into computing. The impor-
tance of job opportunities and financial consider-
ations is consistent across personas (however it is
less prominent for P1), reflecting a universal ap-
peal of the field’s practical benefits.
• For Own Projects/Creativity, P1 and P2 show a
notable interest, indicating a draw to computing
for creative and project-based work, especially
Decoding the Gap: A Retrospective Analysis of Women’s Experiences in Software Engineering
231

Table 4: Frequency and percentage of reported obstacles in
computing.
Perception Category All P1 P2 P3
Lack of support, no guidance, discrimination 17 (12% ) 10 (17%) 4 (17%) 3 (5%)
Lack of information/resources, language barriers 16(11%) 7 (12%) 6 (25%) 3 (5%)
Stereotypical surroundings 15 (11% ) 12 (20%) 0 (0%) 3 (5%)
Fear of failing, self-doubt 12(9% ) 6 (10%) 2 (8%) 4 (10%)
Stereotypes about knowledge 12(9%) 4 (7%) 2 (8%) 6 (11%)
Male-dominated environment 10 (7% ) 5 (8%) 2 (8%) 3 (5%)
Time constraints, age-related barriers 9(6%) 2 (3%) 2 (8%) 5 (9%)
Family pressure, societal expectations 8(6%) 5 (9%) 1 (4%) 2 (4%)
among those who transitioned to computing later
in life, and underscoring the importance of inno-
vation and creative freedom in retaining talent in
the field.
3.4 Q4: Obstacles in Computing
The obstacles that participants identified as barriers
to entering or continuing in the field of computing
include a lack of support, insufficient resources, and
stereotypes within the educational and social environ-
ment. Table 4 provides a quantitative summary of
these barriers, indicating the frequency of each ob-
stacle as mentioned by respondents.
This data highlights the multifaceted nature of the
challenges faced by women in computing. It em-
phasizes the need for a supportive environment, ac-
cessible resources, and positive role models to miti-
gate these obstacles and foster a more inclusive atmo-
sphere in the computing domain.
The comparative analysis of responses to the ques-
tion about obstacles in computing across the three per-
sonas (P1, P2, P3) for selected categories reveals the
following distribution:
• Lack of Support are significant obstacles for P1
and P2, with P1 slightly more affected. This sug-
gests that individuals who pursued computing ini-
tially or transitioned later face challenges related
to support systems and P2 prominently as well to
Lack of Information/Resources access.
• Stereotypical Surroundings are particularly high
for Persona 1 (P1) indicating a shared perception
of the computing environment as unwelcoming
or stereotyped, potentially impacting especially
those in computing.
• Worries/Fear of Failing is fairly evenly distributed
across P1 and P3. Highlights the psychological
barriers such as fear of failure and lack of self-
confidence. This could be linked to the challenges
of entering the field and the pressures associated
with it.
Table 5: Suggestions for improving computing education
for girls.
Perception Category All P1 P2 P3
Introduce female role models 10 (7%) 7 (12%) 2 (8%) 1 (2%)
Start technical education early 10 (7%) 4 (7%) 2 (8%) 2 (4%)
Avoid differentiating between boys and girls 7 (5%) 5 (8%) 1 (4%) 1 (2%)
Provide more encouragement 17 (12%) 4 (7%) 1 (4%) 2 (4%)
Offer all-female courses 7 (5%) 4 (7%) 0 (0%) 3 (5%)
Stop promoting stereotypes 7 (5%) 4 (7%) 0 (0%) 3 (5%)
Employ good and inspiring tutors 6 (4%) 4 (7%) 0 (0%) 2 (4%)
Teach useful and problem-solving skills 6 (4%) 3 (5%) 2 (8%) 1 (2%)
3.5 Q5: Improving Computing
Education for Girls
Efforts and suggestions to improve computing educa-
tion for girls range from introducing female role mod-
els to creating a non-discriminatory learning environ-
ment. The data in Table 5 summarizes the frequency
of specific recommendations provided by respondents
to enhance the computing education experience for
girls.
The recommendations underscore the significance
of early exposure, role models, and an inclusive envi-
ronment as key factors for encouraging girls to pursue
and thrive in computing education. The comparative
analysis of responses on how to improve computing
education for girls across the three personas (P1, P2,
P3) for selected categories reveals the following dis-
tribution:
• Female Role Models are equally important for all,
with a notably high representation in P1, indicat-
ing the importance of having relatable figures and
mentors in the field to inspire and guide.
• The emphasis on Starting Early/Teaching Chil-
dren is seen fairly evenly distributed across per-
sonas, suggesting that early exposure to comput-
ing is crucial for those who choose or transition
into the field.
• No Difference Between Boys and Girls and More
Encouragement are highlighted in P1, indicating
the need for a more inclusive and supportive edu-
cational environment.
• All Female Courses and Avoiding Stereotypes
are significant for P1, highlighting the impor-
tance of a non-discriminatory learning environ-
ment. Points to the potential benefits of creating a
comfortable learning environment where girls can
thrive without the pressure of gender dynamics.
• The value of Good Tutors/Teachers is acknowl-
edged in Persona 1 (P1), underscoring the impact
of quality education and mentorship.
Recommendations span from structural changes
like early education and all-female classes to more
nuanced approaches like mentorship and stereotype
CSEDU 2024 - 16th International Conference on Computer Supported Education
232

Table 6: Aspirations with computing skills as indicated by
participants.
Perception Category All P1 P2 P3
Obtain a new or better job 31 (22%) 7 (12%) 3 (13%) 21 (37%)
Start a company 14 (10%) 7 (12%) 3 (13%) 4 (7%)
Engage in IT teaching and clubs 10 (7%) 4 (7%) 2 (8%) 4 (7%)
Work on personal projects with friends 10 (7%) 6 (10%) 0 (0%) 4 (7%)
Develop apps, games, and designs 6 (4%) 1 (2%) 2 (8%) 3 (5%)
Pursue a research career and academic advancement 5 (4%) 4 (7%) 0 (0%) 1 (2%)
dismantling. The variation in suggestions among the
personas indicates different needs and perspectives,
suggesting that a one-size-fits-all approach may not
be effective.
3.6 Q6: Aspirations with Computing
Skills
The aspirations and desires that participants have with
their computing skills are varied and ambitious, they
range from securing a new or better job to starting
their own companies and engaging in research. Ta-
ble 6 details the specific aspirations and the frequency
with which they were mentioned by survey respon-
dents.
This data illustrates a strong connection between
computing skills and personal growth ambitions,
highlighting the empowering nature of technology in
pursuing diverse and meaningful career paths. The
comparative analysis of responses of aspirations with
computing skills across the three personas (P1, P2,
P3) for selected categories reveals the following dis-
tribution:
• The desire for a New/Better Job is particularly sig-
nificant for P3, indicating a strong link between
computing skills and career advancement oppor-
tunities. The high percentage of P3 respondents
looking for job opportunities suggests that many
see computing as a pathway to career improve-
ment.
• The aspiration to Start their Own Company is
more prevalent in P1 and P2, suggesting an en-
trepreneurial spirit among those who transitioned
to computing later in life. P1’s focus on research
and personal projects indicates a deeper engage-
ment with the field, beyond just career advance-
ment. P2’s interest in entrepreneurial and cre-
ative endeavours reflects their motivation to utilize
computing in versatile and innovative ways.
• Teaching IT is mostly aspired to by P2, indicat-
ing a commitment to the field and a desire to con-
tribute to the next generation of computing pro-
fessionals.
• The lack of responses from P2 in Own
Project/Idea Implementation suggests a more tra-
ditional career path, while P1 and P3 show inter-
est in personal and creative projects, indicating di-
verse aspirations in computing.
3.7 Comparative Analysis on Activity
Levels in CS Classroom
The data from the survey indicates that active par-
ticipation in computer science (CS) classrooms is a
strong predictor of continuing to study CS. Among
the different personas, 44% of Persona 1 (P1), who
studied and remained in the field of computing, were
actively participating in class. This percentage is no-
ticeably higher compared to the other groups. In con-
trast, only 31% of Persona 2 (P2), who transitioned
to computing later in life, and 22% of Persona 3 (P3),
who never considered entering computing, were ac-
tively participating. These figures suggest that higher
engagement and active involvement in CS classrooms
are closely linked to sustained interest and pursuit of
studies in the field of computing, highlighting the im-
portance of fostering active learning environments to
encourage continued interest in CS.
The survey reveals a notable correlation between
classroom participation levels and attitudes towards
computer science (CS). Students who were passive
in the CS classroom predominantly exhibited more
negative attitudes toward the subject. This passiv-
ity also aligns with their educational choices: 100%
of these students initially pursued disciplines other
than CS, with only 27% eventually studying CS later.
In contrast, among students who were active partici-
pants in the classroom, the trend differs significantly.
While 63% of these active participants initially stud-
ied a different discipline, a much higher percentage,
73%, chose to study CS later. This contrast under-
scores the potential impact of classroom engagement
on students’ perceptions and career trajectories. Ac-
tive engagement not only fosters a more positive at-
titude towards CS but also seems to influence stu-
dents’ decisions to pivot towards CS studies later in
their academic or professional journey, suggesting the
transformative power of an engaging and inclusive CS
educational environment.
3.8 Comparative Analysis on the Age of
First Computer Use
The data on the age of first computer use across the
different personas (see Table 7) reveals patterns that
offer insights into their early experiences with tech-
nology.
Predominantly, the larger cohorts within Persona
1 and Persona 2, encompassing individuals who ei-
ther remained in computing or transitioned to it later,
Decoding the Gap: A Retrospective Analysis of Women’s Experiences in Software Engineering
233

Table 7: Frequencies for How old were you when you first
used a computer on your own? for different Personas.
P1 P2 P3
More than 14 years 15 (22%) 4 (17%) 10 (18%)
10 to 14 years 12 (17%) 6 (25%) 19 (33%)
7 to 9 years 19 (28%) 10 (42%) 14 (25%)
Less than 6 years 9 (13%) 2 (8%) 5 (9%)
N 59 24 57
encountered computers at a relatively young age, typ-
ically between 7 to 9 years. Nearly half of the respon-
dents within the P1 group (41%) and P2 group (50%)
had their first own experience with computers prior to
the age of 9. Conversely, within Persona 3, comprised
of individuals who never contemplated computing as
an area of interest, merely 34% encountered comput-
ers before the age of 9. Among this subset, the ma-
jority had their first own experience with computers
at an older age, with 18% encountering computers af-
ter surpassing 14 years, and 33% falling within the
age bracket of 10 to 14 years for their initial expo-
sure. These findings suggest a potential correlation
between early exposure to computing and the propen-
sity to sustain interest or pursue a career in this field,
while delayed exposure might diminish the likelihood
of embracing computing as a career or field of study.
Noteworthy is also the relatively high number of
individuals within Personas 1 and 2 who engaged with
computers during the formative years of 10 to 14, in-
dicating that pre-adolescent and early adolescent ex-
posure remains within a pivotal window capable of
fostering enduring interest in computing.
There are fewer individuals across all personas
who used a computer before the age of 6. This might
be due to generational access to technology, as the
youngest age group (less than 6 years old) for early
exposure was less common historically.
Regarding the reasons for first computer usage,
the data suggests that games and creative activities
are the most common entry points across all personas.
However, the use of computers for learning and home-
work also has a notable presence, especially in the
context of schoolwork for Personas 1 and 2.
4 DISCUSSION
This discussion seeks to delve into the nuances of the
survey responses, particularly focusing on differences
in perception and aspirations between current com-
puter science (CS) professionals and those not in the
field, the impact of age on perceptions of CS, and the
implications of terminology on student engagement.
4.1 Perception of Computer Science and
Stereotypes
Our findings reveal a complex landscape of percep-
tions associated with computer scientists. Terms
like ’problem-solving,’ ’diverse,’ and ’contributing to
society’ were frequently mentioned across all Per-
sonas, reflecting a positive view of the field. How-
ever, stereotypes such as ’introversion,’ ’lack of social
skills,’ and ’male dominance’ persistently emerged,
echoing existing literature on the negative impact
of these stereotypes on women’s engagement in CS
(Cheryan et al., 2015; Master et al., 2016, 2021).
The age of respondents appears to influence their
perceptions, with older participants often holding
more traditional views of the field. This could
be attributed to cultural and generational shifts in
how CS is presented and perceived. Moreover, re-
spondents from different professional backgrounds or
study fields showed varied perceptions, suggesting
that exposure and experience significantly shape one’s
view of CS.
Some respondents’ preference for the term ’De-
veloper’ over ’Scientist’ suggests that terminology
may influence interest in the field. This raises the
question of how different terms are used in Ger-
man, such as ’Informatiker/-in’ for computer scientist
and ’Datenwissenschaftler/-in’ for data scientist, and
whether these terms could be affecting student per-
ceptions and potential engagement in CS. Moreover,
it’s worth noting that ’Informatiker’, often equated
with ’Programmierer’ (programmer), might be ap-
pealing to those who are focused on programming.
However, this equivalence can obscure the diverse op-
portunities available in the field, potentially deterring
those who might be more motivated by the applica-
tions of programming than programming itself (Mar-
quardt and Happe, 2023). This highlights the need to
carefully consider how the roles and career paths in
CS are communicated and labelled, as these designa-
tions can either narrow or expand students’ views of
the field’s possibilities.
4.2 Differences Across Age Groups
Our study indicates distinct preferences and inter-
actions with computing across different age groups.
Younger individuals’ affinity for social media and
older respondents’ preference for activities like online
banking reflect evolving technological landscapes and
usage patterns. This variation underscores the impor-
tance of age-specific approaches in CS education and
outreach.
CSEDU 2024 - 16th International Conference on Computer Supported Education
234

4.3 Drivers and Career Choices
Interestingly, those who view themselves or their fam-
ily as the primary motivation (’biggest driver’) are of-
ten already involved in CS. In contrast, those driven
by financial or job prospects tend to be outside the
CS field. This dichotomy raises questions about the
obstacles that deter or facilitate a career in CS and
suggests the need for targeted support and guidance
to help individuals overcome perceived barriers.
4.4 Early Exposure to Computing
A recurring suggestion for improving CS education
was to start early. Previous studies have found, that
girls spend on average less time with computers in
their private time at home than boys (Mumtaz, 2001;
Selwyn et al., 2009). This leads to the question of
whether CS careers are considered by children as
early as kindergarten or elementary school and how
these early career aspirations are formed. This gap
suggests a need for educational materials and initia-
tives that introduce young children to CS in engaging
and accessible ways, akin to resources available for
other professions. It would be interesting to explore if
there are educational materials for young children that
introduce CS careers, similar to those for construction
sites or hospitals.
4.5 Aspirations and Knowledge
Barriers
While many participants aspire to leverage CS skills
for career advancement or entrepreneurship, there is
also a notable interest in teaching IT and participat-
ing in coding clubs. This points to a potential pool of
individuals who, despite having basic CS knowledge,
hesitate to engage due to perceived inadequacies. Ad-
dressing these knowledge barriers could foster a more
inclusive and participatory CS community.
4.6 Methodological Limitations
This study’s reliance on self-reported data and its
cross-sectional design pose limitations. Notably,
there were participants who chose not to respond to
certain open-ended questions. This observation war-
rants an analysis of whether the same respondents
consistently abstained across all questions or if non-
responses were specific to certain queries. Addition-
ally, it is pertinent to consider whether the motivation
to answer free-text questions decreases towards the
end of the survey and how this might affect the data
collected. Furthermore, the self-reported nature of
the data may introduce biases, and the cross-sectional
design precludes causal inferences. Future research
should aim to longitudinally track participants to bet-
ter understand how these factors interact over time to
influence women’s decisions to enter, stay in, or leave
the field of CS.
5 CONCLUSION
The journey toward gender equity in software engi-
neering (SE) is not a mere corrective trajectory to bal-
ance demographic scales; it is a fundamental require-
ment for a robust, dynamic, and innovative digital fu-
ture. This study has illuminated the multifaceted and
often subtle barriers that deter women from partici-
pating in SE. Through a comprehensive analysis, we
have endeavoured to move beyond the surface-level
statistics to understand the deeper currents that influ-
ence women’s decisions regarding SE education and
careers.
Our findings reveal that the underrepresentation of
women in SE is not a simple case of different pref-
erences or inherent disinterest. It is a consequence
of a complex tapestry of societal perceptions, educa-
tional experiences, and entrenched stereotypes. These
factors coalesce to form a daunting barrier that many
women find insurmountable. The stereotype of com-
puting as an isolating and monotonous field, domi-
nated by an unwelcoming male majority, continues to
be one of the significant deterrents for women. How-
ever, the narrative can be changed. Our study points
to the powerful role of early and positive exposure to
computing in shaping perceptions. Educational insti-
tutions and policy-makers have a critical role in in-
tegrating computing into curricula in a way that is
engaging, relevant, and accessible to all students, ir-
respective of gender. By showcasing the versatility,
creativity, and collaborative nature of SE, we can be-
gin to dismantle the outdated stereotypes that cloud
the field. Furthermore, the aspirations of women in
computing—ranging from entrepreneurial ambitions
to social impact projects—highlight the potential loss
to innovation when their talents are not nurtured. En-
couragingly, there is a reservoir of enthusiasm among
women for SE that can be tapped into with the right
support systems and interventions.
In conclusion, the drive toward a more gender-
balanced SE domain should not be pursued out of a
sense of obligation to achieve numerical parity but
from a strategic vision of what a diverse workforce
can accomplish. It is a vision that recognizes the
unique contributions of women to SE, appreciates the
richness that diversity brings to problem-solving, and
Decoding the Gap: A Retrospective Analysis of Women’s Experiences in Software Engineering
235

understands that the future of technology is the bright-
est when it benefits from the talents of the entire pop-
ulation. As we forge ahead, it is imperative that we
commit to creating an environment in SE that is wel-
coming, inclusive, and conducive to the flourishing
of all individuals who wish to be a part of the digi-
tal vanguard. Finally, the power of words in shap-
ing futures cannot be understated: a thoughtful ar-
ticulation of the various roles and career trajectories
in CS/SE, the way these roles are termed and pre-
sented can significantly influence students’ percep-
tions, either limiting or broadening their understand-
ing of their opportunities within the field.
ACKNOWLEDGMENTS
This work has been in part supported by Vector
Stiftung, Project “M
¨
adchen f
¨
ur Informatik begeis-
tern“ at Karlsruhe Institute of Technology (KIT), by
the COST Action CA19122 – European Network for
Gender Balance in Informatics (EUGAIN), and by the
Federal Ministry of Education and Research (BMBF).
We also want to thank Professor Anne Koziolek for
her continuous support and valuable comments in our
discussions.
REFERENCES
Albusays, K., Bjorn, P., Dabbish, L., Ford, D., Murphy-Hill,
E., Serebrenik, A., and Storey, M.-A. (2021). The
diversity crisis in software development. IEEE Soft-
ware, 38(2):19–25.
Armstrong, D. J., Riemenschneider, C. K., and Giddens,
L. G. (2018). The advancement and persistence of
women in the information technology profession: An
extension of Ahuja’s gendered theory of it career
stages. Information Systems Journal, 28(6):1082–
1124.
Cheryan, S., Master, A., and Meltzoff, A. N. (2015). Cul-
tural stereotypes as gatekeepers: Increasing girls’ in-
terest in computer science and engineering by diversi-
fying stereotypes. Frontiers in psychology, page 49.
Fidelman, M. (2012). Here’s the real reason there are not
more women in technology. Available online at URL
https://www.forbes.com/sites/markfidelman/2012/06/
05/heres-the-real-reason-there-are-not-more-women-
in-technology/.
Google (2014). Women who choose computer sci-
ence – what really matters: The critical role
of encouragement and exposure. Available on-
line at URL https://edu.google.com/pdfs/women-
who-choose-what-really.pdf.
Gorbacheva, E., Beekhuyzen, J., vom Brocke, J., and
Becker, J. (2019). Directions for research on gender
imbalance in the it profession. European Journal of
Information Systems, 28(1):43–67.
Happe, L. and Buhnova, B. (2022). Frustrations steering
women away from software engineering. IEEE Soft-
ware, 39(4):63–69.
Happe, L., Buhnova, B., Koziolek, A., and Wagner, I.
(2021). Effective measures to foster girls’ interest
in secondary computer science education. Education
and Information Technologies, 26(3):2811–2829.
Joshi, K., Trauth, E., Kvasny, L., and McPherson, S. (2013).
Exploring the differences among it majors and non-
majors: Modeling the effects of gender role congruity,
individual identity, and it self-efficacy on it career
choices. In Proceedings of Frontiers in Education:
Computer Science and Computer Engineering.
Lorenzo, R., Voigt, N., Tsusaka, M., Krentz, M., and
Abouzahr, K. (2018). How diverse leadership teams
boost innovation. Boston Consulting Group, 23:112–
134.
Marquardt, K. and Happe, L. (2023). Saving bees with com-
puter science: a way to spark enthusiasm and interest
through interdisciplinary online courses. In Proceed-
ings of the 28th ACM Conference on Innovation and
Technology in Computer Science Education.
Marquardt, K., Wagner, I., and Happe, L. (2023). Engaging
girls in computer science: Do single-gender interdis-
ciplinary classes help? In ICSE ’23: Proceedings of
the 45th International Conference on Software Engi-
neering Association for Computing Machinery, New
York, NY, United States. accepted.
Master, A., Cheryan, S., and Meltzoff, A. N. (2016). Com-
puting whether she belongs: Stereotypes undermine
girls’ interest and sense of belonging in computer sci-
ence. Journal of educational psychology, 108(3):424.
Master, A., Meltzoff, A. N., and Cheryan, S. (2021). Gen-
der stereotypes about interests start early and cause
gender disparities in computer science and engineer-
ing. Proceedings of the National Academy of Sciences,
118(48):e2100030118.
Mumtaz, S. (2001). Children’s enjoyment and perception of
computer use in the home and the school. Computers
& Education, 36(4):347–362.
Rodr
´
ıguez-P
´
erez, G., Nadri, R., and Nagappan, M. (2021).
Perceived diversity in software engineering: a system-
atic literature review. Empirical Software Engineer-
ing, 26:1–38.
Selwyn, N., Potter, J., and Cranmer, S. (2009). Primary
pupils’ use of information and communication tech-
nologies at school and home. British journal of edu-
cational technology, 40(5):919–932.
CSEDU 2024 - 16th International Conference on Computer Supported Education
236
