
PreSTyDe: Improving the Performance of within-project Defects
Prediction by Learning to Classify Types of Software Faults
Gabriela Czibula
a
, Ioana-Gabriela Chelaru
b
, Arthur Molnar
c
and Istvan Gergely Czibula
d
Department of Computer Science, Babes¸-Bolyai University, Cluj-Napoca, Romania
Keywords:
Software Defect Prediction, Machine Learning, Unsupervised Learning, Deep Neural Network.
Abstract:
Software defect prediction (SDP) is an important task within software development. It is a challenging activity,
as the detection of software modules that are prone to malfunction in new versions of software contributes to
an improved testing process and also increases the quality of the software. In this paper, we propose a two-
stage hybrid approach for predicting the error-proneness of the application classes in an upcoming version of
a software project by employing a taxonomy of defects unsupervisedly uncovered from the previous software
releases. The first stage of the proposed approach consists of an unsupervised labelling of software defects
from the available versions of the analysed software system. During the second stage, a supervised classifier
is used to predict the error proneness during the software project’s evolution employing the taxonomies of
defects uncovered in the previous stage. Experiments carried out with Calcite software in a SDP scenario
within a project highlighted that the performance of predicting software defects during a project evolution
increases by approximately 5%, in terms of the average Area under the Receiver Operating Characteristic
curve, by developing predictors for different classes of software defects.
1 INTRODUCTION
Software defect prediction (SDP) represents an active
research area in the search-based software engineer-
ing field, being an important task within software de-
velopment. With the current expansion of the pro-
gramming industry, SDP is receiving increased atten-
tion from the scientific community. Software defects
are errors such as logic or implementation faults that
can cause the system to behave incorrectly or pro-
duce erroneous results. Thus, the detection of soft-
ware modules that are prone to malfunction in new
versions of software contributes to an improved test-
ing process and also increases the quality of the soft-
ware. SDP is helpful in process management and to
improve software maintenance and evolution.
As SDP provides us with difficult learning con-
texts, most models may not be suitable for such a
task. Firstly, the principal characteristic of SDP is
that we are given a codebase, along with its track-
ing history of issues and bugs, and we are required
to detect software bugs in the code of other reposito-
a
https://orcid.org/0000-0001-7852-681X
b
https://orcid.org/0000-0002-9274-6349
c
https://orcid.org/0000-0002-4113-2953
d
https://orcid.org/0000-0003-0076-584X
ries, follow the evolution of the system, and suggest
revisions, with the final goal of having integrated such
intelligent algorithms into our daily IDEs. Secondly,
most software project releases have very few bugs,
thanks to quality control; therefore, the defect class
is considerably under-represented. That may result in
classifiers that simply return the majority (non-defect)
class, without analysing the data at all, and having
very high accuracy despite poor precision and recall
values. However, Machine learning (ML) is still an
effective tool for complex classification tasks. Fur-
thermore, more sophisticated deep learning (DL) has
consistently had groundbreaking improvements in re-
cent months. Two main directions have been investi-
gated in the field of SDP (Wang et al., 2016). As a first
line of research, the performance of machine learn-
ing techniques has been intensively investigated. In
terms of binary classifiers proposed to detect software
faults, there is a wide range of approaches, from con-
ventional ML predictors (Linear Regression, Deci-
sion Trees, Artificial Neural Networks, Support Vec-
tor Machines, Ensemble Learning (Zhou et al., 2022))
to recurrent neural networks (RNNs) (Pachouly et al.,
2022) and DL models (Miholca et al., 2022).
In SDP, another direction of great interest for the
research community concerns the input features. Re-
214
Czibula, G., Chelaru, I., Molnar, A. and Czibula, I.
PreSTyDe: Improving the Performance of within-project Defects Prediction by Learning to Classify Types of Software Faults.
DOI: 10.5220/0012732300003687
Paper published under CC license (CC BY-NC-ND 4.0)
In Proceedings of the 19th International Conference on Evaluation of Novel Approaches to Software Engineering (ENASE 2024), pages 214-225
ISBN: 978-989-758-696-5; ISSN: 2184-4895
Proceedings Copyright © 2024 by SCITEPRESS – Science and Technology Publications, Lda.

cent feature engineering literature reveals many ap-
proaches proposed to learn features from software ar-
tifacts through DL models: Deep Belief Networks
(Wang et al., 2016), Convolutional Neural Networks
(CNNs) (Li et al., 2017), Long-Short Term Neural
Networks , CNNs combined with Graph Neural Net-
works (Zhou et al., 2022), etc.
Although having the upper hand in feature ex-
traction, DL models can still struggle to classify im-
balanced data, and therefore one-class classification
(OCC) adapted ML models were also investigated as
a possible solution to improve defect prediction qual-
ity. Even if one-class predictive models are employed
in the ML literature to address various unbalanced
classification tasks, the literature on the use of OCC
models for SDP is still scarce (Chen et al., 2016)
(Moussa et al., 2022) (Ciubotariu et al., 2023) and the
results are not reliable. One-class SVM (OCSVM)
models trained on one class of instances (defective
or non-defective) were investigated in various SDP
scenarios and data sets, but the results revealed poor
performance mainly for the within-project scenario
(Ciubotariu et al., 2023) (Moussa et al., 2022). The
binary classifiers such as Random Forest finetuned
seem to still have a better performance than the OCC
models. Recently, (Zhang et al., 2022) proposed the
ADGAN-SDP model for anomaly detection based on
Bidirectional Generative Adversarial networks. The
proposed model was trained on non-defects, and it
was designed to capture relevant features for the
non-faulty class. The results show that GAN-based
models achieve good results, provided that there are
enough training data samples.
Besides the data imbalancement problem, which
significantly affects the performance of supervised
classifiers, another important issue in SDP is related
to the feature-based representation of the software en-
tities (modules, classes, components, etc.). In most
open source data sets used in the SDP literature (data
sets from public repositories such as NASA (Shep-
perd et al., 2018) or SeaCraft (Menzies et al., 2017)),
software metrics are used to characterise the software
entities, and these data sets may not be appropriate for
training models that must perform in real-world sce-
narios. Recent studies in the SDP literature (Miholca
et al., 2022) highlighted that features extracted from
the source code may be more relevant to distinguish
between faults and non-faults. Another important is-
sue revealed by (Czibula et al., 2023) is that, while
defects can be of various types (e.g. numeric errors,
pointer issues, security vulnerabilities, etc.) and it is
very likely that each defect type has its own prop-
erties, existing SDP approaches consider all defect
types together and try to come up with a universal de-
fect prediction model. By considering specific types
of defects, it is very likely to increase the specificity
of defect predictors, as we may expect that specific
classes of faults could have common characteristics.
The current research starts from our previous find-
ings (Czibula et al., 2023) in which we emphasised
that specific types of software defects have particular
behaviours and introduced, as a proof of concept, an
unsupervised learning (UL) based approach for min-
ing behavioural patterns for specific classes of soft-
ware defects. In this paper, we make a further step
towards our broader goal of developing defect predic-
tors for particular defect types by introducing, as a
proof of concept, a two-stage hybrid approach named
PreSTyDe (Predictor for Specific Types of Defects) to
validate our hypothesis that the performance of pre-
dicting software defects during software project evo-
lution (within-project SDP scenario) would improve
by developing predictors for specific classes of soft-
ware defects. The first stage of the proposed approach
consists of an unsupervised labelling of software de-
fects from the available versions of the analysed soft-
ware system. Then, a supervised classifier is used to
predict the error proneness of the software entities in
an upcoming version of the software project by em-
ploying the taxonomy of defects unsupervisedly un-
covered from the previous versions. Experimental
evaluation is carried out with Apache Calcite (Begoli
et al., 2018) software, an open source framework for
data management. To the best of our knowledge, our
proposed approach is new in the SDP literature. In
summary, in this paper we aim to answer the follow-
ing research questions:
RQ1. Could the performance of predicting the error-
proneness of the software entities in a spe-
cific version of a software project be enhanced
by employing a taxonomy of defects unsuper-
visedly uncovered from the previous software
versions?
RQ2. Does the proposed approach result in im-
proved software defect prediction performance
in the case of a complex, open-source applica-
tion?
The response to RQ1 and RQ2 will help guide
the effort to create more specific SDP models for real
life software projects and give an insight into the va-
lidity of our assumption that more performant SDP
models can be developed if the models are more spe-
cific to a set of defect types. Such models developed
for specific defect types may be better customized
to express the specificity of different types of de-
fects, which may require different kind of informa-
tion from the software system to be used as input into
the model. For instance, for defects related to some
PreSTyDe: Improving the Performance of within-project Defects Prediction by Learning to Classify Types of Software Faults
215

arithmetic overflow, the model should be fed with in-
struction and expression level information from the
source code, while if the defects are related to some
incorrect/ambiguous specification, the model should
use the specifications and comments from the code or
other sources as input for the model.
The remainder of the paper is organised as fol-
lows. Section 2 introduces the PreSTyDe approach
and the methodology employed. Section 3 presents
our case study used to assess the performance of
PreSTyDe, then the experimental results and research
findings are presented, discussed, and compared with
related work in Section 4. Section 5 discusses the
threats to the validity of the study, while Section 6
presents directions to further extend our current work.
2 METHODOLOGY
We introduce the PreSTyDe two-stage hybrid ap-
proach for predicting the error-proneness during a
software project’s evolution employing a taxonomy of
software defects learnt from the available releases of
the software. Even if the literature contains several
defect type classifications and taxonomies (e.g., the
Orthogonal Defect Classification proposed by IBM,
Defect Origins, Types and Modes proposed by HP or
IEEE Standard Classification for Software Anoma-
lies), none of these taxonomies became widely ap-
plied in practice (Wagner, 2008) or employed in the
SDP research literature. In addition, labelling defects
according to such taxonomies is not a common prac-
tice in the industry yet.
As the results of existing SDP research have not
been adopted within the industry, it is clear that the
state of the art can be further improved. Thus, instead
of employing an existing taxonomy of software de-
fects, we propose learning such a taxonomy of faults
from the available releases of the analysed software
project. Such an approach of uncovering, through un-
supervised learning, the taxonomy of defects specific
to a certain software project may offer higher flexibil-
ity and may increase the SDP performance.
Empirical studies have shown that the frequency
of software defects and their type can differ between
applications. In a study that focused on server-side
software, (Sahoo et al., 2010) showed differences
between the types of defects encountered in several
popular open-source applications. Three open-source
GUI-driven applications were statically analysed in
(Molnar and Motogna, 2020), with the authors con-
cluding that over the lifetime of the target appli-
cations, defect prevalence and distribution remained
application-specific.
2.1 Problem Statement and
Formalisation
In the general SDP task formalised as a binary clas-
sification problem, two target classes are given: the
class of software defects (the positive class, labelled
as 1) and the class of non-defects (the negative class,
labelled by 0). The goal of a supervised defect predic-
tor is to build a classifier (from a training data set of
software entities labelled with 0 or 1) capable of pre-
dicting if a certain software entity is likely to belong
to a positive or negative target class.
Let us consider an object-oriented software sys-
tem S having multiple versions S
V
1
,S
V
2
...S
V
k
, with
V
k
, k ̸= 1 being the current software version un-
der development. We assume that for previous
software versions V
1
,V
2
···V
k−1
historical data D =
{D
V
1
,D
V
2
...D
V
k−1
} is available, where D
V
j
, 1 ≤ j ≤
k −1 consists of software entities (application classes,
in our approach) from S
V
j
labelled with their class
(defective - positive or non-defective - negative). In
our approach, a label of 0 is assigned to the negative
class, while the positive class is labelled as 1.
In the data sets D
V
j
, ∀1 ≤ j ≤ k − 1, each applica-
tion class from the j-th version of S (S
V
j
) is charac-
terised by a set of m features considered to be relevant
for discriminating between the defective and non-
defective application classes. Thus, each application
class c ∈ D
V
j
is represented as an m-dimensional nu-
merical vector c = (c
1
,...,c
m
), where c
i
(∀1 ≤ i ≤ m)
represents the value of the feature f
i
computed for the
application class c.
Our approach consists of two main stages. During
the first stage, a clustering algorithm is applied to soft-
ware defects from previous versions V
1
,V
2
,··· ,V
k−1
of the analysed software system and the software de-
fects will be labelled according to the identified par-
tition {P
1
,...,P
nc
}. Then, a supervised classifier is
used to predict the proneness to errors of the soft-
ware entities in the current version V
K
of the software
project by employing the taxonomy of defects unsu-
pervisedly uncovered at the previous stage. There-
fore, the goal of our formalised SDP task as a multi-
class classification problem is to determine (from the
available training data D ) an approximation
ˆ
f of the
function f : D
V
k
→ {0,1,...,nc} that will assign for
each application class c ∈ S
V
k
the label 0 if c is not
error-prone and the label i (i ∈ [1,nc]) if c belongs to
the type of defects represented by the cluster P
i
.
2.2 Data Representation
As previously shown in Section 2.1, the application
classes are represented as vectors of high-dimensional
ENASE 2024 - 19th International Conference on Evaluation of Novel Approaches to Software Engineering
216

real-valued features. Existing approaches from the
SDP literature reveal that these feature vectors may
express structural characteristics of the software en-
tities through software metrics or conceptual charac-
teristics directly extracted from the source code.
The feature-based representation employed in our
approach is motivated by recent work (Miholca et al.,
2022) which emphasised that conceptual-based fea-
tures unsupervisedly learnt from the source code are
more informative than structural-based ones, those
based on software metrics. The extensive perfor-
mance evaluation conducted by (Miholca et al., 2022)
on all releases of Apache Calcite software revealed
that natural language-based models such as Doc2Vec
(Le and Mikolov, 2014) and Latent Semantic Index-
ing (LSI) (Deerwester et al., 1990) are capable of pro-
viding semantic features that are suitable for discrim-
inating between faulty and non-faulty software enti-
ties. Both models, Doc2Vec and LSI, are used by
(Miholca et al., 2022) to represent the source codes
as numeric vectors of a predefined length to cap-
ture the semantic characteristics of the code. Fur-
thermore, the concatenation of Doc2Vec and LSI rep-
resentations (further denoted as Doc2Vec+LSI) pro-
vided higher predictive performance than when using
only Doc2Vec or LSI semantic representations.
Consequently, the vectorial representation
(c
1
,...,c
ℓ+p
) of an application class c is obtained
by concatenating the ℓ-dimensional conceptual
vector representing c in the Doc2Vec space with the
p-dimensional conceptual vector representing c in
the LSI space.
2.3 Building the PreSTyDe Classifier
As discussed in Section 2.1, PreSTyDe is a hybrid
classifier which is trained on historical data D =
{D
V
1
,D
V
2
...D
V
k−1
} available in versions 1, 2, . ..,k −
1 of the software system under analysis in two stages,
an unsupervised classification stage followed by a su-
pervised classification one.
Unsupervised classification stage. During this stage,
a k-means clustering algorithm is applied on the set
De f of defective instances from the set
k−1
[
i=1
D
V
i
. We
chose the k-means method for determining groups
of defective application classes due to its ability to
minimise the distance between the defective instances
within a group, but also due to its high flexibility and
quick prototyping.
The number nc of clusters used in k-means is cal-
culated using the Elbow method (Shi et al., 2021). To
further validate the results we obtained with the El-
bow method, we also employed the Silhouette score
(Shi et al., 2021). After the optimal number of clus-
ters (nc) was determined in the defective instances
data set, the clustering step was performed using the
k-means algorithm. After determining the partition
P
1
,P
2
,...,P
nc
of software defects, the defective in-
stances of De f are relabelled with labels 1,2,...nc so
that all the defects from partition P
j
(1 ≤ j ≤ nc) will
be labelled with j. After this relabelling stage, the de-
fective application classes of D which initially were
labelled as 1 (defective) will now have multiple labels
(from 1 to nc). This multi-class labelling of software
defects suggests that instead of identifying all defects
as a whole, the defects are split into categories which
may represent specific types of faults. We note that
the relabelling procedure is applied only for the de-
fective instances; thus, all the non-defective instances
from the D remain with their initial label (i.e., 0).
Denoting by P
0
the set of non-defective applica-
tion classes, the unsupervisedly uncovered partition
of D is {P
0
,P
1
,...,P
nc
}, such that D =
nc
[
i=0
P
i
. In this
partition, the set P
0
corresponds to non-faulty appli-
cation classes, while P
i
(1 ≤ i ≤ nc) each represent a
specific type of defect.
Supervised classification stage. The goal of this
stage is to build a multi-class classification model
classi f ier which, for a new application class ex-
pressed as a conceptual feature vector in the concate-
nated Doc2Vec and LSI space (as shown in Section
2.2) will be able to predict a class from {0, 1, . . . , nc}
(0 representing non-defect, and c ∈ {1,...,nc} repre-
senting a specific type of software defect).
The prediction model classi f ier may be: (1) a
multi-class classification model (e.g., deep neural net-
work, support vector machine, etc) trained on the re-
labeled data set D in which the labels of the defec-
tive entities are updated according to the unsupervised
learning stage; and (2) the previously uncovered clus-
tering model itself (thought as an online clustering
model), in which the new instance (application class)
will be assigned to the cluster P
i
(1 ≤ i ≤ nc ) which is
the most similar to it (considering a specific distance
metric) and thus labeled with i.
The algorithmic description of the training step of
PreSTyDe is given in Algorithm 1.
3 CASE STUDY
The case study proposed in our work targets Apache
Calcite, an open-source framework for data manage-
ment. Its use as a case study target is relatively new,
being introduced by (Herbold et al., 2022) and em-
ployed in recent SDP researches (Ciubotariu et al.,
PreSTyDe: Improving the Performance of within-project Defects Prediction by Learning to Classify Types of Software Faults
217

Algorithm 1: The training stage of PreSTyDe.
Function Training(D) is
Input: D = D
V
1
,D
V
2
...D
V
k−1
the training data set in the form (c, ℓ
c
) - c is an application class
represented as a conceptual numerical vector in the concatenated Doc2Vec and LSI space (see
Section 2.2) and ℓ
c
∈ {0, 1} is c’s label (0: non-defect; 1 - defect).
Output: the classification model PreSTyDe
/* Stage 1. Unsupervised classification stage */
/* Determine the subset De f of defective application classes from D */
De f ← {(c|c ∈
k−1
[
i=1
D
V
i
, ℓ
c
= 1} /* Determine a partition P = {P
1
,P
2
,...,P
n
c} of De f using
the k-means clustering method */
nc ←ElbowMethod(De f )
P ←k-means(De f , nc)
/* Extend the partition with the cluster of non-defective application classes */
P
0
← {(c|c ∈
k−1
[
i=1
D
V
i
, ℓ
c
= 0}
/* Recompute the labels of the defective instances from D according to the
identified partition P */
for i ← 1, nc do
for c ∈ P
i
do
ℓ
c
← i
end
end
/* Stage 2. Supervised classification stage */
/* Build a multi-class classifier on the training data set D */
PreSTyDe←buildClassifier(D)
Training←PreSTyDe
EndFunction
2023) (Czibula et al., 2023) (Briciu et al., 2023). In
the original data set (Herbold et al., 2022), there are
16 releases of the Calcite software (from 1.0.0 to
1.15.0). Application classes from each version are
characterised by the values of 4189 software metrics
(such as static code metrics, metrics extracted from
the Abstract Syntax Tree representation of the source
code, code churn metrics), and a binary label indicat-
ing whether the class was identified as being defective
or not. This identification was done via a modified
version of the SZZ algorithm, designed to work with
the JIRA issue tracking system, together with manual
data validation in order to establish the ground truth
(Herbold et al., 2022).
We note very high data imbalancement (number of
defective software entities vs. number of non-defects)
for all Calcite versions: the defective rates range from
0.033 (for version 1.15.0) to 0.166 (for version 1.0.0).
The total number of defective application classes in
all Calcite versions is 1577.
As highlighted in Section 2.2, the relevance of
the feature set employed for characterizing the ap-
plication classes is of major importance in our SDP
task, as these features will have an impact on the
PreSTyDe model and its ability to create a good sep-
aration boundary between the class of defective and
non-defective software entities. Starting from the re-
search findings of (Miholca et al., 2022), we aim to
use conceptual-based features for capturing semantic
characteristics of source code instead of the classical
features expressed through software metrics.
For a better understanding of the structural and
conceptual feature-based representation of the defects
from all the Calcite releases we depict in the 2D
visualization of a self-organizing map (SOM) (Cz-
ibula and Czibula, 2012) unsupervisedly trained on
the defective software application classes represented
as software metrics (left side image of Figure 1) and
conceptual features (right side image of Figure 1) pro-
posed by (Miholca et al., 2022).
For visualizing the SOMs from Figure 1 the U-
Matrix (L
¨
otsch and Ultsch, 2014) method was em-
ployed. The adjacent neurons from the map are
coloured based on their distance in the 2D output
ENASE 2024 - 19th International Conference on Evaluation of Novel Approaches to Software Engineering
218

Figure 1: 2D visualisation of the set De f of software defects from all 16 Calcite releases visualized using a SOM: using the
software metrics-based features proposed by (Herbold et al., 2022) (left side image), and semantic vectors extracted using
Doc2Vec+LSI (right). Darker areas represent clusters of similar instances while lighter areas express cluster separators.
space. In our visualization, we employed a darker
colouring for neurons that correspond to input in-
stances whose vectors are close in the input space
and thus darker regions express clusters of similar in-
stances. Lighter areas represent larger distances be-
tween the neurons and thus express separation bound-
aries between the clusters. The visualizations from
Figure 1 highlight that the conceptual feature-based
representations in Doc2Vec+LSI spaces are the most
informative, being able to distinguish more than two
groups (types) of defective application classes. On
the SOM built considering the software metrics-based
representation (left image) we observe two clusters
of software defects, while the semantic representation
reveals about five groups. Based on this observation
and the literature results, the combined Doc2Vec and
LSI representations proposed and used by (Miholca
et al., 2022) for the software application classes will
be further employed in our study.
In order to help replicate our study, we made our
data set and analysis source code publicly available at
(Chelaru, 2024).
Experiment. We describe below the experiment used
as a proof of concept for assessing the predictive per-
formance of the PreSTyDe classifier on the previously
described Calcite data set. Let us consider the data
set D of all (defective and non-defective) application
classes from all 16 Calcite releases, represented as
real-valued vectors in the Doc2Vec+LSI space. In our
experiment we opted for exactly the same represen-
tations as those employed in the related work paper
in order to allow a more accurate comparison with
the results of (Miholca et al., 2022). Thus, the con-
catenated Doc2Vec+LSI representation is of length 60
(a dimensionality of 30 for the vectors extracted us-
ing both Doc2Vec and LSI). As shown by (Miholca
et al., 2022), the Doc2Vec and LSI representations
were extracted using the Gensim library (
ˇ
Reh
˚
u
ˇ
rek and
Sojka, 2010), while the corpora used for training the
Doc2Vec and LSI models consisted of the source code
with comments but without operators, special sym-
bols, English stop words or Java keywords.
The data set D = De f
S
NonDe f consists of
19571 application classes, from which 1577 are de-
fective (the set De f , with instances labeled with 1)
and 17994 are non-defective (the set NonDe f , with
instances labeled with 0). We note that the defective
class is severely outnumbered by the non-defective
one, thus revealing an extreme data imbalancement
(a defective rate of 8.06%).
Following the methodology introduced in Sec-
tion 2, we present the two main stages to build the
PreSTyDe classifier: the unsupervised classifica-
tion stage followed by the supervised classification
stage which also includes the performance evaluation
methodology.
Unsupervised classification stage. As described in
Section 2.3, the first step before applying the k-means
classification method to the set of defects De f of all
Calcite versions is to determine the optimal number
nc of clusters using the Elbow method (Shi et al.,
2021). Figure 2 is a visual representation of the elbow
score applied to the set of defective instances. This
method determines the optimal number of clusters
by identifying the point at which the sum of squares
within the cluster starts to decrease at a slower rate,
similar to an “elbow” in the plot.
To further validate these findings, we also em-
ployed the Silhouette method, as seen in Figure 3,
which measures how well defined and separated the
clusters are, helping to identify an optimal number
of clusters when the elbow point in the within-cluster
sum of squares plot is ambiguous. Having the confir-
mation of this second test, we move further with the
division into 5 clusters.
After determining the optimal number of clusters
in the defective instances data set (nc = 5), the cluster-
ing step was performed using the k-means algorithm
from the scikit-learn library, which partitions the data
set into k clusters, in our case 5, by iteratively assign-
PreSTyDe: Improving the Performance of within-project Defects Prediction by Learning to Classify Types of Software Faults
219
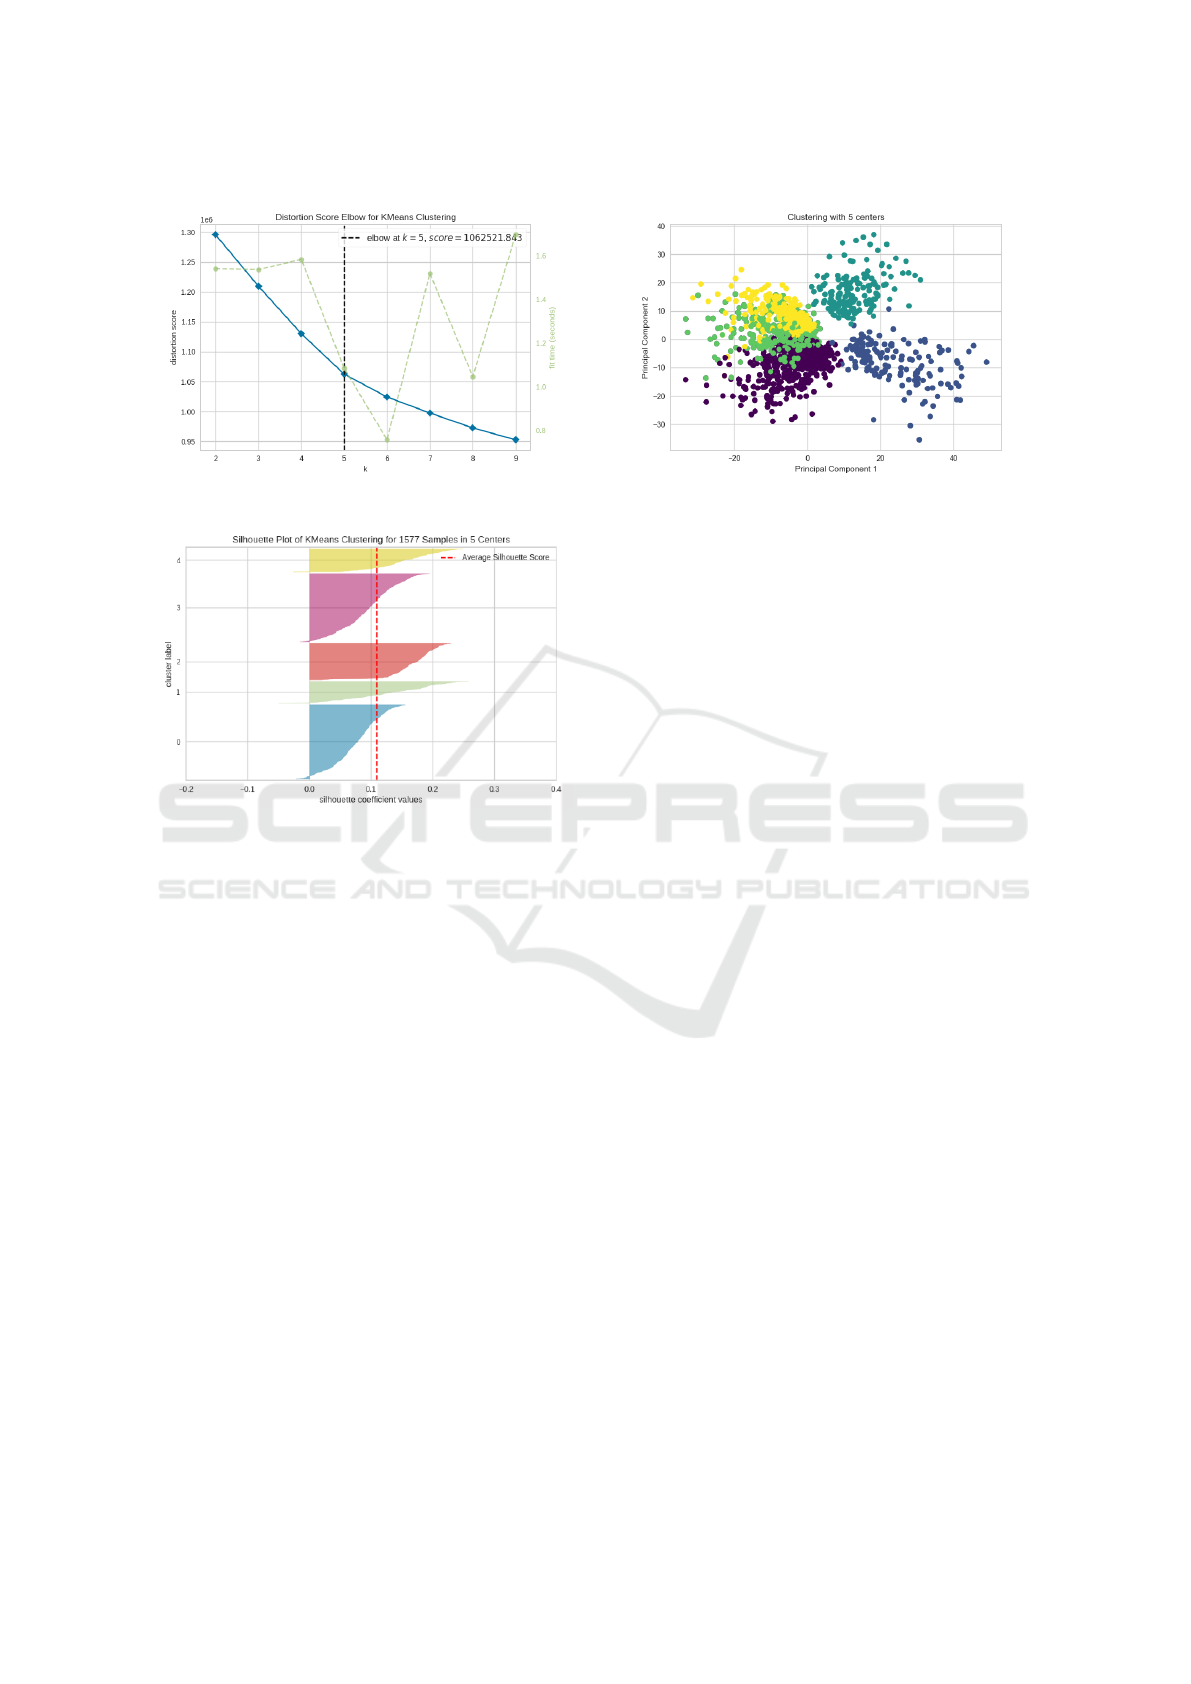
Figure 2: Elbow score applied to the set of bugs.
Figure 3: Silhouette score applied to the set of bugs.
ing data points to the nearest cluster centroid and up-
dating the centroids to minimise the sum of squares
within the cluster; this process continues until con-
vergence. Figure 4 presents a 2D visualisation of the
five clusters. The figure was constructed using the
Principal Component Analysis (PCA) dimensionality
reduction technique, which allowed us to reduce the
number of data features, but retain as much informa-
tion as possible. We observe that there is no clear
delimitation between all clusters, and this may be due
to the vectorial representation of the data.
After the set De f of defects was partitioned in 5
clusters using the k-means method, the labels of the
defective application classes from D are changed ac-
cording to the identified partition, i.e., the label of all
software defects from the i-th cluster (i = 1,2,3,4,5)
is changed to i.
Supervised classification stage. We describe the su-
pervised classification stage used to assess our initial
assumption that it would be more easy to differentiate
the non-defects from a specific type of software faults
than from the entire set of software faults.
Thus, for each cluster of defects cl ∈
{P
1
,P
2
,...P
nc
}, our goal is to train a deep neu-
ral network (DNN) model M
i
able to differentiate
Figure 4: 2D visualisation of the 5 uncovered clusters. PCA
is applied for dimensionality reduction.
the specific class of defects P
i
from the set NonDe f
of non-defects. Inspired by the inherent process of
software evolution, M
i
will be trained only on the
application classes (from P
i
and NonDe f ) from the
first 10 software releases (1.0.0 to 1.9.0) and tested
on those instances (from P
i
and NonDe f ) that belong
to the last software releases (1.10.0 to 1.15.0).
The DNN is based on the keras library and com-
prises an input layer of 60 input features, two hid-
den layers employing ReLU activation, and a sigmoid-
activated output layer. An additional dropout layer
with a dropout rate of 0.2 was incorporated for regu-
larisation. The loss function chosen is binary cross-
entropy, optimised with the Adam optimiser having a
learning rate of 0.001. Training spans 15 epochs with
a batch size of 16, accompanied by the use of class
weights to address class imbalance.
To find the optimal configuration for our model,
we performed hyperparameter tuning experiments
using GridSearchCV, exploring learning rates, the
number of hidden layers and neurons per layer, the
number of epochs, and batch sizes.
Performance evaluation. The performance of each
M
i
model trained as previously described will be com-
pared with the performance of a DNN model M
all
trained on releases 1.0.0 to 1.14.0 to differentiate the
entire set De f of defective application classes from
the set of non-defective ones NonDe f . The testing of
M
all
is performed, as for the models M
i
, on version
1.15.0. If the performance of M
i
will be higher than
the performance of M
all
then our initial hypothesis
stands. For a more accurate performance evaluation.
M
all
will be trained/tested using the same methodol-
ogy as the individual M
i
models.
Once the binary classification models
(M
all
,M
1
,M
2
,...,M
nc
) were trained, their per-
formance on the testing set (Calcite version 1.15.0) is
evaluated using the following performance measures:
Sensitivity (Sens) - the true positive rate of the
ENASE 2024 - 19th International Conference on Evaluation of Novel Approaches to Software Engineering
220
classifier (also known as recall or probability of
detection); Specificity (Spec) - the true negative rate
of the classifier Area under the ROC curve (AUC) -
considered among the best metrics for performance
evaluation in SDP (Fawcett, 2006), is computed as
the average between the specificity and sensitivity
values; Weighted F1 score (W F1) - computed as
the weighted average of the F1-scores for the defect
and non-defect classes; Average Area under the
Precision-Recall curve (Avg AU PRC) - computed
as the average between the AUPRC value of the
positive and negative class. Matthews Correlation
Coefficient (MCC) - an evaluation metric used in the
ML literature mainly for imbalanced classification.
All the evaluation measures should be maximised
in order to obtain better defect predictors. MCC range
in [-1,1], while the other measures range in [0,1].
4 RESULTS AND DISCUSSION
We present the results of the experiment described in
Section 3 conducted on the Apache Calcite software
for answering RQ1 in what concerns the performance
of the PreSTyDe classifier.
As presented in Section 3, for each cluster of de-
fects identified in all 16 Calcite releases, we train
a DNN-based model M
i
(1 ≤ i ≤ 5) for separating
P
i
from the set NonDe f of non-defects as well as a
DNN model M
all
trained to differentiate the entire set
of defects (De f ) from the set of non-defective ones
NonDe f . Each of the learning models is trained on all
application classes from Calcite releases 1.0.0-1.9.0,
while the testing set consists of the instances from
Calcite versions 1.10.0-1.15.0. The decision to divide
the data set as such is based on two facts: first, we
wanted to follow the evolution of the project; there-
fore we trained our model on early releases and used
the latest versions possible for testing, but also had
to include entities from all the uncovered clusters in
both training and testing.
Table 1 presents, for each of the evaluated learn-
ing models (M
1
,M
2
,...,M
5
and M
all
) the number of
defects from the testing data, the obtained confusion
matrix together with the values for the performance
metrics employed. We note that the testing data sets
for each of the models contains 7595 non-defective
instances (non-defects from releases 1.10.0-1.15.0).
A first issue that should be noted (as revealed by
the results from Table 1) is that the difficulty of clas-
sification increases when attempting to distinguish a
specific class of defects (clusters P
1
-P
5
) from the class
of non-defective instances. This was to be expected,
due to a more severe data imbalancement for train-
ing the models M
1
-M
5
(significantly smaller number
of defects, as depicted in the last column of the ta-
ble) which makes it more difficult for the classifier to
recognize the minority class.
To mitigate this issue of data imbalancement and
reduce the bias of the classifier towards the non-
defective class, weights were used during the train-
ing. Nevertheless, classifiers M
1
-M
5
have a false neg-
ative rate (FNRate) higher with more than 20% than
the false negative rate of M
all
. The higher values of
the FNRate reveal that more defects are misclassified
by M
1
-M
5
than by M
all
which lead to lower positive
predictive values (PPVs) - precision values for the de-
fective class. This is also reflected in the sensitivity
of the classifiers: M
all
has a higher sensitivity value
(0.482) than all classifiers M
1
-M
5
.
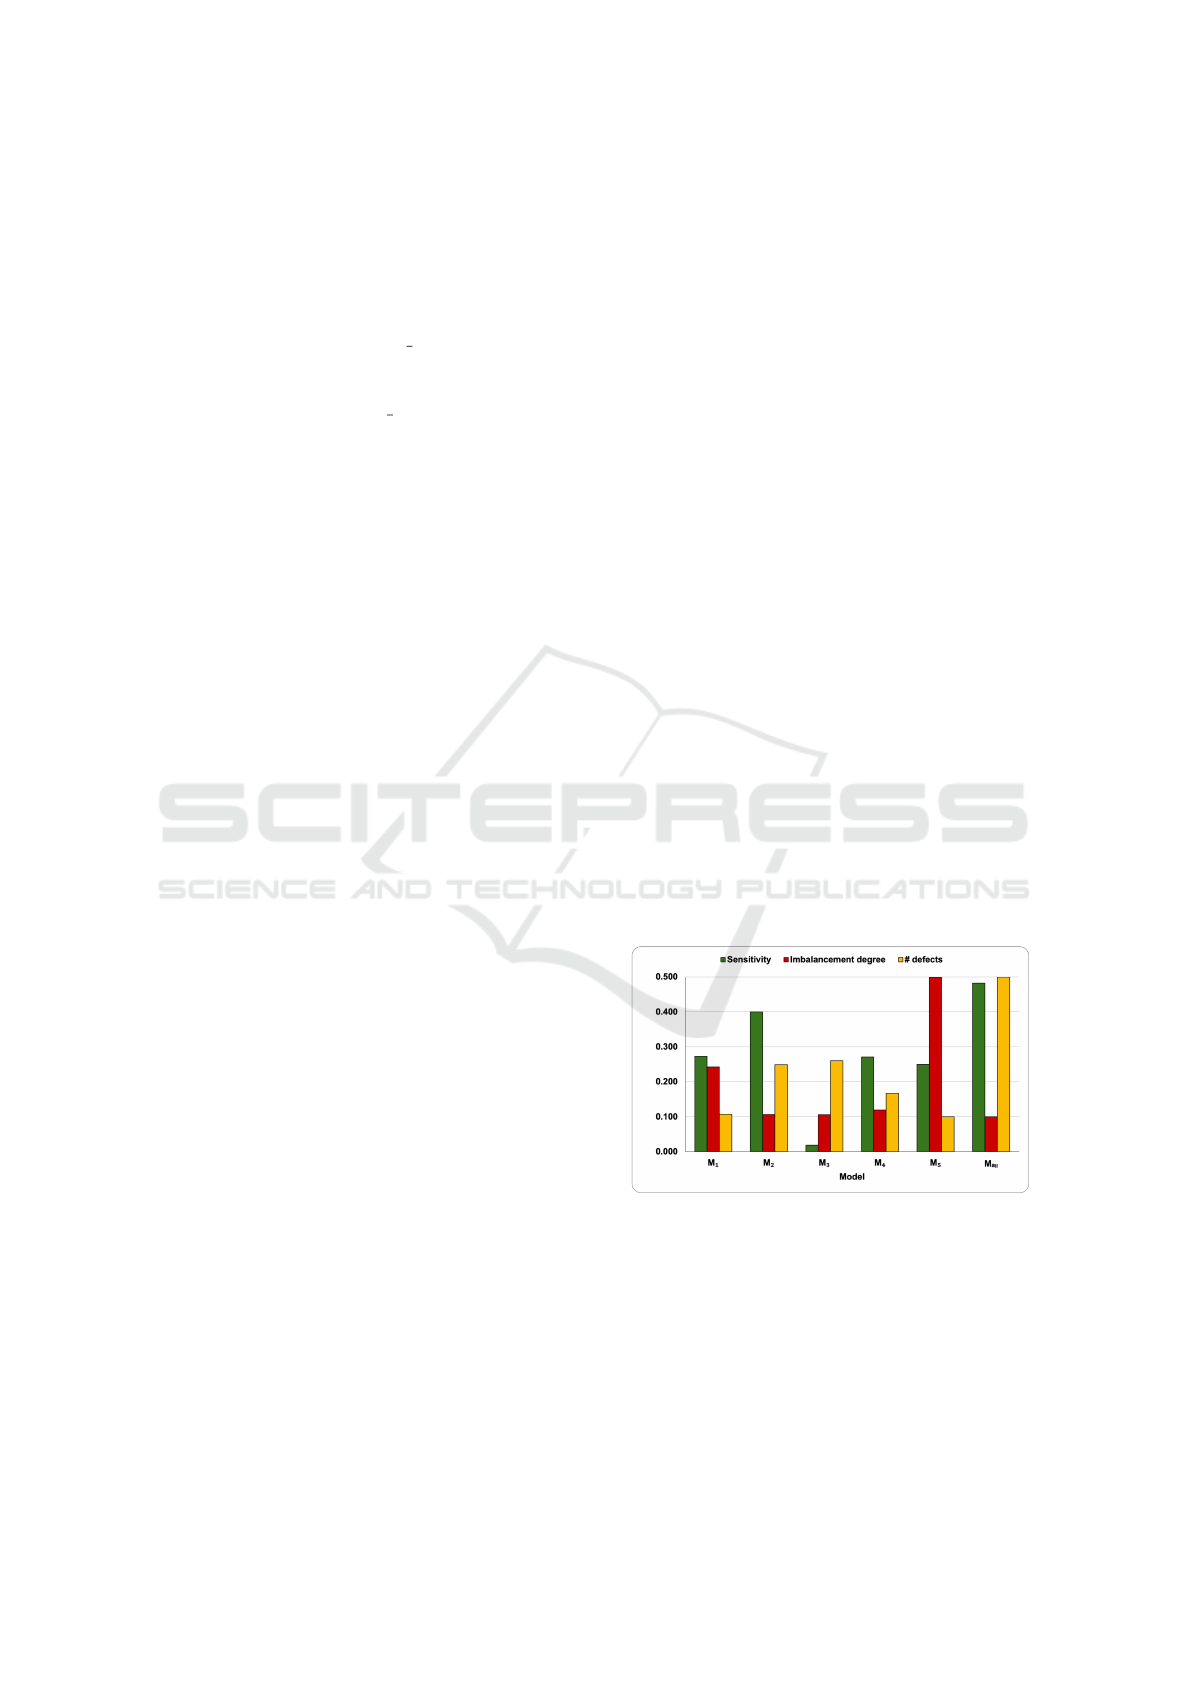
Figure 5 depicts the variation of sensitivity with
respect to the number of defects from the testing data
and the imbalancement degree (ID - computed as the
number of non-defects divided to the number of de-
fects) for each of the employed classifiers (M
1
-M
5
,
M
all
). The Pearson correlation coefficients (PCC)
were also computed for measuring the degree of linear
relationship between the specificity and ID/number of
defects. We note weak correlations between Spec and
ID (PCC of −0.123) and the number of defects (PCC
of 0.235). However, the PPV values are strongly cor-
related with ID (PCC of −0.738) and very strongly
correlated with the number of defects (PCC of 0.933)
suggesting that the precision of the classifier in detect-
ing the defects are strongly dependent on the number
of defects from the training/testing data.
Figure 5: Variation of Spec with respect to the imbalance-
ment degree (ID) and the number of defects from the testing
data for the models M
1
-M
5
, M
all
. The values for the ID and
number of defects were scaled to [0.1, 0.5].
Even if the models M
1
-M
5
have lower probabil-
ity of detection values than M
all
(as revealed by the
previous analysis), it should be noted that the speci-
ficity values for the models M
1
-M
5
are higher than the
specificity of M
all
with more than 30%. Thus, mod-
els M
1
-M
5
are able to better recognize the class of
PreSTyDe: Improving the Performance of within-project Defects Prediction by Learning to Classify Types of Software Faults
221
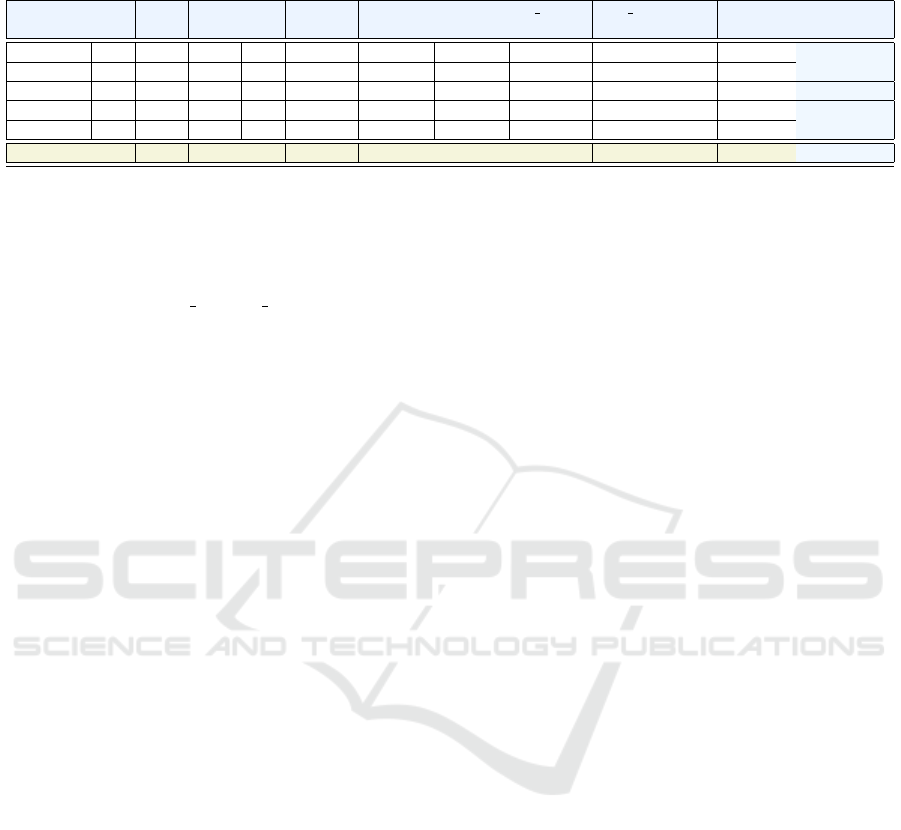
Table 1: Experimental results. Each of the evaluated learning models (M
1
,M
2
,... , M
5
and M
all
) is trained on the application
classes from the first 10 Calcite releases and tested on the five remaining versions.
Learning TD FD TN FN Sens (↑) S pec (↑) AUC (↑) W F1 (↑) Avg AU PRC (↑) MCC (↑) # of defects
model
M
1
3 723 6872 8 0.273 0.905 0.589 0.948 0.545 0.023 11
M
2
60 1479 6116 90 0.400 0.805 0.603 0.871 0.557 0.071 150
M
3
3 111 7484 158 0.019 0.985 0.502 0.962 0.502 0.005 161
M
4
19 847 6748 51 0.271 0.888 0.580 0.929 0.544 0.048 70
M
5
1 345 7250 3 0.250 0.955 0.602 0.976 0.552 0.023 4
M
all
191 3349 4246 205 0.482 0.559 0.521 0.675 0.512 0.018 396
non-defects than M
all
, meaning that the non-defective
instances are more easily distinguished from the spe-
cific types of defects (clusters P
1
-P
5
) than from the
whole set of defects. We also note that for all the
other metrics (AUC, W F1, Avg AUPRC, MCC), the
models M
1
, M
2
, M
4
and M
5
have better values than
M
all
. In terms of AUC measure, which is considered
among the best metrics in SDP, there is an increase in
performance with more than 6% for the classification
of specific type of defects.
It is surprising that the cluster P
3
is the worst sep-
arated from the set of non-defects, even if the num-
ber of defects from the cluster is the highest com-
pared to the other clusters. However, the speci-
ficity of the model M
3
is the highest, which means
that non-defects are better recognized than the de-
fects. We analyzed the bug reports, the source code
and all the changes made to the misclassified in-
stances from P
3
for identifying common reasons for
the wrong classifications. In some cases the differ-
ence between the version containing the defect and
the version that fixed the bug is very small and con-
sequently the generated feature representation in the
combined Doc2vec and LSI space did not manage
to meaningfully capture the change. For example
the class CassandraEnumerator from the package
org.apache.calcite.adapter.cassandra having
116 lines of code contained a bug ([CALCITE-1855])
in version 1.12.0, then the fix was provided in version
1.13.0 by the commit 43e32fa5a and it only con-
sisted in merging two if statements and removing one
line. In other cases, for example for the bug report
[CALCITE-1569] where the fix contains classes from
P
3
, there are lengthy discussions about the reported
issue suggesting that even the human experts are not
in agreement on the exact requirements and specifi-
cation for a given class. The discussion around this
particular bug report contains multiple alternatives to
fix the issue, potentially affecting a different set of
classes.
Overall, considering all six evaluation metrics, the
performance of the models M
1
-M
5
exceeds the perfor-
mance of M
all
in 73% of the cases (22 out of 30 com-
parisons). Thus, our hypothesis that the classification
on specific types of defects is more performant than
the classification of all software defects considered as
a whole is sustained and RQ1 is answered.
However, we acknowledge the poorer perfor-
mance of PreSTyDe in terms of probability of de-
tection (Spec). This may be due to a limitation of
the employed classifier (DNN) which misclassifies
the software defects (due to the severe imbalancement
of the data) and can be caused by inappropriate class
weights or the architecture itself. Other classification
models, such as support vector machines or gradient
boosting methods may be more suitable for the con-
sidered SDP tasks and will be further explored. The
one-class classification models may also be an alter-
native to address the low classification recall.
Another possible cause for the poorer perfor-
mance in terms of Spec may be the representation
employed. It would be possible that the used rep-
resentation (doc2vec+LSI) is not able to distinguish
the faulty entities and should be enriched with other
features (e.g., software metrics or semantic features
learned from other software artifacts).
4.1 Comparison to Related Work
Despite of the vast research in the field of SDP us-
ing machine learning and recently deep learning ap-
proaches, there are very few approaches in the liter-
ature addressing the problem of predicting specific
types of software defects. Existing SDP approaches
highlight the need to shift the SDP research towards
predicting specific types of software faults such as
security vulnerability issues (Dam et al., 2019), nu-
meric errors, complexity issues, pointer issues (Cz-
ibula et al., 2023), energy defects, performance de-
fects (Kamei and Shihab, 2016) as specific defect
types have their own specific behavior. Still, most
SDP approaches consider all defect types together and
try to propose a universal defect prediction model.
There are very few methods in the recent SDP litera-
ture addressing the problem of predicting specific de-
fect types.
ENASE 2024 - 19th International Conference on Evaluation of Novel Approaches to Software Engineering
222

(Xu et al., 2021) attempted to address the dif-
ficulty of predicting all types of defects using a
single model and introduced a graph representation
that allowed to extract defect region candidates for
specific defect types. Experiments were carried
out on the Software Assurance Reference Dataset
(SARD, 2023) and three different types of software
faults: improper validation of an array index vul-
nerability (CWE-129), unchecked input for loop con-
dition (CWE-606) and divide by zero (CWE-369).
Very good performance was obtained for the models
specifically developed for the three types of defects,
with Area Under the ROC curve values ranging be-
tween 0.846 and 0.995.
It is difficult to provide a direct comparison be-
tween our approach and (Xu et al., 2021), as they
have different goals. First, we do not use predefined
types of software defects, but we aim to detect de-
fect classes from the available releases of the software
and further employ these classes for predicting types
of defects in future software releases. Thus, our aim
is to adapt the types of defects to the analysed soft-
ware. Second, the current work is not focused on im-
proving the performance of prediction for the specific
types of defects, but to point out that the performance
of predicting specific defect types is higher than the
performance of predicting all defect types together.
And last, (Xu et al., 2021) do not perform their exper-
iments on Calcite.
4.2 Analysis from a Software
Engineering Perspective
We aim to answer RQ2 from a software engineering
point of view. We focus on the 1.10.0 - 1.15.0 ver-
sions, on which the M
i
models were tested. Changes
to these versions
1
included support for Java 10, nu-
merous improvements and bugfixes, extensions to the
supported SQL syntax as well as new functionalities
and API changes. We carried out a manual com-
parison between all consecutive version pairs (e.g.,
1.10.0 and 1.11.0). We observed that Calcite’s file
structure did not undergo significant changes, which
was expected from already mature application ver-
sions (Molnar and Motogna, 2020).
While a detailed evaluation of the classifier’s
per cluster performance is beyond the scope of our
present paper, we selected one defect from each of
the studied versions, in order to highlight the inherent
complexity of the SDP task.
CALCITE-1501
2
was a major bug affecting a
class in version 1.10, which PreSTyDe mislabelled
1
https://calcite.apache.org/news/releases/
2
https://issues.apache.org/jira/browse/CALCITE-1501
as non-defective. Fixing it required detailed knowl-
edge of the operators used within Calcite, proof being
the detailed discussion recorded on JIRA. CALCITE-
1949 was a major bug first reported in version 1.11
that lead to potential memory leaks and which was re-
solved in version 1.17. Repairing the defect entailed
calling the close() method of a superclass belonging
to the Avatica external library. For version 1.12, we
selected CALCITE-1881, a major bug that induces an
error due to a defect in working with date and times-
tamp types. The fix consisted in updating how Calcite
worked with data types interpretable as a timestamp.
We use source file DruidQuery.java
3
as an exam-
ple illustrative of the difficulties in pinpointing the
decisions taken by SDP approaches. Both the origi-
nal data set (Herbold et al., 2022) and our classifier
marked the source file as defective in version 1.13;
our manual examination revealed the existence of sev-
eral overlapping issues that were fixed either in ver-
sion 1.13 (CALCITE-1853) or one of the following
ones (CALCITE-2035, CALCITE-2094, CALCITE-
2101). CALCITE-2055 was a major bug present in
1.14, which was fixed in version 1.15. It had to do
with correct parsing of invalid date components and
the responsible source file was not correctly classified
by PreSTyDe. The issue was resolved by adding the
required verification code and raising an exception in
case invalid input was provided. For Calcite version
1.15, we selected CALCITE-2188, a major bug that
resulted in errors in specific use of date-type objects
in SQL queries. While fixed in version 1.17, the asso-
ciated discussion on JIRA is a good illustration of the
complexities of source code that must remain compat-
ible with several relational database systems, each of
which handles issues such as timestamp differently.
Our examination reaffirmed the variance in soft-
ware defects. We confirmed the findings of (Herbold
et al., 2022) that defining defects is not practical for
most real-life software systems. In several of the ex-
amined cases, defect resolution involved the inclusion
of large sections of new code as the result of lengthy
discussion between subject matter experts.
5 THREATS TO VALIDITY
The research conducted in this paper followed the
guidelines stated in (Runeson and H
¨
ost, 2009). Start-
ing from a research hypothesis and two well-defined
research questions, we established the methodology
(all defect data and details are available on JIRA)
3
https://github.com/apache/calcite/blob/main/druid/src/
main/java/org/apache/calcite/adapter/druid/DruidQuery.
java
PreSTyDe: Improving the Performance of within-project Defects Prediction by Learning to Classify Types of Software Faults
223

of our study, the target application, collected, pro-
cessed and analyzed the data. In order to allow the
replication or extension of our study, the data used in
our experiments was published as an open-data pack-
age (Chelaru, 2024). Moreover, to address the inter-
nal, external and construct threats to our study’s valid-
ity the existing best practices in both machine learning
and software engineering research were adopted.
In what concerns internal threats we note that the
feature set employed for representing the application
classes is of major importance and may have an influ-
ence on the obtained results. In addition, an analysis
of the source code of all Calcite project releases re-
vealed several situations which may cause noise in
the training data and affect the performance of our
approach. We found 56 application classes labelled
as non-defects (0) in a certain software version, label
that changed to defective (1) in a future release with-
out any change in the source code of the application
class. We also detected an application class initially
labelled as 1, with the label changed in a newer re-
lease to 0 without any source code changes. These
data points corroborate some of our earlier findings
(Czibula et al., 2023) regarding limitations in the anal-
ysis of large volumes of source code and associated
information. We note these instances were not re-
moved from the data sets and could have introduced
noise into the ML models’ building and evaluation.
We leveraged previous work (Herbold et al., 2022)
that combined automated tooling and manual valida-
tion in order to ensure the validity of our method’s in-
put data. However, this limited the scope of our study
to the 16 versions covered by the research. As such,
the most important external threat to our study’s va-
lidity regards its scope, which is currently limited to
a subset of all the versions of a single member of the
Apache suite.
We addressed construct threats by targeting a pop-
ular open-source application for which source code
and associated development data is available. We em-
ployed a combination of widely used performance
metrics together with complementing the results of
the PreSTyDe approach with an additional analysis
from a software engineering point of view. How-
ever, it is possible that additional, yet hidden software
defects exist which could confound our analysis and
skew obtained results. In addition, dividing the avail-
able versions into training (first 10 versions) and test-
ing (next 6 versions) meant that the latter was carried
out using mature application versions. We aim to ex-
tend our work in order to cover multiple systems as
well as application development phases, in order to
capture the target application’s entire lifecycle.
6 CONCLUSIONS AND FUTURE
WORK
Starting from the hypothesis that the performance of
predicting software defects would improve by devel-
oping predictors for specific classes of software de-
fects, we proposed the PreSTyDe defect prediction
model. PreSTyDe consists of an unsupervised la-
belling of defects from the available versions of the
analysed software system followed by a supervised
defect predictor used to predict the error proneness of
the application classes in an upcoming version of the
software by employing the taxonomy of defects unsu-
pervisedly uncovered during the previous stage.
An initial case study was conducted on the Cal-
cite software as a proof of concept for assessing the
predictive performance of PreSTyDe; it confirmed the
feasibility of predicting specific types of software de-
fects instead of developing one classifier for predict-
ing the whole class of software faults. The research
questions stated in Section 1 have been answered. As
a response to the RQs, we highlighted that the perfor-
mance of predicting the defect-proneness of the appli-
cation classes in a specific version of a software could
be improved by employing a taxonomy of defects un-
supervisedly uncovered from the previous software
releases. We also carried out an initial analysis from
a software engineering perspective conducted on a se-
lected number of software defects. We used Apache
Calcite (Begoli et al., 2018), a mature real life soft-
ware project to indicate the potential and viability of
the proposed approach in an industrial context.
We believe that our current work on classifying
defects by their category should be the new line of
research in the SDP field as, on one hand, it could
lead to a better understanding of software defects, and
from a practical perspective it may aid development
teams to early detect specific faults.
In what concerns future work, the immediate goal
is to increase the specificity of the proposed approach
by investigating other classifiers such as support vec-
tor machines or gradient boosting methods. Another
direction regards complementing existing data sets
such as (Herbold et al., 2022) with additional results
from static analysis tools such as SonarQube (Mol-
nar and Motogna, 2020) or PTIDEJ (Lenarduzzi et al.,
2019); we believe it is likely that having input data at a
higher level than class-based metrics could further im-
prove the precision of methods such as PreSTyDe. We
aim to complement these efforts by carrying out an
extensive evaluation of our classifier’s accuracy from
a software engineering standpoint, by examining the
generated clusters and using a known defect taxon-
omy to evaluate cluster-specific errors.
ENASE 2024 - 19th International Conference on Evaluation of Novel Approaches to Software Engineering
224

Finally, we will focus on extending our investi-
gation to other systems within the Apache Software
Foundation due to their strict inclusion criteria, ma-
ture nature and comprehensive feature and software
defect information (Lenarduzzi et al., 2019).
REFERENCES
Begoli, E., Camacho-Rodr
´
ıguez, J., Hyde, J., and et al.
(2018). Apache Calcite: A Foundational Framework
for Optimized Query Processing Over Heterogeneous
Data Sources. In SIGMOD ’18, page 221–230. ACM.
Briciu, A., Czibula, G., and Lupea, M. (2023). A study
on the relevance of semantic features extracted us-
ing BERT-based language models for enhancing the
performance of software defect classifiers. Procedia
Computer Science, 225:1601–1610.
Chelaru, I.-G. (2024). PreSTyDe FigShare dataset. https:
//doi.org/10.6084/m9.figshare.25237600.
Chen, L., Fang, B., and Shang, Z. (2016). Software fault
prediction based on one-class SVM. In ICMLC 2016,
volume 2, pages 1003–1008.
Ciubotariu, G., Czibula, G., Czibula, I. G., and Chelaru, I.-
G. (2023). Uncovering behavioural patterns of one-
and binary-class SVM-based software defect predic-
tors. In ICSOFT 2023, pages 249–257. SciTePress.
Czibula, G., Chelaru, I.-G., Czibula, I. G., and Molnar, A.-
J. (2023). An UL-based methodology for uncovering
behavioural patterns for specific types of software de-
fects. Procedia Computer Science, 225:2644–2653.
Czibula, G. and Czibula, I. G. (2012). Unsupervised restruc-
turing of OO software systems using self-organizing
feature maps. IJICIC journal, 8(3(A)):1689–1704.
Dam, H. K., Pham, T., Ng, S. W., Tran, T., Grundy, J.,
Ghose, A., Kim, T., and Kim, C.-J. (2019). Lessons
Learned from Using a Deep Tree-Based Model for
SDPin Practice. In MSR 2019, pages 46–57.
Deerwester, S. C., Dumais, S. T., Landauer, T. K., Furnas,
G. W., and Harshman, R. A. (1990). Indexing by latent
semantic analysis. JASIST journal, 41:391–407.
Fawcett, T. (2006). An introduction to ROC analysis. Pat-
tern Recognition Letters, 27(8):861–874.
Herbold, S., Trautsch, A., Trautsch, F., and Ledel, B.
(2022). Problems with szz and features: An empirical
study of the state of practice of defect prediction data
collection. Empirical Software Engineering, 27(2).
Kamei, Y. and Shihab, E. (2016). Defect Prediction: Ac-
complishments and Future Challenges. In SANER
2016, volume 5, pages 33–45.
Le, Q. V. and Mikolov, T. (2014). Distributed represen-
tations of sentences and documents. Computing Re-
search Repository (CoRR), abs/1405.4:1–9.
Lenarduzzi, V., Saarim
¨
aki, N., and Taibi, D. (2019).
The Technical Debt Dataset. In Proceedings of
PROMISE’19, page 2–11. ACM.
Li, J., He, P., Zhu, J., and Lyu, M. R. (2017). Software
Defect Prediction via Convolutional Neural Network.
In QRS 2017, pages 318–328.
L
¨
otsch, J. and Ultsch, A. (2014). Exploiting the structures
of the u-matrix. In Advances in Self-Organizing Maps
and Learning Vector Quantization, pages 249–257.
Springer Publishing.
Menzies, T., Krishna, R., and Pryor, D. (2017). The
SEACRAFT Repository of Empirical Software Engi-
neering Data.
Miholca, D.-L., Tomescu, V.-I., and Czibula, G. (2022). An
in-depth analysis of the software features’ impact on
the performance of deep learning-based software de-
fect predictors. IEEE Access, 10:64801–64818.
Molnar, A.-J. and Motogna, S. (2020). Long-Term Evalu-
ation of Technical Debt in Open-Source Software. In
ESEM 2020, New York, NY, USA. ACM.
Moussa, R., Azar, D., and Sarro, F. (2022). Investigating the
use of one-class support vector machine for software
defect prediction. CoRR, abs/2202.12074.
Pachouly, J., Ahirrao, S., Kotecha, K., Selvachandran, G.,
and Abraham, A. (2022). A systematic literature re-
view on SDP using AI: Datasets, Data Validation, Ap-
proaches, and Tools. volume 111, page 104773.
ˇ
Reh
˚
u
ˇ
rek, R. and Sojka, P. (2010). Software framework for
topic modelling with large corpora. In LREC 2010,
pages 45–50. ELRA.
Runeson, P. and H
¨
ost, M. (2009). Guidelines for conduct-
ing and reporting case study research in software en-
gineering. Empirical Softw. Engg., 14(2):131–164.
Sahoo, S. K., Criswell, J., and Adve, V. (2010). An Em-
pirical Study of Reported Bugs in Server Software
with Implications for Automated Bug Diagnosis. In
ICSE’10, page 485–494, USA. ACM.
SARD (2023). Software Assurance Reference Dataset.
https://samate.nist.gov/SARD/.
Shepperd, M., Qinbao, S., Zhongbin, S., and Mair, C.
(2018). NASA MDP Software Defects Data Sets.
Shi, C., Wei, B., Wei, S., Wang, W., Liu, H., and Liu, J.
(2021). A quantitative discriminant method of elbow
point for the optimal number of clusters in clustering
algorithm. J. Wirel. Commun. Netw., 2021(1):31.
Wagner, S. (2008). Defect Classification and Defect Types
Revisited. In Proc. of the 2008 Workshop on Defects
in Large Software Systems, page 39–40, New York,
NY, USA. Association for Computing Machinery.
Wang, S., Liu, T., and Tan, L. (2016). Automatically learn-
ing semantic features for defect prediction. In Pro-
ceedings of the 38th ICSE, pages 297–308. ACM.
Xu, J., Ai, J., and Shi, T. (2021). Software Defect Prediction
for Specific Defect Types based on Augmented Code
Graph Representation. In DSA 2021, pages 669–678.
Zhang, S., Jiang, S., and Yan, Y. (2022). A Software Defect
Prediction Approach Based on BiGAN Anomaly De-
tection. Scientific Programming, 2022:ID 5024399.
Zhou, C., He, P., Zeng, C., and Ma, J. (2022). Software
defect prediction with semantic and structural infor-
mation of codes based on graph neural networks. In-
formation and Software Technology, 152:107057.
PreSTyDe: Improving the Performance of within-project Defects Prediction by Learning to Classify Types of Software Faults
225
