Data Quality Assessment for the Textile and Clothing Value-Chain
Digital Product Passport
A. M. Rosado da Cruz
1,2 a
, Pedro Silva
1
, S
´
ergio Serra
1
, Rodrigo Rodrigues
1
, Pedro Pinto
1 b
and
Estrela F. Cruz
1,2 c
1
ADiT-LAB, Instituto Polit
´
ecnico de Viana do Castelo, 4900-348 Viana do Castelo, Portugal
2
ALGORITMI Research Lab, Universidade do Minho, Guimar
˜
aes, Portugal
Keywords:
Quality Assessment, Data Quality Validation, Sustainability Indicators, Textile and Clothing Value Chain.
Abstract:
The Textile and Clothing (T&C) industrial sector is transforming to become more sustainable and in line
with the directives of the European Union. Therefore, to become more transparent and gain consumer trust,
some projects present proposals to implement the traceability of T&C products. However, this sector has a
very large and diverse value chain that involves many types of industries that are typically spread throughout
the world. Furthermore, a previously developed project to implement traceability on the value chain reveals
that the involved companies have different levels of digital maturity and, among those with the same level of
maturity, different digital platforms are used. Consequently, some values submitted for a T&C traceability
platform may be collected automatically, while others have to be manually inserted. This makes it necessary
to create a tool for validating the data values submitted to the traceability platform, which can be integrated
into the different organizational tools so that the data can be validated homogeneously. After summarizing
the relevant and contextualizing facts about the T&C value chain, and reviewing the data quality assurance
mechanisms, this paper proposes a software service for validating data values of metrics being traced across
the T&C value chain, that integrates the Digital Product Passport of T&C items. Associated with the validation
service, an admin platform for configuring the service for each metric is also proposed.
1 INTRODUCTION
Textile & Clothing (T&C) is one of the industries
that has grown the most in the last decades and one
of those that has the greatest environmental impact.
This impact comes not only from the fact that it con-
sumes a lot of natural resources but also because it
contributes to greenhouse gases and water pollution.
Furthermore, and because the population is consum-
ing more and more, this industrial sector produces a
lot of waste that has to be treated and preferably re-
cycled to be used as new raw material (Alves et al.,
2022a).
One of the ways to encourage companies to pro-
duce more sustainably falls on the end consumer, who
can buy the most environmentally friendly item of
clothing over others. However, to do this, consumers
must trust in the labels and know what they are buy-
ing. To achieve this, it is necessary to implement
traceability in the T&C industry value chain. The
a
https://orcid.org/0000-0003-3883-1160
b
https://orcid.org/0000-0003-1856-6101
c
https://orcid.org/0000-0001-6426-9939
authors in (Alves et al., 2024) propose a blockchain-
based traceability platform that implements traceabil-
ity in this sector. The traceability platform registers
relevant data items that are used to compute a sustain-
ability index, which classifies garments into different
levels of sustainability, based on indicators collected
throughout the value chain as proposed in (Alves
et al., 2022b; Williams et al., 2023). The sustainabil-
ity index label must be easy to understand by all con-
sumers and must contain summary information on the
social and environmental impact of clothing produc-
tion (Williams et al., 2023). The traceability platform
registers a set of metrics from the industrial and lo-
gistics activities along the value chain, for each pro-
duced lot of intermediate or final product. From the
collected values for each type of metric, it calculates
and registers, for each produced lot, an environmen-
tal sustainability indicator or score. In addition, some
socially relevant company-level metrics are collected
and registered. And, from those metrics, a company
social sustainability score is calculated (Alves et al.,
2024). These sustainability scores empower end-
consumers with information that allows them to select
the most sustainable clothing. However, this requires
288
Rosado da Cruz, A., Silva, P., Serra, S., Rodrigues, R., Pinto, P. and Cruz, E.
Data Quality Assessment for the Textile and Clothing Value-Chain Digital Product Passport.
DOI: 10.5220/0012732900003690
Paper published under CC license (CC BY-NC-ND 4.0)
In Proceedings of the 26th International Conference on Enterprise Information Systems (ICEIS 2024) - Volume 2, pages 288-295
ISBN: 978-989-758-692-7; ISSN: 2184-4992
Proceedings Copyright © 2024 by SCITEPRESS – Science and Technology Publications, Lda.

that the values collected to calculate the sustainabil-
ity scores are reliable. During the implementation of
the reported project, the authors concluded that not all
companies were at the same level of digital develop-
ment (Alves et al., 2024). Some companies were able
to automatically collect information on sustainability
indicators, through Internet Of Things (IoT) devices,
while others did not (Alves et al., 2022b). To allow
all companies to be included in the project and im-
plement traceability on their products, a platform was
developed to manually collect this information (Dias
et al., 2023). Through this platform, companies enter
the indicator values manually into the system. In con-
tinuation of this work, it became necessary to create
a data validation tool, in particular, to validate values
that are manually entered into the system, not only
using the platform presented in (Dias et al., 2023),
but that can be used by all different platforms that are
integrated with the traceability platform Application
Programming Interface (API)(Alves et al., 2024).
This paper proposes a software service and asso-
ciated API for validating the values introduced for the
metrics used for calculating the sustainability indica-
tors of a textile company and its product lots. This
data validation service may be integrated with the dif-
ferent software applications that feed the traceability
platform.
The rest of this paper is structured as follows: the
next section covers the research methodology used
in this project. Section 3 presents an example T&C
value-chain business process for the production of a
T-shirt, and details the different steps, which require
the reporting of indicator values to the traceability
platform. In section 4, the mechanisms for data qual-
ity assurance and reliability are reviewed. Then, sec-
tion 5 covers our proposed solution for a data vali-
dation software service. Finally, section 6 presents
conclusions and draws some lines for future work.
2 RESEARCH METHODOLOGY
To conduct this study, we use the Design Science Re-
search (DSR) methodology. This research method-
ology seeks to produce actionable knowledge to cre-
ate artifacts that address specific organizational chal-
lenges (Cruz and da Cruz, 2020). DSR is intended
to solve problems never solved before, in a unique
and innovative way, or to solve problems previously
solved, but more efficiently and effectively than the
existing approaches.
DSR is a process composed of the following main
research activities (Cruz and da Cruz, 2020; Hevner
et al., 2004):
• Problem identification and motivation - for fi-
nal consumers, it is important to have trans-
parency in how the products in the T&C value
chain have reached them, that is, which activities
have been developed in order to produce and sell
any given garment, and what social and environ-
mental impact they had. For companies, it is im-
portant to know their suppliers, and how they im-
pact environment and society.
• Definition of the objectives for the solution -
having previously developed a traceability plat-
form for the T&C value chain, the goal is now to
ensure quality in the data that is submitted to the
traceability platform.
• Design and implementation - a prototype solu-
tion has been implemented, and this is presented
in this paper.
• Demonstration - In a more advanced state, we
will prove that the artifacts are capable of solving
the mentioned problems, putting them to work in
a T&C traceability system.
• Evaluation - The developed data quality assess-
ment service will undergo different tests (e.g., per-
formance, usability) and, at a later stage, collected
data will be assessed for completeness and consis-
tency.
• Communication - When the project passes all ap-
proval tests, the results are to be published and
discussed at a conference.
3 THE TEXTILE AND CLOTHING
VALUE CHAIN
This section summarizes the main activities that can
be involved in manufacturing garments. Many differ-
ent types of industries can be involved in the creation
of a garment, starting with the production of raw ma-
terials. There is a huge variety of raw materials with
different origins, such as natural fibers, which come
from agriculture and livestock farming, like cotton,
silk, or wool; cellulose fibers such as viscose, etc. ex-
tracted from plants and wood; synthetic fibers, chem-
ically produced from materials, such as petroleum,
like polyester, acrylic, or nylon (Alves et al., 2024).
Nowadays, some industries already use recycled ma-
terials as raw materials. These materials are produced
from textile waste, plastic bottles, etc.
As a simple and concrete example of the process
of creating a garment, is represented in Figure 1. It
presents a business process for producing a 100% cot-
ton T-shirt. This is one of the simplest processes be-
Data Quality Assessment for the Textile and Clothing Value-Chain Digital Product Passport
289
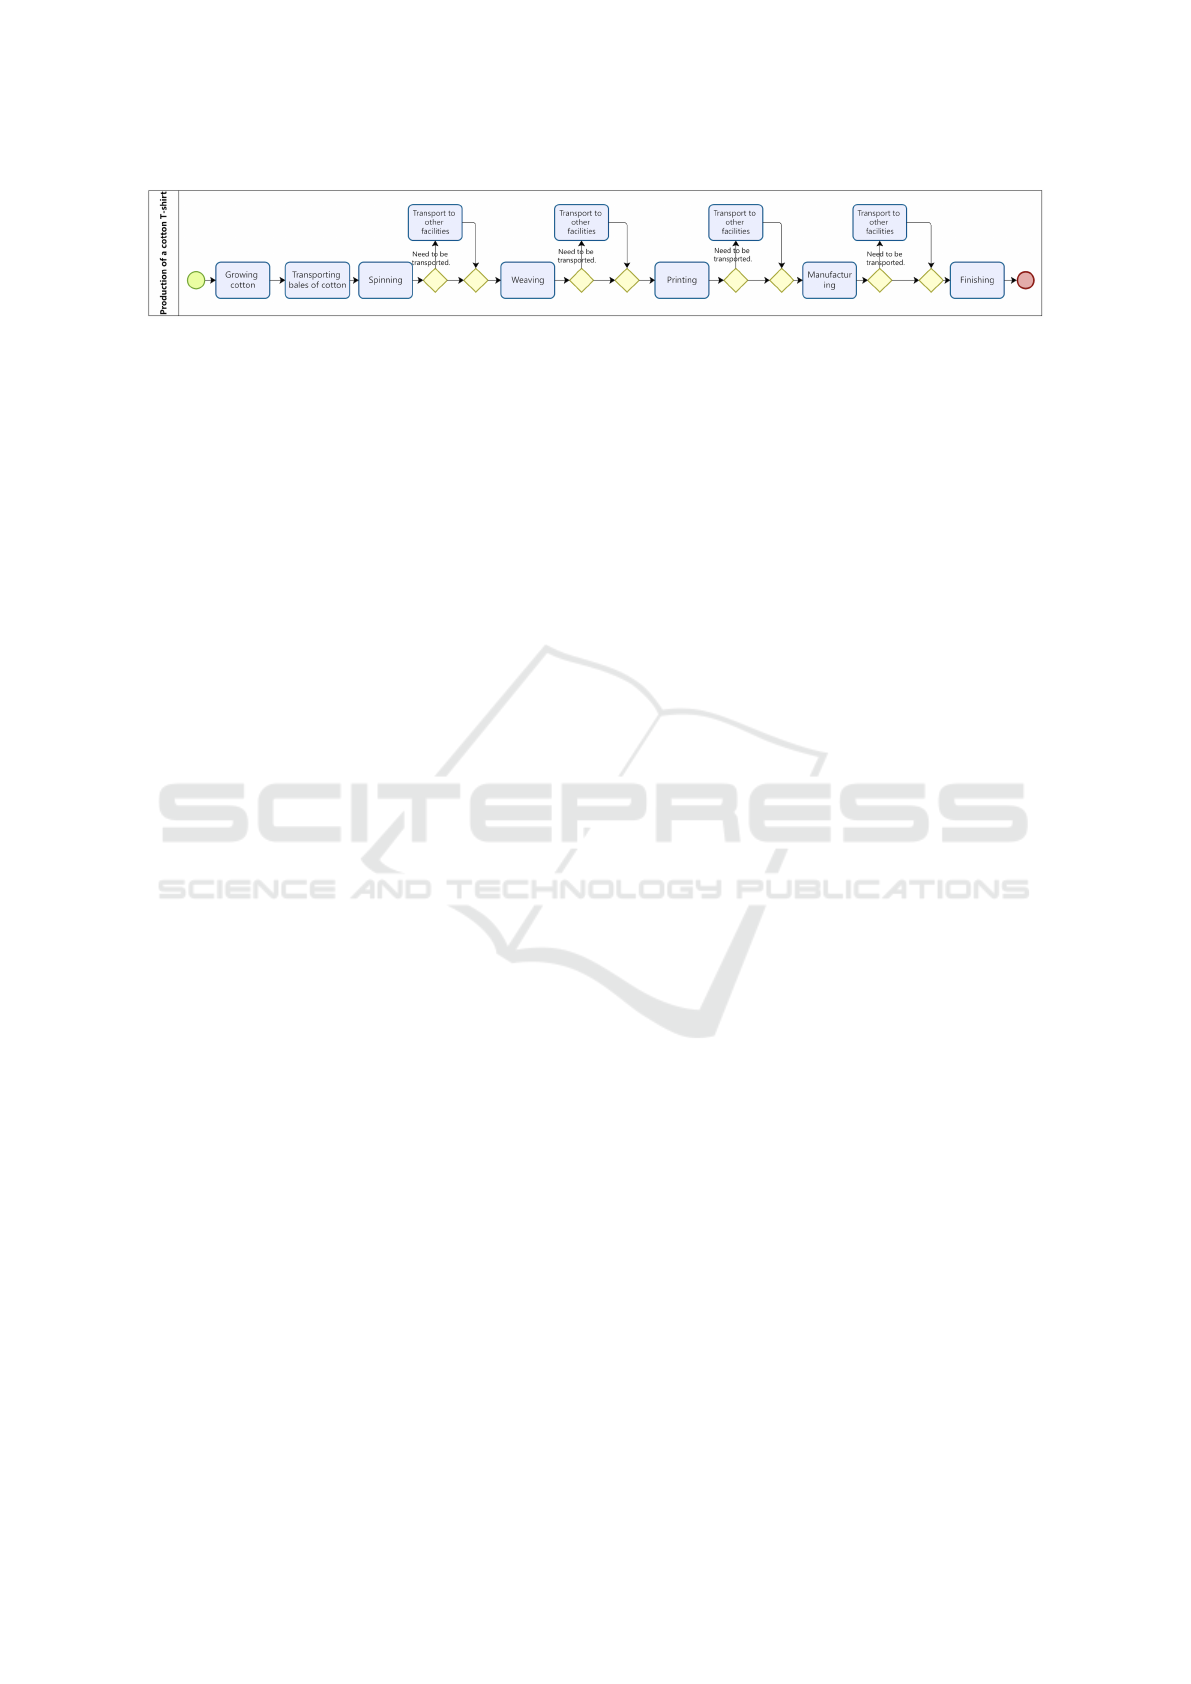
Figure 1: Example business process for producing a cotton T-shirt.
cause it involves only one type of raw material (cot-
ton); however, in the vast majority of cases, textile
and clothing items are made from several types of raw
materials with different origins.
As can be seen in Figure 1, to produce a T-shirt,
the following production activities are necessary:
• Raw Material production, represented in Figure 1
by the activity Growing Cotton, is the first activity
in the value chain.
• Spinning, where the raw material is transformed
into yarn. In the case shown in Figure 1, it trans-
forms the cotton bales into cotton yarn.
• Weaving, transforms yarn into fabric. The same
fabric can be made up of several types of yarn, for
instance, 50% cotton and 50% polyester.
• Printing is about coloring the fabric with simple
colors, patterns, etc.
• Manufacturing that involves cutting, sewing, and
assembling the piece of textile or clothing.
• Finishing may involve some final finishing.
Raw material production is the first activity in the
value chain. After the raw material is produced, a
large number of different types of industries can be
involved. Some industries carry out all activities from
receiving the raw materials to creating the final gar-
ment. Other industries carry out some of the activities
involved, for example spinning and weaving. How-
ever, some industries specialize in a single activity,
e.g. spinning. This means that, from the production
of the raw material to the creation of the final gar-
ment, intermediate products can travel several kilo-
meters, and it is very common for these products to
be transported between different countries on differ-
ent continents, using different types of transportation
(boat, train, truck, etc.) This is represented in Figure
1 by the BPMN gateways and the optional activities
“transport to other facilities”, meaning that, between
each production activity, it may be necessary to trans-
port the (intermediate) product from one facility to
another. The transport itself can be more or less envi-
ronmentally friendly.
For the DPP, in each of these production activities,
it is necessary to collect and store, in the traceability
platform, the information about the activity as well as
the values on the various indicators that can affect the
environment, such as water consumed, toxicity pro-
duced, energy consumed, waste, etc.
4 RELATED WORK ON DATA
QUALITY ASSESSMENT
Data is some value that characterizes a real-world ob-
ject or event. Data quality assurance mechanisms are
essential and crucial for any system that relies on data.
Data quality plays an important role in any sector and
has a significant impact on organizational and value
chain operations. Data quality may be characterized
and measured through different attributes or dimen-
sions. These attributes indicate the overall quality
level of data. Different Data Quality Frameworks
identify different relevant quality attributes (Cichy
and Rass, 2019).
The most common and consensual quality at-
tributes or dimensions, from different frameworks,
are, according to (Cichy and Rass, 2019; Wang and
Strong, 1996):
• Completeness: The degree to which the data pos-
sesses adequate breadth, depth, and scope for the
given task.
• Accuracy or Validity: The degree to which data
are valid, reliable, and certified.
• Timeliness: The degree to which the age of the
data is appropriate for the given task.
• Consistency: The degree to which data present a
standard format and are compatible with previous
data.
• Accessibility: The degree to which data is avail-
able, or easily and quickly retrievable.
The level or degree of data quality refers to the
extent to which the data meets the expectations and
requirements of its intended purposes (Sebastian-
Coleman, 2012). This data quality degree is a func-
tion of the level of adherence of data to each stated
dimension.
Data quality is important because it can affect the
conclusions drawn from it. Poor data quality can lead
to wasted resources and missed opportunities, while
ICEIS 2024 - 26th International Conference on Enterprise Information Systems
290

f (x) = 100 × ·
|x−Mean|
Allowed Range
(a) Assessing data validity, with linear
decay of validity score
f (x) = 100 × e
−k·
|x−Mean|
Allowed Range
2
(b) Assessing data validity, with
exponential decay of validity score,
where k represents the rate of decay.
f (x) =
100 × e
−k·
|x−Mean|
Allowed Range
2
+ BI ,
if x inside range
0 , otherwise
(c) Assessing data validity, with
exponential decay of validity score, if
the actual value is inside the range,
where k represents the rate of decay,
and the allowed range is (max − min).
f (x) =
100 × e
−k·
|x−Mean|
Allowed Range
2
+ BI ,
if x > min
V
x 6 max
V
x inside range
0 , otherwise
(d) Assessing data validity, with
exponential decay of validity score, if
the actual value is between min and
max and is inside the allowed range
around the mean, where k represents
the rate of decay, and the allowed range
is (max − min).
Figure 2: Proposed formulas for assessing data quality - validity (x is the actual value being validated).
high-quality data can enhance the effectiveness and
efficiency of data-driven solutions.
Any data-dependent activity or solution needs to
have confidence in the data that is being received
and used. This data quality assessment can measure
both subjective and objective quality characteristics
of data. Subjective characteristics measure the per-
ceptions of people involved with the data, and objec-
tive characteristics measure states of the data (Pipino
et al., 2002).
The assessment of data quality by stakeholders,
including data collectors and consumers, is subjective
and influenced by their needs and experiences. If the
quality of the data is perceived as low, it will affect the
behavior of stakeholders (Pipino et al., 2002). Objec-
tive assessments may be independent of the task or
dependent on the task. Metrics for data quality task-
independent assessments have no contextual knowl-
edge of the application domain and can be applied re-
gardless of the tasks at hand. While, task-dependent
metrics must have the organization’s business rules,
regulations, and other contextual information into ac-
count (Pipino et al., 2002).
Metrics for objective assessment need to be devel-
oped according to a set of defined principles, so that
they are tailored to specific requirements. Three func-
tional forms are typically used (Pipino et al., 2002):
simple ratio, minimum or maximum operation, and
weighted average. These functional forms can incor-
porate sensitivity parameters for further customiza-
tion.
Existing data quality metrics are mainly de-
rived without any contextual information (Even and
Shankaranarayanan, 2007). For improving data qual-
ity for specific needs, it is needed to incorporate and
better reflect contextual information in the assessment
formulas. In the next section, a set of quality assess-
ment formulas is proposed to assess numeric data val-
ues for specific ends in the context of the T&C value
chain. The proposed formulas are customizable in or-
der to be adaptable to different ends. The specific
formula to be used for validating values for each de-
fined metric or indicator within each specific produc-
tion activity, together with its associated customizable
parameters, may be selected and “tuned” through an
admin backoffice application.
5 PROPOSED SOLUTION
As explained before, the application scenario for the
proposed data validation service is a traceability plat-
form for environmental, social, and economic sustain-
ability information across the T&C value chain. The
goal is to assess data quality once, before registering
the data on the traceability platform. In this scenario,
the focus is on the accuracy or validity of data, as it
has been previously defined. Besides, all data being
registered are numeric data, but still can have differ-
ent validation criteria. The data quality validation ser-
vice, proposed in this paper, offers, to the applications
integrated with the traceability platform, a unique val-
idation tool for all stakeholders. And, because differ-
ent data may need different validity criteria, the pro-
posed solution may be tuned to use different valida-
tion methods for different sustainability metrics being
Data Quality Assessment for the Textile and Clothing Value-Chain Digital Product Passport
291
(a) Linear Function (b) Non-linear exponential function (k
= 0.67)
(c) Non-linear exponential function (k
= 3)
(d) Non-linear exponential function
with exclusion of values not in the
allowed range around the mean.
(e) Non-linear exponential function
with exclusion of values not between
the minimum and maximum values.
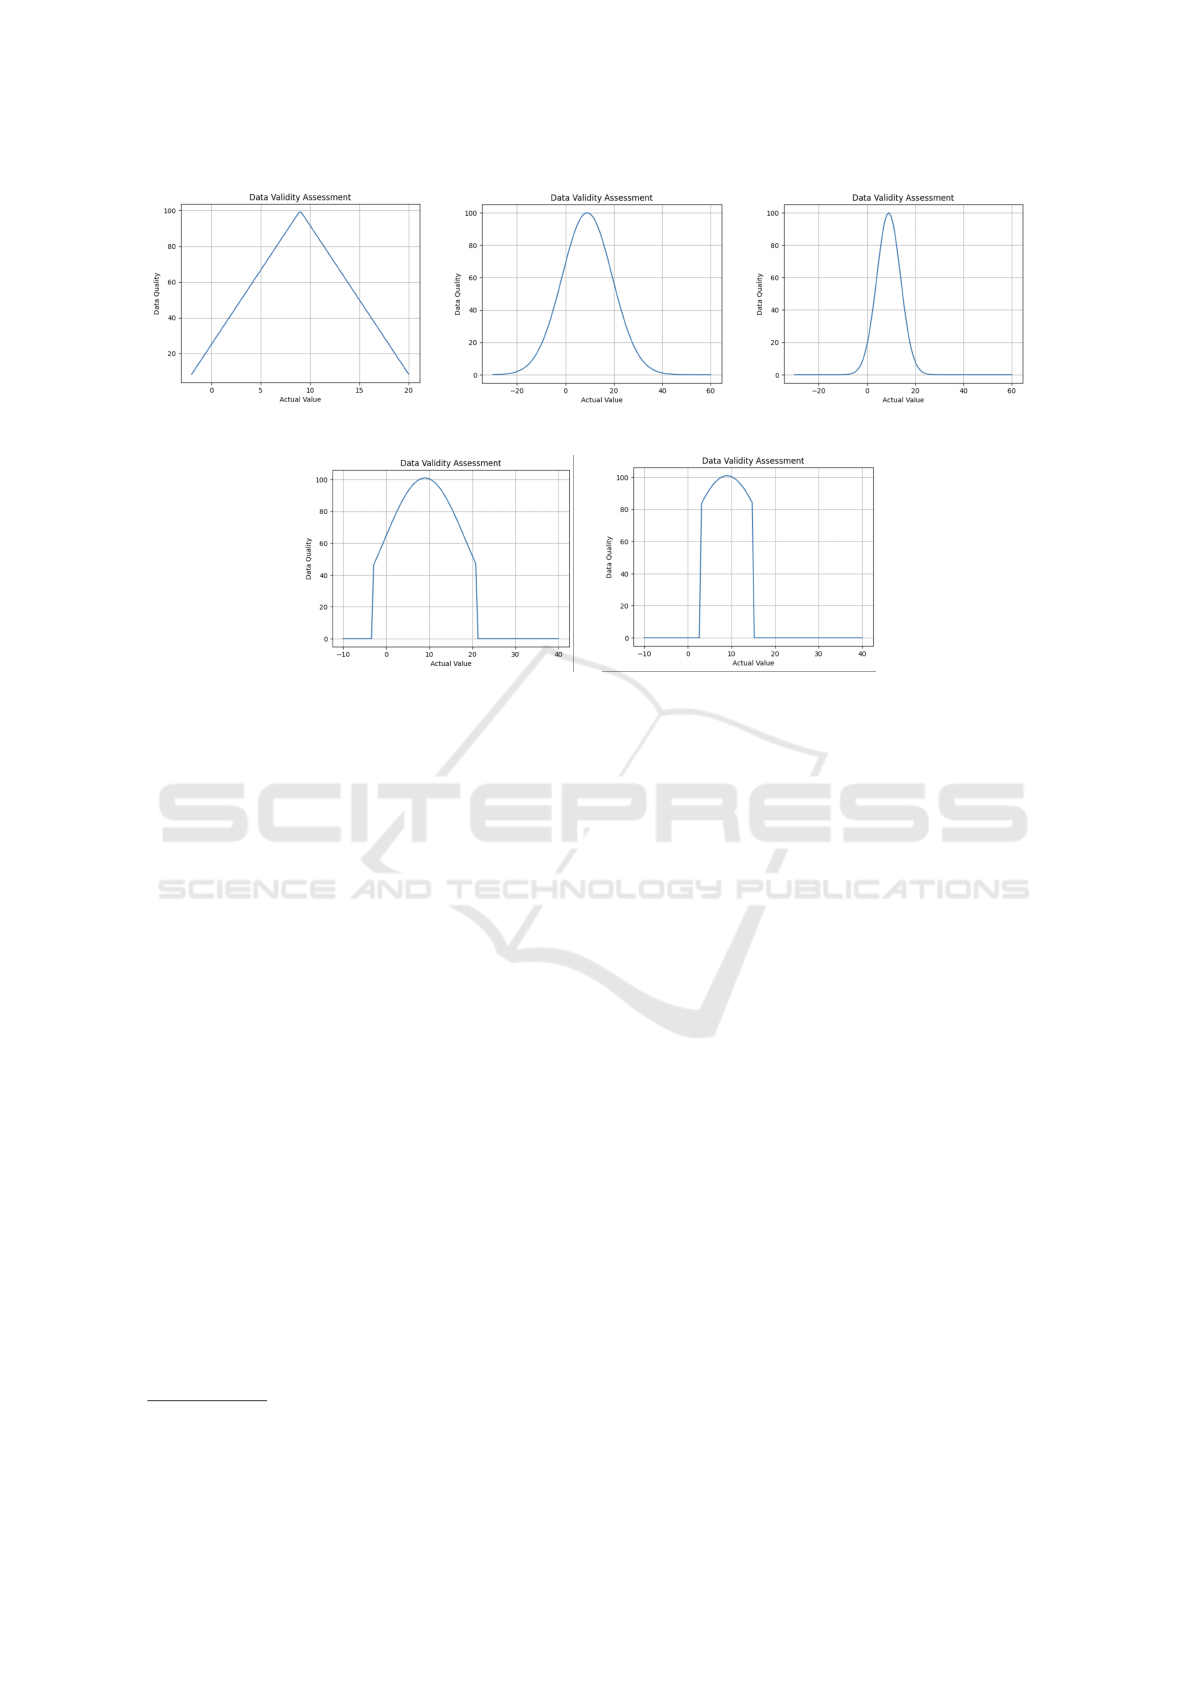
Figure 3: Assessing Data Validity (min=3, max=15, mean=9).
recorded.
In the next subsection, we propose four formulas
that can be used to validate each sustainability metric
value. Then, we explain the different aspects of our
proposed solution for creating a validation service, in-
cluding its architecture and entity classes model.
5.1 Assessing Data Quality - Validity
Four formulas for validating the sustainability met-
rics’ values are analyzed in this subsection (refer to
Figure 2).
All formulas are based on checking the value to
be evaluated as to whether it belongs to a range of
values, between a minimum (min) and a maximum
(max), and its proximity to a mean value. This mean
value intends to identify the central tendency of the
set of values of that sustainability metric. Central ten-
dency has three important measures that are the arith-
metic mean, median, and mode. The arithmetic mean
of a set of numbers is the average of those numbers.
The median of a set of numbers is the middle number
in that set, having the numbers ordered. The mode or
modal of a set of numbers is the most repeated num-
ber in the set, i.e. is the number with the highest fre-
quency in that set
1
.
1
https://statistics.laerd.com/statistical-
guides/measures-central-tendency-mean-mode-median.php
Values closest to the mean, or central tendency
value, have the greatest validity degree. A value far
from the mean will have a lower validity degree. The
decay of the validity of the value, as it moves away
from the mean, may be different from one metric to
another. Furthermore, in case a value crosses the ex-
tremes of the range (minimum or maximum), step-
ping out of the defined range, its degree of validity
may be zero or may still be an acceptable value, de-
pending on the metric in question. The first formula
(Figure 2a) may be used to assess values for metrics
where the validity degree of a value decays linearly,
as it moves away from the mean. This can be seen
graphically in Figure 3a.
Plots in Figure 3 show examples of applying the
four validation functions from Figure 2 for assessing
the validity of a value x. The goal is to validate that x
is inside the interval from 3 to 15, with a mean value
of 9.
In the second formula (Figure 2b), the validity de-
cays exponentially, depending on a defined rate of de-
cay. Figure 3b shows the plot for k = 0, 67, and Figure
3c shows the plot for k = 3.0. In that formula (Figure
2b):
• e is the Napier’s constant, or Euler’s number (ap-
proximately 2.71828).
• k is a positive constant that determines the rate of
decay. k may be adjusted to control how quickly
ICEIS 2024 - 26th International Conference on Enterprise Information Systems
292
(a) Non-linear exponential function (k
= 0.8)
(b) Non-linear exponential function
with exclusion of values not in the
allowed range around the mean.
(c) Non-linear exponential function
with exclusion of values not between
the minimum and maximum values.
Figure 4: Assessing Data Validity (min=3, max=15, mean=5).
the data quality decreases as the actual value de-
viates from the mean.
In formula (c) (Figure 2c) the validity degree also
decays exponentially, but, if the value being assessed
is outside of the defined range around the mean, it
rapidly decays to zero (see graphic in Figure 3d). In
formula (c), a bonus value (BI) may be defined to be
added to values inside the defined range.
In formula (d) (Figure 2d), if the value being as-
sessed is below the minimum or above the maximum
values, it immediately decays to zero (see graphic in
Figure 3e). In formula (d), a bonus value (BI) may be
defined to be added to values inside the defined range
around the mean and between the min and max values.
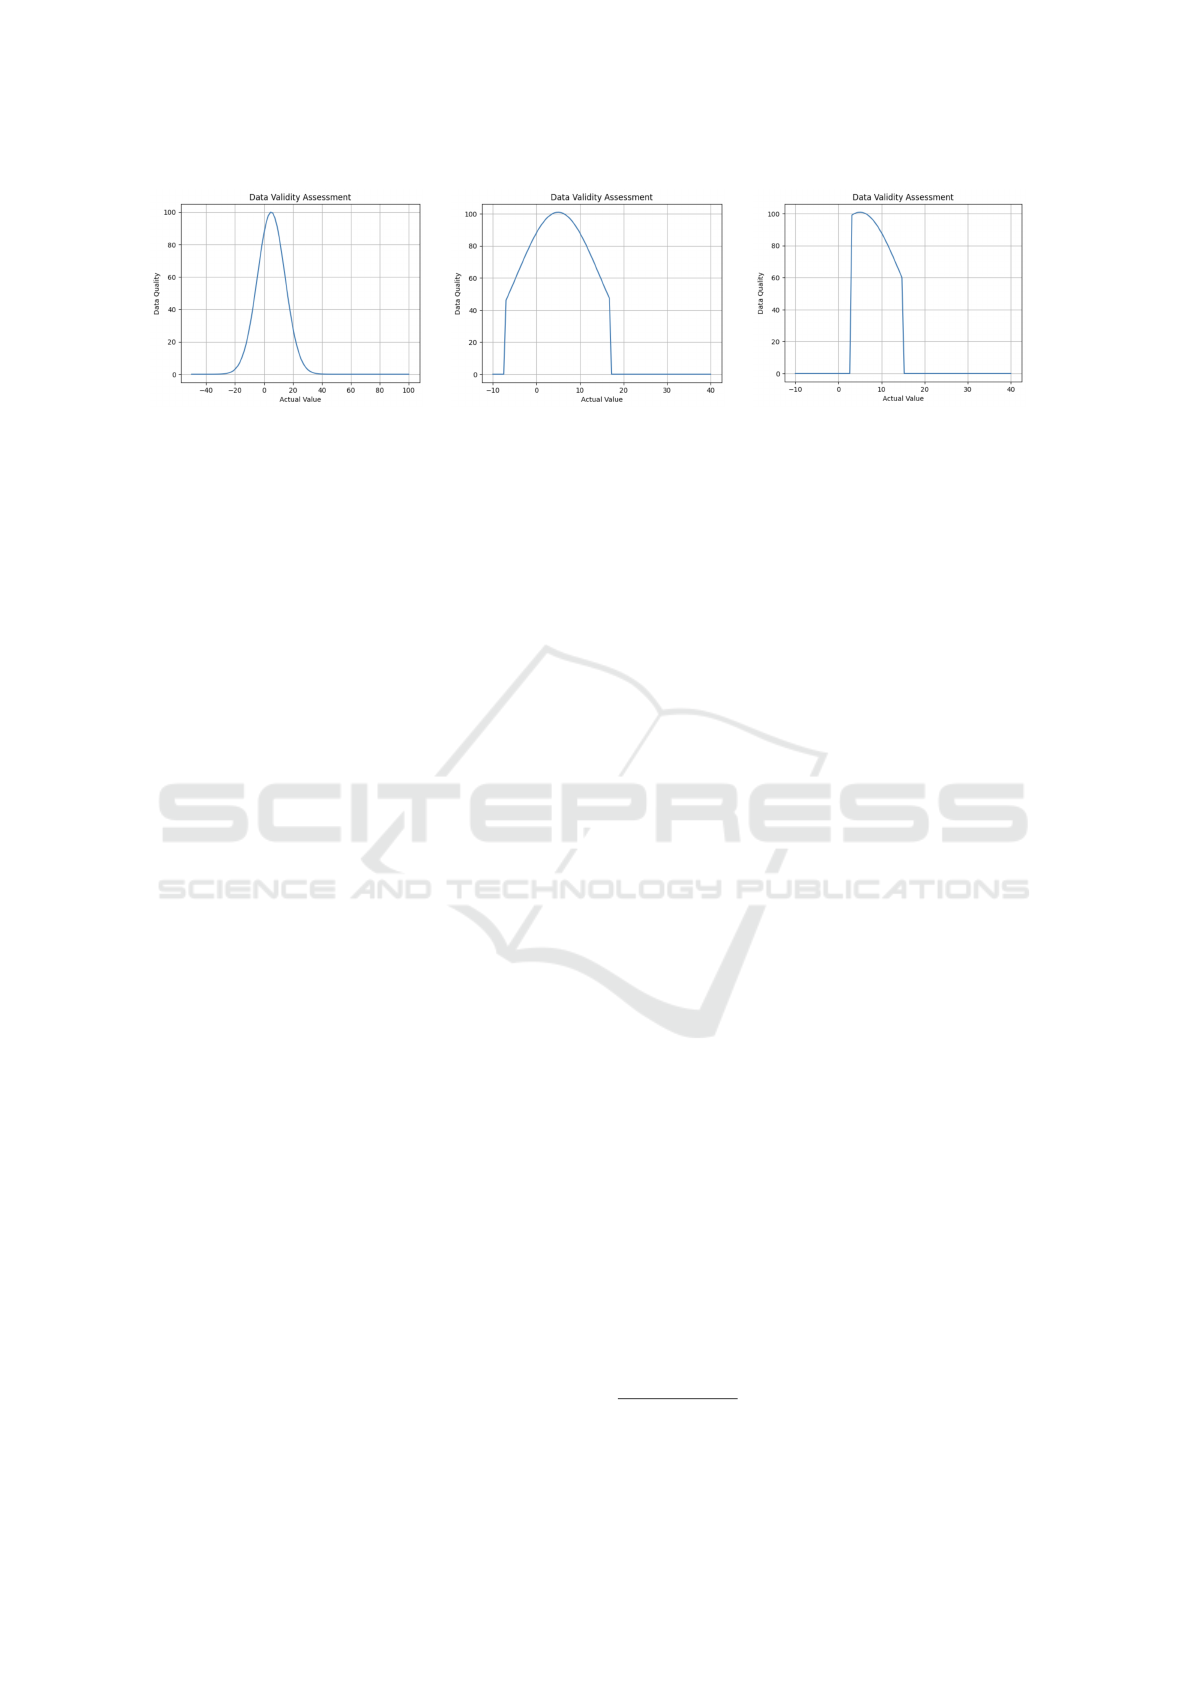
Plots in Figure 4 illustrate formulas (b), (c) and (d)
for min = 3, max = 15 and mean = 5. And, plots in
Figure 5, illustrate the same formulas for min = 150,
max = 500 and mean = 300.
5.2 Validation Service and Associated
Admin Platform
For the scenario previously described, two different
actors of the data quality assessment platform have
been identified. These are depicted in the platform’s
use case model in Figure 6. The ”User via API” rep-
resents the value chain operator using the assessment
service’s API to validate the value of a sustainabil-
ity indicator, while using its organizational ERP or
MRP application, or the integration portal described
in (Dias et al., 2023). The Admin user type defines the
indicators metadata, whose values will be validated
through the platform. The admin uses a backoffice
Admin platform.
The proposed platform domain model, repre-
sented in Figure 7, is composed of three main enti-
ties: Metric, Productive Activity, and ProductiveAc-
tivityMetric. Each entity has its unique identifier (ID)
and employs soft-delete functionality for elimination.
Metric is the entity that represents the information
about the sustainability indicators, such as water or
CO2 footprint, among others. Here, only the Metric’s
name and a brief description are considered.
Productive Activity represents the existing activi-
ties that a piece of clothing needs to go through un-
til it reaches the stores, like spinning, weaving, and
many others. The Productive Activity may be charac-
terized by its name and its reference, which is used to
uniquely identify each productive activity. Because
a productive activity can have many metrics associ-
ated with it, and vice-versa, and a given metric may
have different validation requirements depending on
the productive activity it is being associated with, en-
tity ProductiveActivityMetric unfolds the relationship
between a metric and a productive activity, and de-
fines the formula and other parameters used to vali-
date the record values. These parameters include the
minimum (min), maximum (max), mean (mean), and
the rate of decay (k). These parameters are essential
for validating whether the values inserted by the user
are correct or not and assessing their validity, by using
the formula specified in the ProductiveActivityMetric.
Additionally, the Record entity represents the data
entered by users on the platform through the service’s
API, which undergoes validation. The validated val-
ues are stored, together with their validity degree to
create a dataset that will be used in the future to train
a machine learning model for enhancing this valida-
tion service.
5.3 Architecture
The architecture of the proposed validation service
and platform comprises a backend service for quality
assessment of value metrics, which includes a Post-
greSQL
2
database, a services’ API built on FastAPI
3
2
https://www.postgresql.org
3
https://fastapi.tiangolo.com
Data Quality Assessment for the Textile and Clothing Value-Chain Digital Product Passport
293
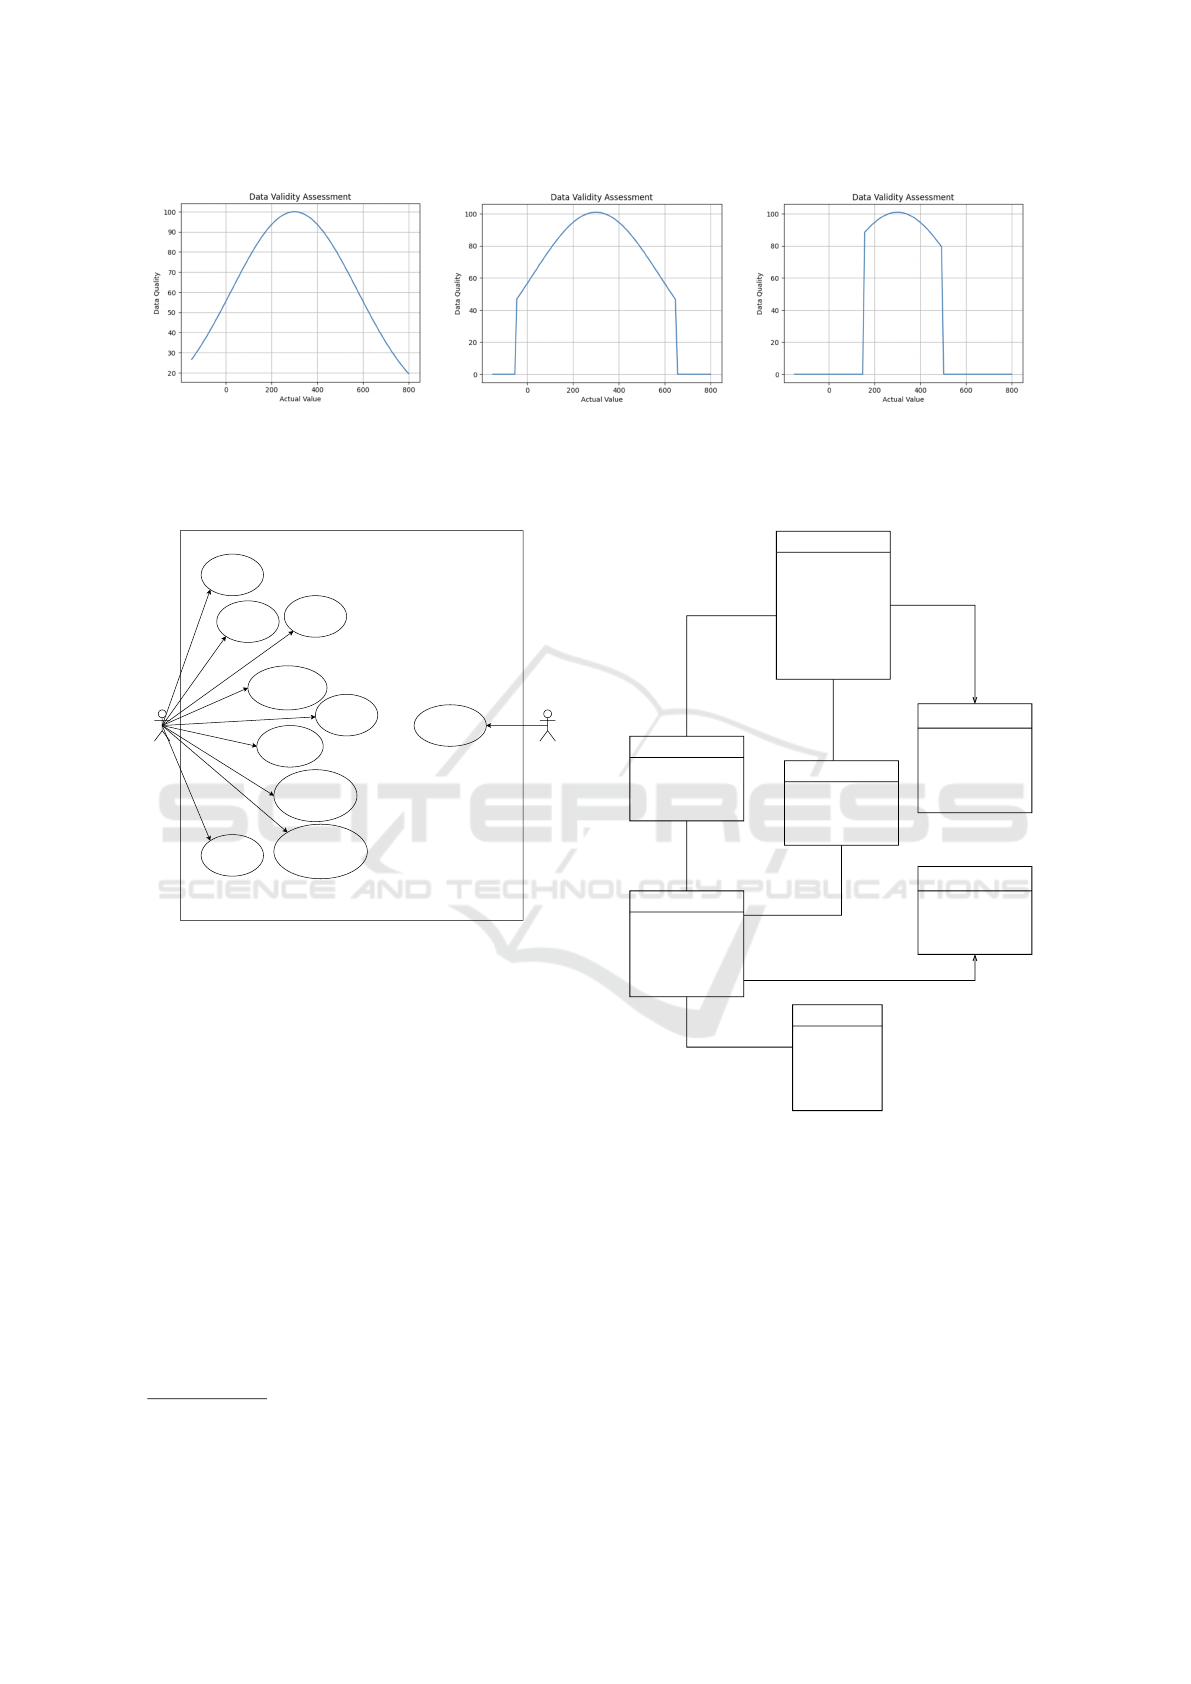
(a) Non-linear exponential function (k
= 0.8)
(b) Non-linear exponential function
with exclusion of values not in the
allowed range around the mean.
(c) Non-linear exponential function
with exclusion of values not between
the minimum and maximum values.
Figure 5: Assessing Data Validity (min=150, max=500, mean=300).
Create new
productive activities
Delete productive
activities
Validation
Platform
Validate metric
value
Alter productive
activities
Create new
records
Create new
metrics
Alter metrics
Delete metrics
Associate metrics with
productive activities
Disassociate metrics with
productive activities
Admin User via API
Figure 6: Use Case Model for the T&C Traceability Plat-
form.
framework, and Keycloak
4
for user authentication
and authorization; and, a frontend web application for
the Admin user profile, built with Next.js
5
.
The flow begins with admin users accessing the
Next.js frontend, which interacts with the FastAPI
backend. Upon initiating requests, authentication is
managed through Keycloak, ensuring secure access.
The backend, in turn, retrieves and stores data in the
PostgreSQL database, facilitating the Quality Assess-
ment service. This architecture enables a seamless
and secure workflow for value metrics assessment and
enables the collection of value metrics for building a
dataset for future work toward an ML-based assess-
ment service.
The user will authenticate from the frontend of the
developed back office. After the authentication is suc-
cessful, the Keycloak server will return a token. Then,
4
https://www.keycloak.org
5
https://nextjs.org
ProductionActivityMetric
+ min
+ max
+ mean
+ k
+ minDegValid
+ minDegSuspect
Metric
+ name
+ description
+ unit
ProductionActivity
+ name
+ reference
+ field: type
ValueRecord
+ value
+ datetime
+ validity_degree
+ lot_reference
1
*
1
*
1
*
1
*
ValidationFormula
<<enum>>
+ linear
+ exponential
+ exp_strict_range
+ exp_strict_MinMax
-formula1
-activity
-metric
-activity
-metric
-values
-values
-customParsByMetric
-customParsByActivity
Validity Category
<<enum>>
+ Valid = 1
+ Suspect = 0
+ Invalid = -1
+ validity_category 1
Organization
+ name
+ orgCode
+ eac
+ country
1
*
-organization
Figure 7: Domain Model for the T&C validation Platform.
this token will be passed to the backend, where it will
ensure that the token is valid, to ensure maximum se-
curity possible. In a case the user is accessing the val-
idation service via API, the explained flow remains
the same but, instead of the authentication being done
through the back office, it is done through a Keycloak
endpoint specifically for this purpose.
ICEIS 2024 - 26th International Conference on Enterprise Information Systems
294

6 CONCLUSION AND FUTURE
WORK
Economic globalization has meant that business part-
ners (or companies) based in various parts of the
world can participate in the global product’s value
chains. As a result, products often travel many kilo-
meters around the world, involving different trans-
port companies. This phenomenon amplifies the
complexity of regulatory frameworks and legal juris-
dictions governing product manufacturing. Conse-
quently, within a product’s value chain, there may be
highly automated companies using IoT devices and
Artificial intelligence (AI), and also companies with-
out any form of digitalization.
Regardless of the level of digitalization of the
companies involved in the value chain, for imple-
menting the traceability of a product and store infor-
mation for calculating its sustainability index, there is
the need to collect and integrate data from all partici-
pants in the value chain, from the creation of raw ma-
terials, transport, manufacturing, etc. until it reaches
the final consumer. Before integrating the collected
data, in the moment of collecting it, the quality and
veracity of the data must be ensured. Thus, the data
must be validated in an homogeneous manner regard-
less of the level of digital maturity of the business
partner company.
This article has presented a solution for validating
the data collected by any of the business partners in-
volved in the T&C value chain, before integrating it in
a traceability platform. This article arises within the
scope of a project whose objective is to collect infor-
mation throughout the value chain of the textile and
clothing industries, in order to implement the digital
passport of products and allow the calculation of the
product’s sustainability index.
As future work, we intend to use Machine Learn-
ing algorithms, trained with the dataset being built
with the presented service, allowing for more dy-
namic and accurate data validation.
ACKNOWLEDGEMENTS
This contribution has been developed in the context
of Project ”BE@T: Bioeconomia Sustent
´
avel fileira
T
ˆ
extil e Vestu
´
ario-Medida 1”, funded by ”Plano de
Recuperac¸
˜
ao e Resili
ˆ
encia” (PRR), through mea-
sure TC-C12-i01 of the Portuguese Environmen-
tal Fund (”Fundo Ambiental”). For improving the
manuscript’s text some AI-based tools have been
used, such as Google Translator and Writefull. The
plots presented in the manuscript have been based on
a Chat-GPT suggested program in Python.
REFERENCES
Alves, L., Cruz, E. F., Lopes, S. I., Faria, P. M., and da Cruz,
A. M. R. (2022a). Towards circular economy in the
textiles and clothing value chain through blockchain
technology and iot: A review. Waste Management &
Research, 40(1):3–23. PMID: 34708680.
Alves, L., Cruz, E. F., and Rosado Da Cruz, A. M. (2022b).
Tracing sustainability indicators in the textile and
clothing value chain using blockchain technology. In
2022 17th Iberian Conference on Information Systems
and Technologies (CISTI), pages 1–7.
Alves, L., S
´
a, M., Cruz, E. F., Alves, T., Alves, M., Oliveira,
J., Santos, M., and Rosado da Cruz, A. M. (2024).
A traceability platform for monitoring environmen-
tal and social sustainability in the textile and clothing
value chain: Towards a digital passport for textiles and
clothing. Sustainability, 16(1).
Cichy, C. and Rass, S. (2019). An overview of data quality
frameworks. IEEE Access, 7:24634–24648.
Cruz, E. F. and da Cruz, A. M. R. (2020). Design science
research for is/it projects: Focus on digital transfor-
mation. In 15th Iberian Conf. on Information Systems
and Technologies (CISTI), pages 1–6.
Dias, R., Cruz, E. F., and Rosado Da Cruz, A. M. (2023).
Traceability platform for the textile and clothing value
chain. In 23 Confer
ˆ
encia da Associac¸
˜
ao Portuguesa
de Sistemas de Informac¸
˜
ao (CAPSI’2023), pages 1–7.
Even, A. and Shankaranarayanan, G. (2007). Utility-
driven assessment of data quality. SIGMIS Database,
38(2):75–93.
Hevner, A. R., March, S. T., Park, J., and Ram, S. (2004).
Design science in information systems research. MIS
Quarterly, 28(1):75–105.
Pipino, L. L., Lee, Y. W., and Wang, R. Y. (2002). Data
quality assessment. Commun. ACM, 45(4):211–218.
Sebastian-Coleman, L. (2012). Measuring Data Quality for
Ongoing Improvement: A Data Quality Assessment.
Morgan Kaufmann.
Wang, R. Y. and Strong, D. M. (1996). Beyond accuracy:
What data quality means to data consumers. J. Man-
age. Inf. Syst., 12(4):5–33.
Williams, A., Hodges, N., and Watchravesringkan, K.
(2023). An index is worth a thousand words: Con-
sidering consumer perspectives in the development of
a sustainability label. Cleaner and Responsible Con-
sumption, 11:100148.
Data Quality Assessment for the Textile and Clothing Value-Chain Digital Product Passport
295
