
A Novel Approach in Testing Life-Monitoring Technologies for Ageing in
Place: A Focus on Fall Detection and Behavioural Alerts
Nicolas Bioul
1, 2, 3, 5
, Arthur Pisvin
1, 2, 3, 5
, Maxim Lamirande
4
, J
´
er
ˆ
ome Lecl
`
ere
1, 2, 3, 5
,
Lucas El Raghibi
1, 2, 3
, Adrien Denis
1, 2, 3
and Beno
ˆ
ıt Macq
1, 2, 3, 5 a
1
OpenHub Place du Levant 3, Louvain-la-Neuve, Belgium
2
Pixels and Interactions Lab, UCLouvain, Place du Levant 3, Louvain-la-Neuve, Belgium
3
ICTEAM, UCLouvain, Place du Levant 3, Louvain-la-Neuve, Belgium
4
Inter’Act, ULi
`
ege, All
´
ee de la d
´
ecouverte 9, BuildingB52/3, Li
`
ege, Belgium
5
TRAIL Institute, Belgium
Keywords:
AI, Digital Twin, Silver Economy, Innovative Testing Methods, Fall Detection, Assistive Technology,
Geriatrics.
Abstract:
Addressing the issues of age and disability, our study presents a systematic technique for evaluating smart
home technology designed to improve independent living. While acknowledging companies’ efforts in this
field, we created a framework to assess potential solutions using a rigorous demographic study that defined
various user profiles - or personae - as the foundation for our comparison research. Our methodology is based
on a dual-focused analytical approach: analysing installation processes and operating performance, with a
particular emphasis on fall detection and behaviour analysis. To evaluate fall detection, we developed a test
protocol, which resulted in the compilation of a large database. We pioneered the use of virtual personae
in a game engine for behavioural analysis, which are simulated in living contexts via probabilistic activity
generation. This novel approach allowed the creation of virtual sensor data, which was then analysed by AI
algorithms thus generating alerts. This study emphasises the possibility for combining IoT and AI to reduce
the need for institutional care by offering real-time help and monitoring. Our methodology takes a thorough
approach to assessing the efficacy of smart home devices, ensuring that they are adaptable to the real-world
demands of the ageing population and people with disabilities.
1 INTRODUCTION
Currently, many ageing people or people with disabil-
ities are unable to live independently due to issues
within their daily lives such as cognitive problems,
general health issues or a simple fall down a flight of
stairs . . . the responsibility often falls on family mem-
bers, commonly resulting in their placement in spe-
cialised institutions or retirement homes. This prac-
tice not only impacts the emotional and physical well
being of the older population but also represents a sig-
nificant ficial burden for governments, which invest
heavily in subsidising these facilities.
Recent studies have shown that the life expectancy
of individuals in long-term care facilities, including
nursing homes, can be notably lower compared to
a
https://orcid.org/0000-0002-7243-4778
those living independently. For instance, an older
people moving to a long-term care facility might see
a drastic reduction in life expectancy, with mortality
rates as high as 50%−60% within the first year of res-
idence. In contrast, seniors living in retirement com-
munities, which offer a more supportive and engaging
environment, might enjoy a longer and stronger life
(Boucaud-Maitre et al., 2023), (Lubitz et al., 2003),
(Nugraha and Aprilia, 2019).
This contrast raises an important question: Could
smart home IoT technologies, combined with Artifi-
cial Intelligence (IA), offer a sustainable alternative
for elder and disabled care? Integrating these tech-
nologies into daily routines may delay institutional-
isation by assisting, monitoring, and alerting care-
givers in real-time.
Several companies have asked themselves this
98
Bioul, N., Pisvin, A., Lamirande, M., Leclère, J., El Raghibi, L., Denis, A. and Macq, B.
A Novel Approach in Testing Life-Monitoring Technologies for Ageing in Place: A Focus on Fall Detection and Behavioural Alerts.
DOI: 10.5220/0012733200003699
Paper published under CC license (CC BY-NC-ND 4.0)
In Proceedings of the 10th International Conference on Information and Communication Technologies for Ageing Well and e-Health (ICT4AWE 2024), pages 98-107
ISBN: 978-989-758-700-9; ISSN: 2184-4984
Proceedings Copyright © 2024 by SCITEPRESS – Science and Technology Publications, Lda.

question and propose different kinds of solutions to
support beneficiaries in their lives such as falls de-
tector, behavioural monitoring, sensors and emotion
detectors . . .
Through this paper, we aim to propose a new
framework that allows for an easy yet thorough test-
ing of these technologies, assessing their practical
capabilities in real-world scenarios. This endeavor
is not just a technological assessment but a step to-
wards re-imagining care for this specific population,
offering a vision where the older and disabled can
lead happier, longer lives within the comfort of their
homes, supported by ethical applications of AI and
IoT sensors.
2 DEFINING THE PROBLEM
The increasing prevalence of older institutionaliza-
tion poses significant challenges for healthcare sys-
tems worldwide. Understanding the determits that
lead to institutionalization is crucial for developing
strategies to extend the period that older individuals
can safely live at home. This section explores five de-
termits identified during a specialized conference held
in March 2023.
2.1 Sleep and Aging
Sleep quality significantly affects cognitive function-
ing and aging. Age-related changes in sleep needs and
patterns can lead to insomnia and other sleep disor-
ders, which are prevalent in the older resulting from
commorbities induced by age (Ancoli-Israel, 2009).
Poor sleep quality, including issues like sleep frag-
mentation and sleep apnea, is linked to reduced cog-
nitive abilities and daily functioning, potentially ac-
celerating the institutionalization process (Foley et al.,
2004).
2.2 Malnourishment in Ageing
Malnutrition in ageing individuals, often resulting
from an imbalance in energy and protein intake, is
a critical factor contributing to frailty and depen-
dency (Kaiser et al., 2010). Factors like involuntary
weight loss, appetite control disorders, dental prob-
lems, medication side effects, and changes in body
composition exacerbate this issue, leading to mus-
cle loss, physical weakness, and cognitive impair-
ments, which can hasten the loss of autonomy (Volk-
ert, 2013).
2.3 Social Isolation
Social isolation has profound impacts on both men-
tal and physical health. Prolonged loneliness can de-
crease life quality, even in institutional settings (Corn-
well and Waite, 2009). A lack of social interaction
can increase mortality risk and negatively affect brain
function, highlighting the necessity of meaningful so-
cial engagement to prevent institutionalization (Holt-
Lunstad et al., 2015).
2.4 Physical Activity and Aging
Physical inactivity in the older leads to muscle mass
loss, reduced endurance, and weakness. Regular
physical activity is crucial for preventing falls, a ma-
jor reason for institutionalization (Rubenstein, 2006).
It also slows cognitive decline, enhances oxygen con-
sumption, and prevents sarcopenia, underscoring the
importance of an active lifestyle for maintaining inde-
pendence (Ferrucci et al., 2016).
2.5 Cognitive Disorders
Cognitive impairments affect daily routines and
decision-making, leading to disorientation and confu-
sion. Introducing technology to maintain routines can
be beneficial, but simplicity is key, as learning new
technologies can be stressful for those with cognitive
disorders (Mowszowski et al., 2012). Personalized
activities and routines are vital for maintaining self-
esteem and autonomy in these individuals (Klompstra
et al., 2013).
Understanding the determits of institutionaliza-
tion is essential for developing effective interventions
to extend the independent living of ageing adults.
This section highlighted the importance of addressing
sleep quality, nutrition, social engagement, physical
activity, and cognitive health. The judicious use of
technology can support these efforts, though it should
be implemented with consideration of the individual’s
capabilities and preferences.
A number of companies offer solutions to enable
the ageing people or people with disabilities to re-
main in their own homes. The solutions offered by
these companies are diverse. This paper considers so-
lutions that detect punctual problems such as falls and
analyse the person’s behaviour in order to detect any
problems in their lifestyle. The objective is to present
a framework to study and compare these technologies
in order to select one or more technologies that meets
the needs of these people and provides them with the
best possible support.
A Novel Approach in Testing Life-Monitoring Technologies for Ageing in Place: A Focus on Fall Detection and Behavioural Alerts
99

3 PERSONA ANALYSIS
Personae are designed to create representations of hu-
man behaviour as a way to support project develop-
ment. According to (Nielsen, 2018), “To get prod-
uct design closer to the everyday lives of the users,
design personae are a means to capture the everyday
experiences and needs of users and customers”. In
this research project, personae were devised to frame
the representations of a specific target audience. In
total seven personae were created who each capture
different key characteristics of both mainstream and
outlying user groups. This diversity provides fertile
grounds to explore and understand our target audience
as well as open the project to explore new or under re-
searched areas.
Personae were constructed by crossing raw data
provided by our research partners, testimonials from
32 semi-structured interviews conducted in Spring
2023 with older adults, adults with disabilities, and
professional care provides, as well as census data
published by the Belgian governments, and World
Health Organisation. Key research partners include
four non-profit organizations who either provide hu-
man support to older adults or adults with disabilities,
or technological support in the form of medical alert
bracelets and necklaces that connect the caller to a
dedicated helpline. Data was extracted and analyzed
from 11158 beneficiaries across Belgium, as well as
the medical alert calls made to the provider between
2020 and 2022 (292 251 calls).
The personae were constructed using four layers
that incrementally crossed and compiled new char-
acteristics. The first layer identified user pathologies
crossed with the types of support provided. This in-
cluded disabilities linked to motor, cognitive, or vi-
tal functions and whether the person was totally iso-
lated, lived with others, or received formal and infor-
mal support.
This first layer was then crossed with data about
different types of domiciles. Characteristics included
whether the person lived in a single-story apartment,
and multi-story home, or other alternative living situ-
ations (such as living in a camper / Recreational ve-
hicle (RV) during the summer). Pairings were vali-
dated with some regression analyses but were found
to overweight mainstream lifestyles and overshadow
any diversity. Driven by the project framing and to
create a variety of personae on which the technolo-
gies could be tested, reasonable pairings were made.
For instance, it seemed more reasonable for an older
couple living with their daughter and grandchildren
and who have minor health issues to be paired with
a multi-story home whereas a widowed woman with
mobility concerns was paired with a small furnished
studio in the city center to help combat social isola-
tion.
The third layer added factors related to the instal-
lation and use of new in-home monitoring technolo-
gies. Here, a balanced distribution of reasonable char-
acteristics supported by census data were paired with
the developing personae. This includes whether the
persona rents or owns the apartment (and can make
permanent changes to the space), if they have Wi-Fi
access, or if they have stable and continuous access to
electricity.
Finally, to breathe life into the personae, testi-
monials and user characteristics from semi-structured
interviews were combined with compatible personae
to provide human qualities, such as a reluctance to
try new technologies, a newfound sense of freedom,
a stubbornness to refuse help, a fear of bothering
friends, family, and service providers, or a desire to
stay connected with younger family members though
new technologies.
Overall, from these personae, many features were
taken into consideration when constructing their dig-
ital twin, as detailed in section 5.2. Key categories
include types of assistance (formal and informal),
health conditions (physical, sensory, vital, cogni-
tive, and other health issues), autonomy levels, and
living situations (house types and technological ac-
cess). Common features across personae involve a
detailed consideration of their living environments,
health challenges, and the support network, ensuring
a nuanced simulation base for technology testing.
4 METHODICAL APPROACH
The objective of this section is to elucidate the pro-
cess of comparing and classifying the different ser-
vices to be installed inside homes to launch alerts.
Specifically, the study aims to bring together a range
personal assistance solutions that enable alerts to be
issued in the event of problems.
The comparison process comprises several dis-
tinct steps. Firstly, the installation process is com-
pared, considering that time is a precious resource for
large-scale installations and must be taken into ac-
count. Secondly, two categories of alert triggers are
considered: alerts resulting from a fall and alerts re-
sulting from a change in daily routines.
4.1 Installation
The transition through aging should be navigated
smoothly. This is why the installation of technolo-
ICT4AWE 2024 - 10th International Conference on Information and Communication Technologies for Ageing Well and e-Health
100
gies is a critical point that must meet a number of cri-
teria. To be installed in a home, they need to be as
discreet as possible and put into operation as quickly
as possible, without causing any damage. In addition,
it shouldn’t be noticeable on the electricity bill, ei-
ther for the wallet or for the planet. These criteria are
summarized on table 1 and are the reference for the
installation testing.
Table 1: installation criteria.
Criteria Description
Kit supplied All components for the
installation are provided and
safe.
Installation time Total time to install the
solution.
Discretion All components are
seemlessly integrated in a
home.
Damage Installation caused
permanent damage on the
wall, ground, etc.
Consumption Electrical power
consumption of all devices.
4.2 Alerting
Tasks such as fall detection and triggering alerts for
behavioural changes belong to the broader classifica-
tion tasks family, as they involve distinguishing be-
tween positive and negative outcomes. In this paper,
we counted the number of True Positive (TP), False
Positive (FP), True Negative (TN) and False Negative
(FN) to find the F1-score.
• True Positives (TP) are instances where the sys-
tem correctly predicts the positive alert.
• False Positives (FP) are instances where the sys-
tem incorrectly predicts the positive alert when it
is actually negative.
• True Negatives (TN) are instances where the sys-
tem correctly predicts the negative alert.
• False Negatives (FN) are instances where the sys-
tem incorrectly predicts the negative alert when it
is actually positive.
This F1-score considers the balance between pre-
cision and recall. Precision measures the accuracy
of positive predictions, calculated as the ratio of true
positives to the sum of true positives and false posi-
tives.
Precision =
T P
T P + FP
(1)
Recall, on the other hand, measures the proportion
of actual positives that were correctly identified, cal-
culated as the ratio of true positives to the sum of true
positives and false negatives.
Recall =
T P
T P + FN
(2)
The F1-score combines these metrics into a single
value, providing a harmonic mean of precision and
recall. It is calculated using the formula:
F1-score =
2 ·(Precision ·Recall)
Precision + Recall
(3)
This score ranges from 0 to 1, where a higher
value indicates better performance in terms of both
precision and recall.
5 METHOD IMPLEMENTATION
This section explain how experiments are conducted
in order to compare solutions from different compa-
nies.
5.1 Falls
Fall detectors utilize various sensor types, including
wearables and wall-mounted devices. To conduct a
comprehensive comparative study, the authors estab-
lished a simulated living room environment. Modu-
lar rooms representing bedrooms, kitchens, or living
rooms were created by arranging furniture and deco-
rations. A set of predefined environments facilitated
a reproducible set of experiments. Wall-mounted sen-
sors were strategically placed according to the manu-
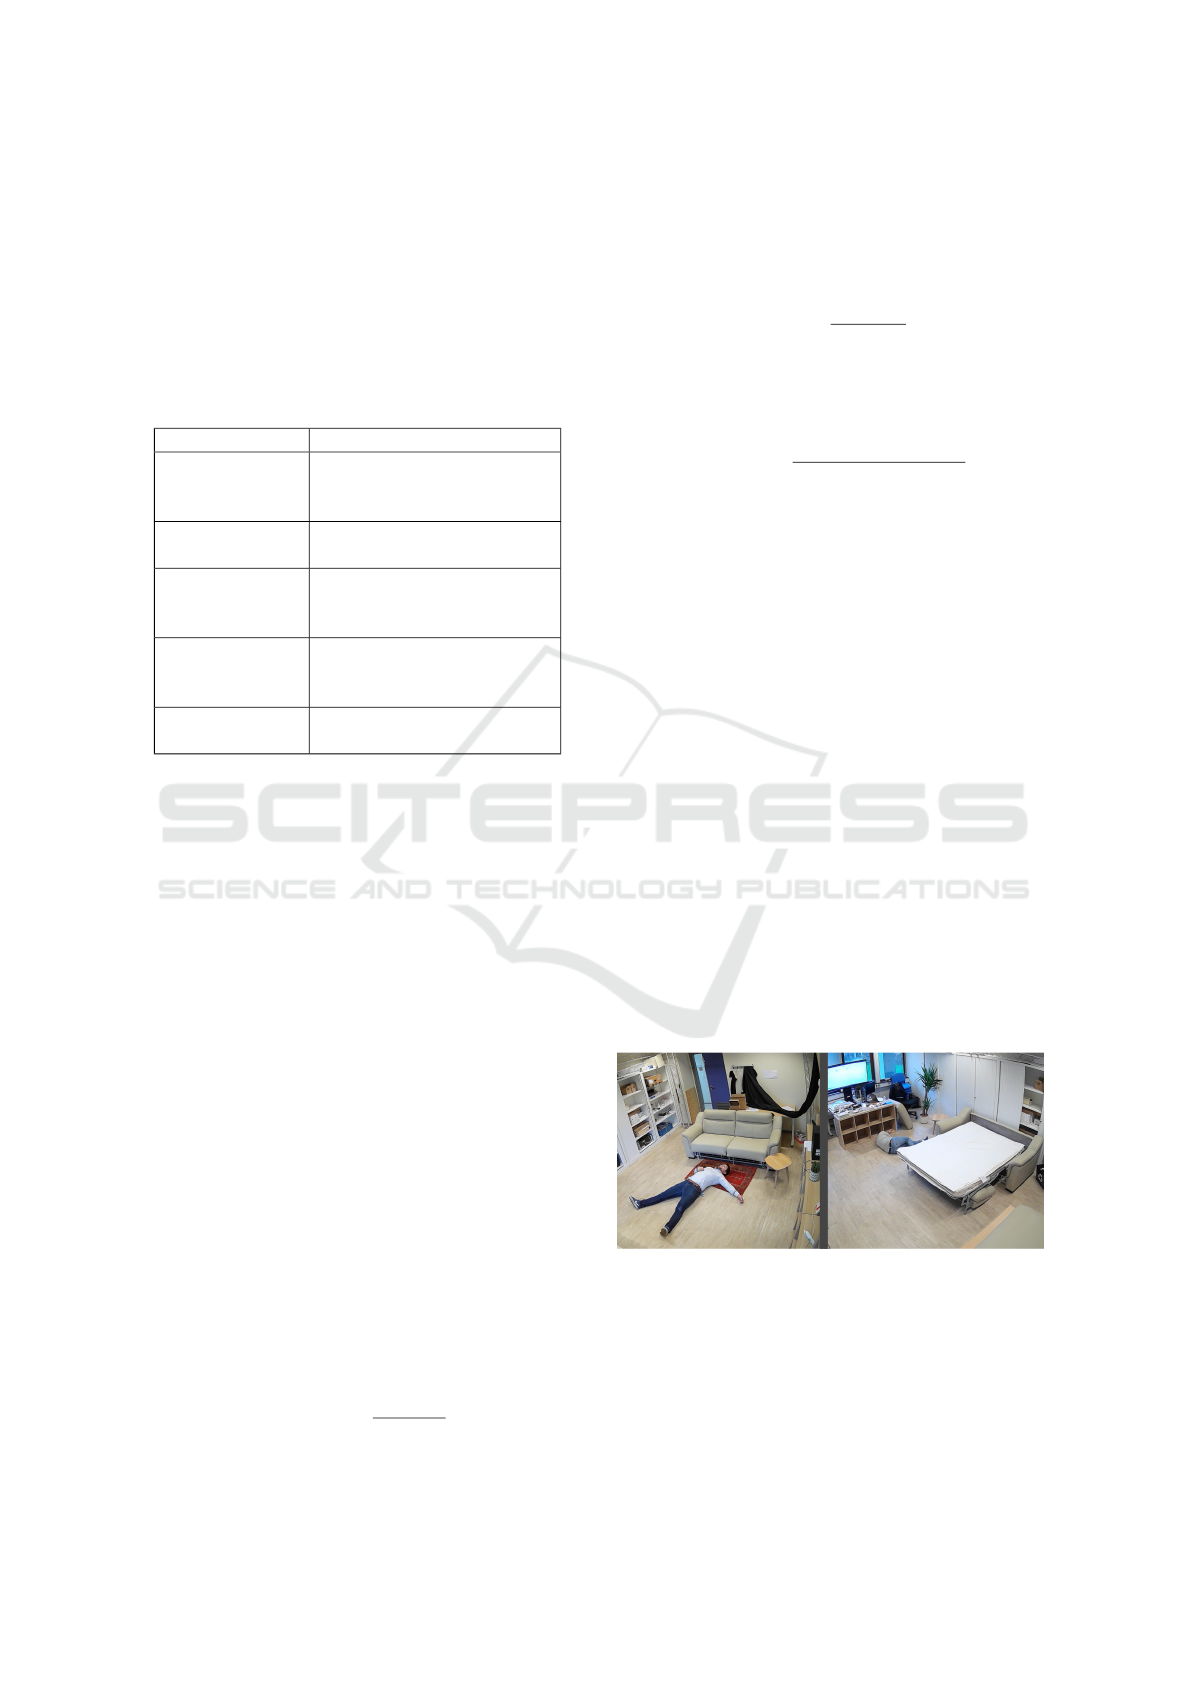
facturer’s guidelines as shown in Figure 1.
Figure 1: Example of set-up falls.
The authors conducted a series of falling scenar-
ios, totaling over 300 falls in the experimental room.
For each fall, experimenters recorded which sensors
detected the event and applied the scoring method
outlined in the previous section.
A Novel Approach in Testing Life-Monitoring Technologies for Ageing in Place: A Focus on Fall Detection and Behavioural Alerts
101
One significant contribution of this study is the
creation of a comprehensive database. Bascom cam-
eras recorded every fall during testing, providing
high-quality footage (1920 x 1080 resolution, 25 fps)
with wide-angle lenses (112
◦
) and infrared night vi-
sion (up to 20 meters) in complete darkness. This
database comprises over 300 recorded falls, along
with various other situations (such as interactions
with animals or sitting on a sofa), resulting in many
hours of footage from the experimental room. Addi-
tionally, recordings were made in a real home to en-
hance contextual variability. These recordings, cat-
egorized into falls and non-falls, are available upon
request to the authors.
5.2 Behaviour Analysis
Among the solutions commercialized by companies,
some use learning aptitudes to capture the behaviour
of beneficiaries by recording and analysing their
movements within their homes. This is accomplished
through various means such as movement sensors,
door-opening sensors, or wearable sensors. Behind
these solutions, machine learning algorithms were
employed. These algorithms require data to learn ben-
eficiaries’ habits and detect outliers that may corre-
spond to alerts.
A straightforward approach to test these algo-
rithms involved installing each solution in multiple
homes and then requesting feedback from the bene-
ficiaries to confirm or deny the triggering of alerts.
However, evidently, this approach was ultimately dis-
carded to prevent any potential inconvenience and
ethical issues due to monitoring.
The primary novelty of this paper lies in its unique
approach. Rather than using real homes, the authors
opted for virtual homes along with virtual beneficia-
ries, effectively forming a digital twin. To model
habits within this virtual environment, the authors em-
ployed a sophisticated system of layers, combining
various statistical tools explained in Appendix A.
A set of characters are accommodated for each
simulation, residing in various homes according to the
personae identified in the section 3. Indeed, in a real
individual’s life, it’s crucial to incorporate their entire
environment (family, friends and pets). We decided to
represent the entire environment by forming a family
consisting of several personae whose lives intertwine.
Each persona is characterized by a set of attributes, as
outlined in Table 2. Ultimately, once the simulation
has run, our aim is to generate a comprehensive list of
visited rooms within the home for each time step (1
minute).
The lives of personae are structured around vari-
Table 2: Attributes of persona.
Attribute Description
Name This unique name identifying the
persona
Family This binds the persona to a group
of persona represented by family
friends and pets.
Owner This value represents if the persona
is a home owner.
Stack Data structure gathering current
running activities.
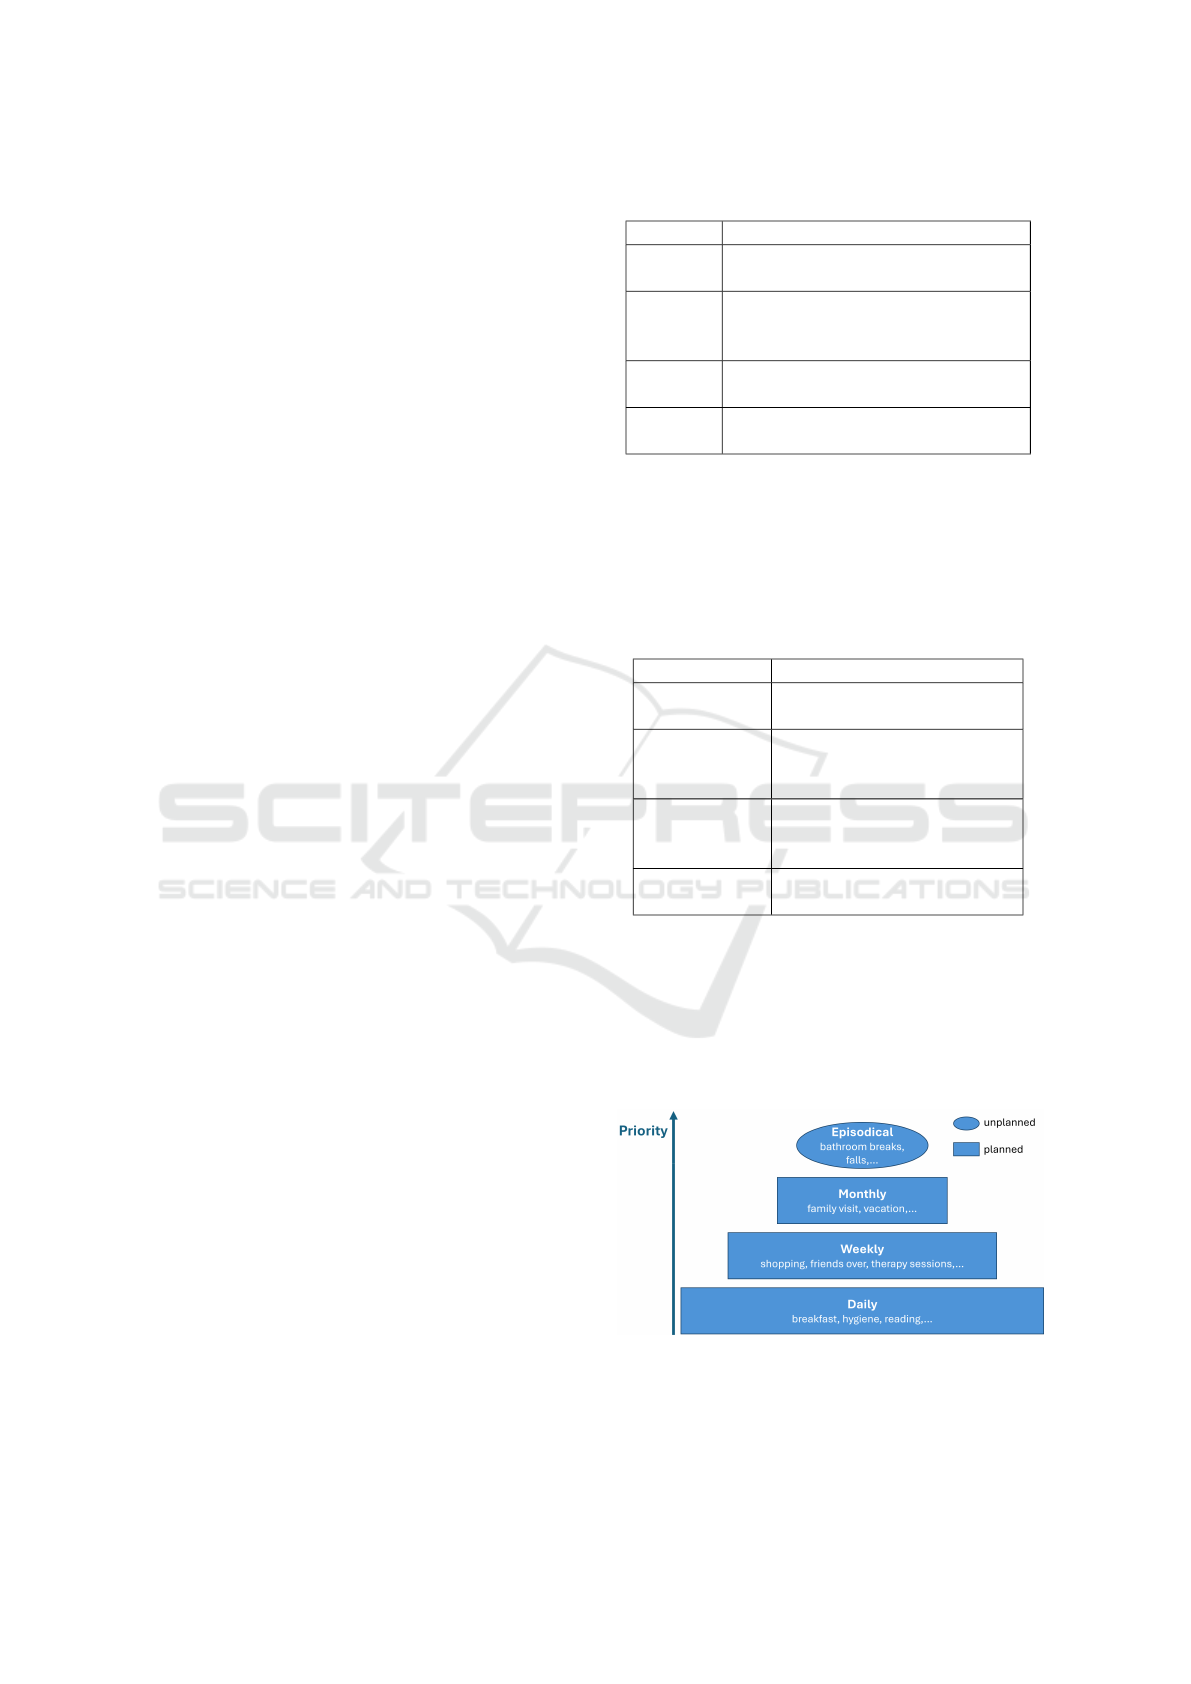
ous activities, such as breakfast, reading or family vis-
its. Activities were divided in two sections; planned
activities (daily, weekly and monthly activities) and
unplanned activities (such as episodical events, see
Figure 2). In the simulation, each activity is com-
prised of different attributes, as detailed in Table 3.
Table 3: Attributes of activity.
Attribute Description
Name This unique name
identifying the activity
Priority Integer representing the
relative importance of an
activity
Activation
distribution
Statistical distribution
representing the probability
that this activity is activated.
List of rooms Rooms visited in this
activity.
The priority assigned to an activity reflects its rel-
ative importance compared to other activities, as illus-
trated in Figure 2. What is referred to as daily activ-
ities are what were classified as activities of ”unim-
portance” or leisure activities. The priority of each
activity can be adjusted in regards to the situation and
the persona.
Figure 2: Activities priority level.
As an example if a person reads in their living
room around 10 a.m, then one would usually find
them reading there. Say now that a bathroom break
ICT4AWE 2024 - 10th International Conference on Information and Communication Technologies for Ageing Well and e-Health
102
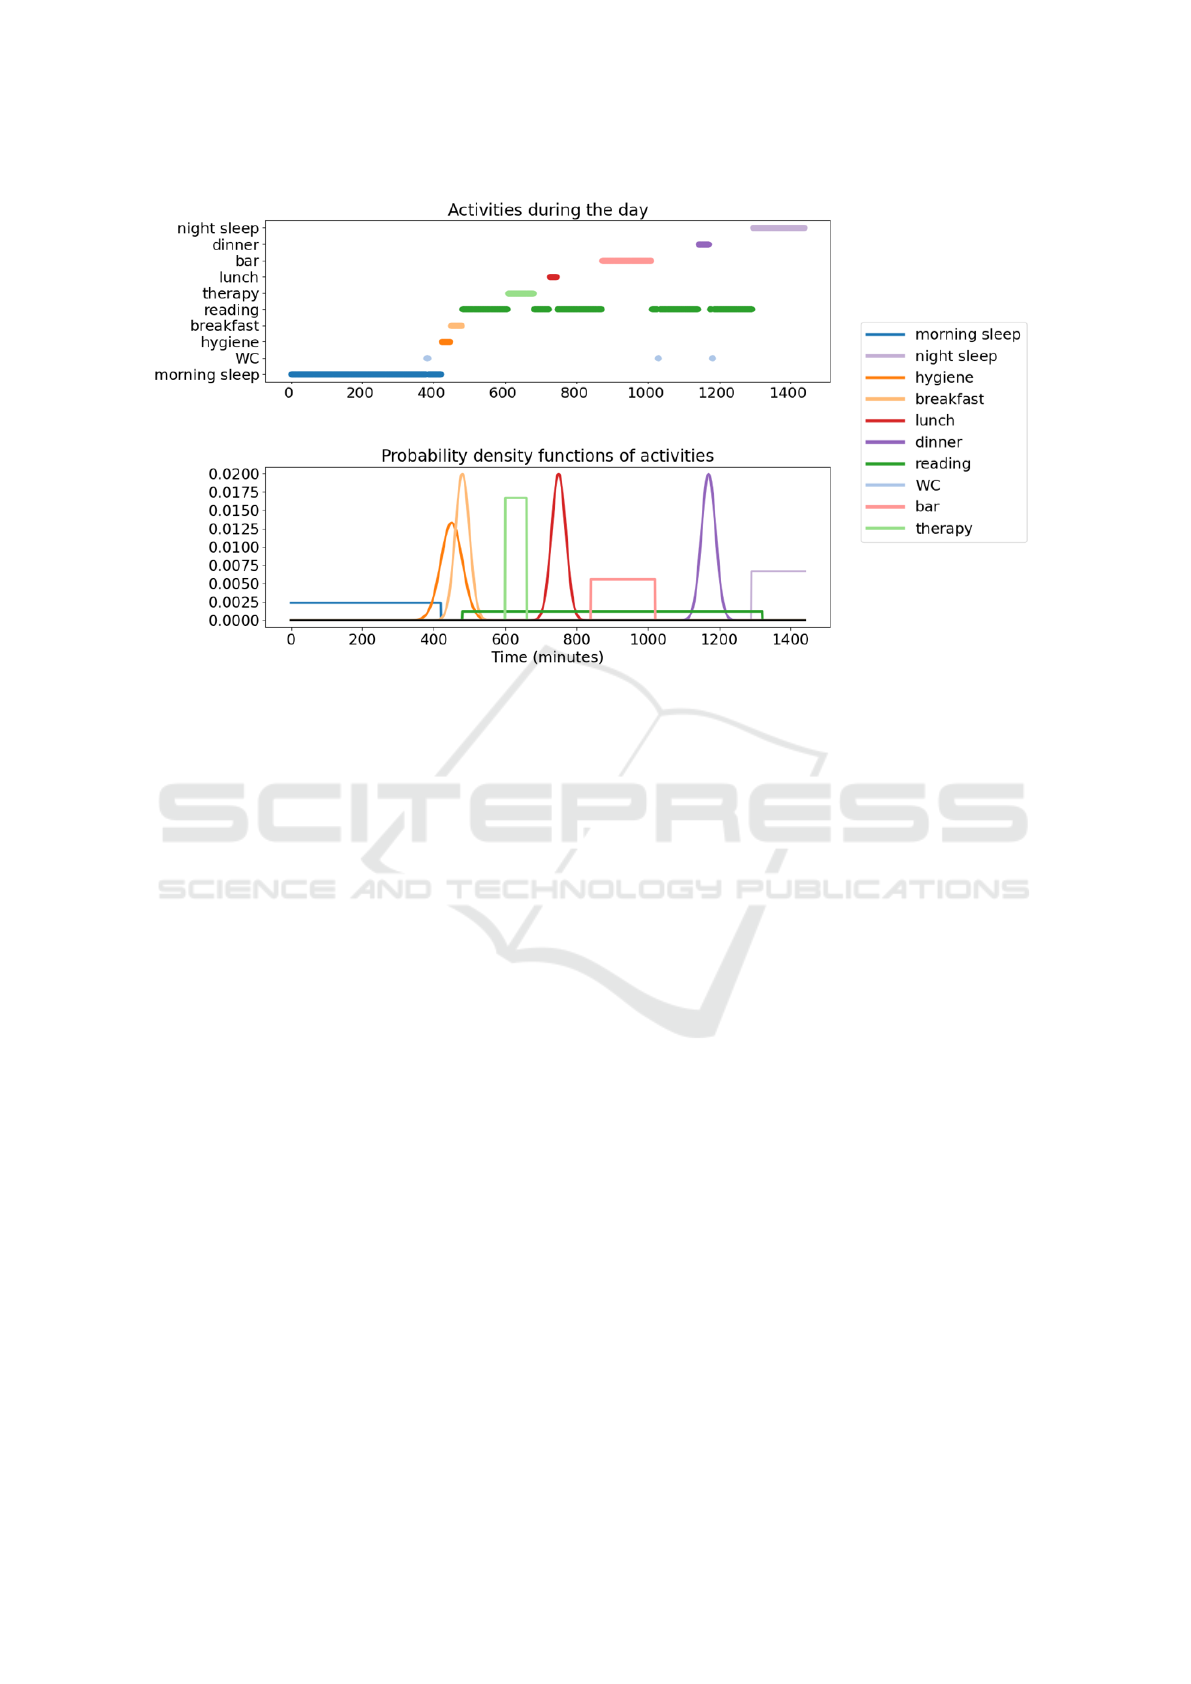
Figure 3: Activation function based on probability density functions (on the bottom) for each activity (on top) a persona may
undertake during a standard day.
is selected, the priority will ensure that the persona
will not finish its reading activity before going to the
bathroom. The bathroom break activity will directly
kick-in and reading will resume after the bathroom
break finishes. Note that once resuming, the remain-
ing amount of time for reading will have been reduced
by the time spent in the bathroom.
In that same regard, if a shopping session (consid-
ered a weekly event) overlaps with a reading activity,
the shopping session takes precedence. This layered
system enables the simulation of different days while
maintaining the same daily routine meaning each day
is based on the same pattern but is never quite the
same. At the highest level of the priority hierarchy
are episodic activities, which are unpredictable com-
pared to planned activities. Episodic activities re-
group things like urinary urgencies, trips to the hos-
pital, falling and other unforseen events.
For every persona, a stack is maintained to moni-
tor their current activity. A stack is a linear data struc-
ture ordered by priority rules, where activities are ar-
ranged based on their urgency or importance, with
the highest priority at the top. The activity with the
highest priority is treated as the current activity and is
pushed onto the stack.
Two scenarios can introduce a new activity to the
stack. First, if a higher priority activity than the cur-
rent one is activated, it’s added on top of the stack and
reconsidered as the current one. During each time
step, the duration of all activities in the stack is re-
duced by one minute. When an activity’s remaining
duration reaches zero minutes, it’s removed from the
stack. This process ensures that the most urgent or
important activities are promptly addressed for each
persona. Secondly, if the current activity terminates
without another activity in the stack, all activation
functions of activities are triggered, and the activity
with the highest value of the activation function is
chosen as the new current activity. An example of
generated activities and probability density functions
are illustrated in Figure 3.
To introduce sociological interaction into the sim-
ulation, the authors introduced a special type of ac-
tivity known as ”common activities”. These activi-
ties, initiated by one persona, are added to the stack
of other personas who are involved. This method fos-
ters interaction between personas, a crucial element
for creating a realistic simulation that mirrors real-life
scenarios.
The global randomness of each day resides in the
selection of each activities and the randomness of
their duration in a set of predefined possible activi-
ties and duration. Based on personas description, a
set of possible activities are established. An example
of activities for one personna is given in Appendix C.
When an activity begins, a set of rooms are visited to
complete this activity. Each room is visited during a
certain amount of time. This time is also given by a
random distribution. As an example, when one wakes
up in the morning, usually a hygiene activity is initi-
A Novel Approach in Testing Life-Monitoring Technologies for Ageing in Place: A Focus on Fall Detection and Behavioural Alerts
103

ated. This entails 3 rooms: the toilet, the bathroom
and the bedroom, where waking up, taking a shower
or washing up, urinating and getting dressed success-
fully take place. The order in which these take place
leaves more room for randomness.
After generating all activities and visited rooms
for each persona, the next step is to create a virtual en-
vironment to model displacement inside homes. Un-
real Engine
1
was selected as the platform to construct
the digital twin. Each persona is represented by a
meta-human
2
. These meta-humans move within the
home based on generated data.
The solutions proposed by the companies we
aimed to test rely on motion detectors to provide
alerts. To simulate these sensors within Unreal En-
gine, virtual sensors are created. These sensors acti-
vate when a meta-human is in motion inside the vir-
tual environment as shown in Figure 4. All data col-
lected by the virtual sensors is stored in memory for
analysis.
Figure 4: Example of simulation where a meta-human is in
motion in one room (green box). The other empty room has
a white box.
At the conclusion of this process, we gather all
the data extracted from the virtual sensors. This data
encompasses the movements and interactions of the
meta-humans within the simulated environment, pro-
viding a comprehensive record of their presence in
different rooms. With the generated data in the form
of a CSV file, the companies could successfully test
their algorithms. The authors manually changed ac-
tivities to correspond to outliers to simulate abnormal
activities. As an example, a fall could be translated
by an abnormal 3 hours stay in the toilet or bathroom.
Dementia or a loss of memory could be translated by
an extended amount of time shopping; instead of a
typical 2 hours shopping session, we’d have a 5 hours
shopping session. By recovering the output of these
algorithms, we are therefore capable of assessing their
1
Unreal Engine (UE) is a series of 3D computer graph-
ics game engines developed by Epic Games
2
A Meta-human is a hyper-realistic digital representa-
tion of a human. These digital entities are designed to
mimic human emotions, actions, and intricacies perfectly.
precision by comparing and matching inputs and out-
puts.
6 CONCLUSION
This paper has outlined a thorough framework for as-
sessing life-monitoring technologies intended to sup-
port aging individuals in maintaining independence at
home, with specific emphasis on fall detection and be-
havioral alerts. Through our analysis and experimen-
tation, we have developed a structured approach that
facilitates comparison and evaluation of solutions of-
fered by various companies in this domain. Grounded
in persona analysis, our methodology provides a sys-
tematic framework for assessing the practical capabil-
ities of smart home devices in real-world settings. By
simulating living environments and conducting exten-
sive experiments using digital representations of de-
fined personas, we have gained insights into alert trig-
gers and behavior analysis within smart homes.
However, it is important to recognize the limita-
tions of our study. While our framework introduces
a novel methodology for evaluating life-monitoring
technologies, there are inherent challenges and com-
plexities that must be addressed. For instance, the
simulated environment may not fully replicate the in-
tricacies of real-life situations, particularly regarding
the subtle nuances of human behavior. Additionally,
this environment aimed to capture data from motion
sensors only. More sophisticated sensors like cameras
cannot be replicated in this software.
Moving forward, future research should prioritize
addressing these limitations and refining our method-
ology to improve its effectiveness and relevance. This
includes conducting more extensive user studies to
gather feedback and insights from aging individuals
and individuals with disabilities. Furthermore, ongo-
ing collaboration between researchers, industry stake-
holders, and end-users is essential to drive innovation
and advancement in the realm of smart home tech-
nologies tailored for aging in place.
REFERENCES
Ancoli-Israel, S. (2009). Sleep and its disorders in aging
populations. Sleep Medicine, 10:S7–S11. The Art
of Good Sleep Proceedings from the 6th International
Sleep Disorders Forum: Sleep and Society.
Boucaud-Maitre, D., Letenneur, L., Dram
´
e, M., Taub
´
e-
Teguo, N., Dartigues, J.-F., Amieva, H., and Tabu
´
e-
Teguo, M. (2023). Comparison of mortality and hos-
pitalizations of older adults living in residential care
ICT4AWE 2024 - 10th International Conference on Information and Communication Technologies for Ageing Well and e-Health
104

facilities versus nursing homes or the community. a
systematic review. PLOS ONE, 18(5):1–14.
Cornwell, E. Y. and Waite, L. J. (2009). Social discon-
nectedness, perceived isolation, and health among
older adults. Journal of Health and Social Behavior,
50(1):31–48. PMID: 19413133.
Ferrucci, L., Cooper, R., Shardell, M., Simonsick, E. M.,
Schrack, J. A., and Kuh, D. (2016). Age-related
change in mobility: perspectives from life course epi-
demiology and geroscience. Journals of gerontology
series a: biomedical sciences and medical sciences,
71(9):1184–1194.
Foley, D., Ancoli-Israel, S., Britz, P., and Walsh, J. (2004).
Sleep disturbances and chronic disease in older adults:
Results of the 2003 national sleep foundation sleep in
america survey. Journal of Psychosomatic Research,
56(5):497–502.
Holt-Lunstad, J., Smith, T. B., Baker, M., Harris, T.,
and Stephenson, D. (2015). Loneliness and so-
cial isolation as risk factors for mortality: A meta-
analytic review. Perspectives on Psychological Sci-
ence, 10(2):227–237. PMID: 25910392.
Kaiser, M. J., Bauer, J. M., R
¨
amsch, C., Uter, W., Guigoz,
Y., Cederholm, T., Thomas, D. R., Anthony, P. S.,
Charlton, K. E., Maggio, M., Tsai, A. C., Vellas, B.,
Sieber, C. C., and for the Mini Nutritional Assessment
International Group (2010). Frequency of malnutri-
tion in older adults: A multinational perspective using
the mini nutritional assessment. Journal of the Amer-
ican Geriatrics Society, 58(9):1734–1738.
Klompstra, L., Jaarsma, T., and Str
¨
omberg, A. (2013). An
in-depth, longitudinal examination of the daily physi-
cal activity of a patient with heart failure using a nin-
tendo wii at home: a case report. Journal of Rehabili-
tation Medicine, 45(6):599–602.
Lubitz, J., Cai, L., Kramarow, E., and Lentzner, H. (2003).
Health, life expectancy, and health care spending
among the elderly. New England Journal of Medicine,
349(11):1048–1055. PMID: 12968089.
Mowszowski, L., Hermens, D. F., Diamond, K., Norrie, L.,
Hickie, I. B., Lewis, S. J., and Naismith, S. L. (2012).
Reduced mismatch negativity in mild cognitive im-
pairment: associations with neuropsychological per-
formance. Journal of Alzheimer’s Disease, 30(1):209–
219.
Nielsen, L. (2018). Design personas – new ways, new con-
texts. Persona Studies, 4(2):1–4.
Nugraha, S. and Aprilia, T. (2019). Quality of life of the
elderly living in community and nursing home (study
on 5-dimension quality of life).
Rubenstein, L. Z. (2006). Falls in older people: epidemi-
ology, risk factors and strategies for prevention. Age
and Ageing, 35(suppl 2):ii37–ii41.
Volkert, D. (2013). Malnutrition in Older Adults - Urgent
Need for Action: A Plea for Improving the Nutritional
Situation of Older Adults. Gerontology, 59(4):328–
333.
APPENDIX
A Statistic Tools
The uniform distribution is characterized by a con-
stant probability density function over a specified in-
terval. In the context of behaviour modeling, it’s often
used to represent situations where all outcomes within
a range are equally likely. For example, it can be used
to model the probability to sit in the living room over
the afternoon. The distribution is defined by two pa-
rameters: the minimum and maximum values of the
interval.
f (x) =
1
t
2
−t
1
for t
1
≤ x ≤t
2
(4)
The Gaussian distribution, also known as the nor-
mal distribution, is one of the most widely used distri-
butions in statistics. It’s characterized by a symmetric
bell-shaped curve, with the mean (average) at the cen-
ter and the majority of the data clustered around the
mean. Many natural phenomena follow a normal dis-
tribution, making it particularly useful for modeling
behaviour when the underlying process is influenced
by multiple independent factors. An example is the
morning wake-up time, which revolves around a cer-
tain mean (µ) with a certain standard deviation (σ).
f (x) =
1
σ
√
2π
e
−
(x−µ)
2
2σ
2
(5)
behaviour modeling often involves analyzing the
time intervals between successive events. The expo-
nential distribution provides a mathematical frame-
work for modeling these inter-event times.
f (x;λ) = λe
−λx
(6)
Where λ represents the mean.
A Poisson process is a stochastic process that
models a sequence of events occurring randomly in
time or space. It is widely used in various fields such
as queueing theory, telecommunications, and relia-
bility engineering. The defining characteristics of a
Poisson process are:
1 Independence: Events occur independently of
each other.
2 Stationarity: The probability of an event occur-
ring in a given interval of time or space is the same
for all equivalent intervals.
3 Ordinariness: The process has no simultaneous
events; events occur singularly.
The key formulae associated with a Poisson pro-
cess include:
A Novel Approach in Testing Life-Monitoring Technologies for Ageing in Place: A Focus on Fall Detection and Behavioural Alerts
105
Figure 5: Different room configurations for fall detection.
Table 4: Example of possible activity for one personna.
Activity Name Activity Type Distribution Type Average Standard Deviation Start End Common Unique Day
morning sleep Routine uniforme 0 420
night sleep Routine uniforme 1290 1440
hygiene Routine normale 450 30 TRUE
breakfast Routine normale 480 20 TRUE
lunch Routine normale 750 20 TRUE
diner Routine normale 1170 20 TRUE
reading Routine uniforme 480 1320 FALSE
WC Episodical poisson 300 FALSE
coffee Weekly uniforme 840 1020 TRUE 0;1;3;5
therapist Weekly uniforme 600 660 0;
friends over Monthly normale TRUE TRUE 2;27
friends support Weekly normale 900 1140 2;4;5
family diner Monthly normale TRUE TRUE 12;30
escapade Monthly uniforme 660 780 16;
shopping Weekly uniforme 600 660 TRUE 4;
random kitchen Episodical poisson 960 540 1020 FALSE
ICT4AWE 2024 - 10th International Conference on Information and Communication Technologies for Ageing Well and e-Health
106

Table 5: Example of rooms to visit for one personna.
Activity Name State Name Average Time Standard Deviation
morning sleep Bedroom 40 20
night sleep Bathroom 10 2
night sleep Bedroom 240 30
hygiene Bathroom 20 5
hygiene Bedroom 15 3
hygiene WC 5 1
breakfast Kitchen 30 5
lunch Kitchen 30 5
diner Kitchen 40 10
reading Living Room 30 10
wc WC 5 1
coffee Outdoor 180 40
therapist Outdoor 70 10
friends over Living Room 30 5
friends over Kitchen 40 5
friends over Living Room 30 10
friends support Living Room 30 5
friends support Kitchen 40 5
family diner Kitchen 15 5
family diner Living Room 40 10
family diner Living Room 20 5
escapade Outdoor 2880 50
shopping Outdoor 180 20
random kitchen Kitchen 15 5
• Probability of n events in time t: The probability
that exactly n events occur in a fixed interval of
time t is given by the Poisson distribution formula:
P(N(t) = n) =
e
−λt
(λt)
n
n!
(7)
where N(t) is the number of events occurring by
time t, λ is the rate parameter of the process (aver-
age rate at which events occur per time unit), e is
the base of the natural logarithm (approximately
equal to 2.71828), and n! denotes n factorial.
• Inter-arrival Times: The time between consecu-
tive events in a Poisson process follows an expo-
nential distribution with probability density func-
tion defined in equation 6.
These formulae encapsulate the mathematical
structure of a Poisson process, describing both the dis-
tribution of the number of events within a given time
frame and the statistical properties of the intervals be-
tween these events. For example, the Poisson process
can be used to model the time between going to the
toilet.
B More on Sensor Testing
During sensor testing, various configurations of room
setups were systematically analysed to evaluate the
efficacy of sensor-based monitoring systems designed
to detect falls and behavioural anomalies among the
elderly living independently. The testing environ-
ments mimicked typical residential settings, incor-
porating common furniture arrangements and living
spaces. Twelve distinct configurations were assessed
(see Figure 5), each varying in the spatial layout and
positioning of key furniture pieces such as sofas, ta-
bles, and beds, as well as the strategic placement of
wall-mounted sensors to maximise coverage and min-
imise blind spots. These configurations also included
open spaces to simulate potential fall zones, delimited
by red dashed lines, indicating the areas where fall in-
cidents were emulated during the trials. The diversity
in room setups provided a comprehensive range of
scenarios to test the sensors’ responsiveness to actual
falls versus routine activities, ensuring robustness in
varied domestic landscapes. The sensor systems were
challenged with different angles and distances from
the fall zones, furniture obstructions, and varying lev-
els of ambient lighting, all of which are critical factors
in the real-world application of such technologies.
C Possible Activities for a Personna
As described in section 5.2, days are statistically gen-
erated using a specifically written algorithm. How-
ever this algorithm has a base. This base is comprised
of activity names, states and important parameters for
each distribution. That is, each activity will be a series
of states and each state will yield a specific distribu-
tion based on the average time and standard deviation
in the following tables. The distribution type is dic-
tated by the activity (see table 4) and appears chron-
ically depending on the frequence (column Activity
Type in table 4.) As can be noticed, some distributions
don’t require average time and standard deviation.
For the more complexe activities, some have start-
ing and ending points (in order to avoid morning sleep
at 10pm at night) and others are unique in order to
avoid, for example, having lunch twice. Finally for
the non-daily activities, days of the week and month
are given in order to make this activities happen only
on these given dyas. Keep in mind that for weekly
activities, the given days range from 0 to 6 while for
monthly activities, these days are given from 0 to 30.
Within the month, weekly activities loop using a 7 day
congruence in order to loop. That is of every Mon-
day, the persona goes swimming, then the date of the
month will be converted into the day of the week us-
ing the residue of the euclidienne division by seven.
A Novel Approach in Testing Life-Monitoring Technologies for Ageing in Place: A Focus on Fall Detection and Behavioural Alerts
107
