
NILM-Based Solutions for the Automation of Energy Services in
Residential Buildings
Pierre Ferrez
a
, Dominique Gabioud
b
and Pierre Roduit
c
Institute of Sustainable Energy, University of Applied Sciences and Arts Western Switzerland,
Rue de l’industrie 23, 1950 Sion, Switzerland
{firstname.name}@hevs.ch
Keywords:
Non Intrusive Load Monitoring (NILM), Heat Pump (HP), Space Heating (SH), Domestic Hot Water (DHW),
Energy Services, Energy Efficiency (EE), Fault Detection and Diagnostics (FDD).
Abstract:
In Switzerland, about 40 % (90 TWh) of the energy needs are due to buildings and about 70 % of these needs
come from heating. Therefore, improving the efficiency of buildings has a high potential for energy savings.
This paper presents innovative solutions for the automation of energy services in residential buildings, based
solely on the disaggregation of the centralized electricity consumption measurement of the household. The
developed method was successfully used on electricity consumption data recorded in 14 households over a
year to (1) extract the heat pump consumption from the aggregated consumption, (2) split the heat pump
consumption into space heating and domestic hot water consumption and (3) split the remaining consumption
into four categories: base load, low power, medium power, and high power. With a daily average error on the
prediction of the heat pump consumption below 3.5 % and daily average errors on the prediction of the number
of cycles and the operating time of the heat pump both around 1 %, the described method can be used for the
development of energy service prototypes allowing to better understand and optimize the energy functioning
of residential buildings with potential savings for the residents.
1 INTRODUCTION
In Switzerland, greenhouse gas emissions from build-
ings, mainly in the form of carbon dioxide (CO
2
), are
primarily produced by the use of fossil fuels to heat
buildings and provide hot water in both residential
and commercial buildings (Federal Office for the En-
vironment, 2023). Buildings consume yearly around
90 TWh or about 40 % of the final energy demand,
and heating (Space Heating (SH) and Domestic Hot
Water (DHW)) accounts for around 70 % of the en-
ergy consumption of buildings (Swiss Federal Office
of Energy, 2023). Furthermore, due to poorly con-
figured or malfunctioning heating systems, and/or the
behaviour of residents, up to approximately 30 % of
this consumption is wasted (Rashid and Singh, 2018;
Bang et al., 2019).
Therefore, improving the efficiency of buildings
has a high potential for energy savings, and since
heating appliances contribute to a significant part of
the energy consumption of buildings, both Energy
a
https://orcid.org/0009-0003-0926-4934
b
https://orcid.org/0000-0002-4279-6428
c
https://orcid.org/0000-0001-9747-2036
Efficiency (EE) and Fault Detection and Diagnos-
tics (FDD) techniques focused on heating appliances
are essential in the development of feedback systems
in order to reduce energy consumption in buildings.
Paradoxically, residents have in most cases a very lim-
ited understanding of their building’s energy system,
as digitalization and smart technologies have hardly
penetrated the building domain. Nevertheless, imple-
menting EE and FDD feedback systems can result in
20 to 30 % of energy savings in buildings (Kim and
Katipamula, 2018) and the potential savings for res-
idents who are provided with detailed feedback on
the individual consumption of their appliances can ex-
ceed 12 % (Carrie Armel et al., 2013).
In order to optimize the efficiency of a household,
and before launching into renovations or changes of
often expensive appliances, it is essential to under-
stand the consumption of large consumers such as
SH appliances, DHW appliances, white appliances or
continuously consuming appliances. These data can
be obtained through the installation of dedicated sub-
meters. However, if such installations are feasible in
the framework of a pilot project, they are not realis-
tic on a large scale due to their cost (intervention of
Ferrez, P., Gabioud, D. and Roduit, P.
NILM-Based Solutions for the Automation of Energy Services in Residential Buildings.
DOI: 10.5220/0012733400003714
Paper published under CC license (CC BY-NC-ND 4.0)
In Proceedings of the 13th International Conference on Smart Cities and Green ICT Systems (SMARTGREENS 2024), pages 85-95
ISBN: 978-989-758-702-3; ISSN: 2184-4968
Proceedings Copyright © 2024 by SCITEPRESS – Science and Technology Publications, Lda.
85

an electrician) and their complexity (electrical panels
not adapted, data communication problems).
The automatic extraction of these data from the
centralized electricity consumption measurement of
the household (electric meter) would allow their use
on a large scale in order to propose to the final cus-
tomer automatic EE services providing, for example,
detailed information on the consumption of families
of appliances or FDD notifications in case of unusual
or faulty behaviours of appliances such as the heat
pump. This is known as Non Intrusive Load Moni-
toring (NILM) (Hart, 1992), in which individual ap-
pliance consumptions are disaggregated from a cen-
tral recording. NILM is a data-driven technique that
could be used in the implementation of both EE and
FDD feedback systems.
The general objective of this paper is the devel-
opment of innovative NILM-based solutions for the
automation of new EE and FDD services via the im-
plementation of robust and yet simple data analysis
and machine learning methods allowing the extraction
of a maximum of information from the centralized
electricity consumption measurement of the house-
hold (electric meter). More precisely, the objective
of this paper is the development of NILM techniques,
later used in the implementation of new EE and FDD
services, based solely on the global load curve to pro-
vide information to residents on:
• The consumption of the heat pump providing en-
ergy for SH and DHW,
• The SH and DHW consumption,
• The consumption of other families of appliances
for a global feedback on the consumption of the
household,
• Unusual or faulty behaviour of the heat pump,
The focus was put on robust detection of the heat
pump and other families of appliances using simple
solutions enabling its future use in real-time remote
EE and FDD feedback systems. The described dis-
aggregation methods, although simple, are valid and
lead to good detection performance, validated by ref-
erence values obtained using dedicated meters. In-
deed, the reported results on 14 households show a
daily average error on the prediction of the heat pump
consumption below 3.5 %. Furthermore, the daily
average error on the prediction of the number of cy-
cles and the operating time of the heat pump are both
around 1%. The development of EE and FDD ser-
vice prototypes allowing to better understand and op-
timize the energy functioning of residential buildings
with potential savings for the residents can be based
on these results.
2 NILM OVERVIEW
First introduced in 1992 (Hart, 1992), Non Intru-
sive Load Monitoring (NILM) refers to the analysis
of variations in the voltage and/or current going in
a household and deducing what appliances are used
as well as their individual energy consumption. In
other words, NILM consists in the load disaggrega-
tion in order to extract itemized information about a
household’s appliances only using the global electric-
ity consumption measurement.
The most common application of NILM is en-
ergy savings in both residential (Kelly and Knotten-
belt, 2016) and industrial sectors (Garc
´
ıa-P
´
erez et al.,
2021). Other applications include smart-grid man-
agement (C¸ imen et al., 2021), load forecasting (We-
likala et al., 2019), fault detection and diagnostics
again in both residential (Aboulian et al., 2019) and
industrial sectors (Rafati et al., 2022). It also in-
cludes human monitoring and assisted living (Her-
nandez et al., 2019), and extraction of consumer be-
haviour (Schirmer and Mporas, 2021).
The NILM approach is a low-cost alternative to
attaching individual meters to each appliance (Intru-
sive Load Monitoring) (Egarter et al., 2015), but be-
ing a data-driven method, it requires high quality con-
sumption measurements in order to provide satisfac-
tory performance.
The complexity of the disaggregation problem is
directly linked to the type of appliances which are
present in the monitored household. Based on their
unique energy consumption signature, electrical ap-
pliances can be grouped into the following four cate-
gories (Zeifman and Roth, 2011):
1. Two State Appliances. These are appliances with
only two operating states: ON and OFF (e.g., re-
sistive loads like lamps).
2. Multiple State Appliances. These are appliances
with a multiple, strictly greater than two but fi-
nite, number of operating states (e.g., washing
machines or stoves).
3. Variable Consumption Appliances. These are
appliances without a fixed number of operating
states, their consumption varies constantly (e.g.,
dimmers).
4. Continuously Consuming Appliances. These
are appliances that remain active at all times (e.g.,
wireless routers).
The sampling frequency of the collected aggregated
consumption data is one of the most important aspects
of NILM since different frequency ranges contain dif-
ferent potentially exploitable signal features. Low
frequencies (0-100Hz) are typically used for features
SMARTGREENS 2024 - 13th International Conference on Smart Cities and Green ICT Systems
86

like active power, reactive power or phase angle. Mid
frequencies (0.1-2kHz) are used for features like low
order harmonics or DC component. High frequencies
(2-20kHz) are used for features like harmonic spec-
trum, rise/fall times or transient energy. (Carrie Armel
et al., 2013).
NILM methods can be split into three main cat-
egories for appliance identification, namely Machine
Learning, Pattern Matching, and Source Separation.
NILM methods based on Machine Learning use fea-
ture extraction methods to train a model using Sup-
port Vector Machines (SVMs) (Li et al., 2021), De-
cision Trees (DTs) (Al–Khadher et al., 2022), Hid-
den Markov Models (HMMs) (Wu et al., 2021), or
K-Nearest Neighbours (KNNs) (Himeur et al., 2021)
algorithms amongst others. NILM methods based on
Pattern Matching rely on the generation of a database
consisting of a set of reference signatures (Schirmer
et al., 2020). The aim of these methods is to find the
best match between an unknown observed signature
and the signatures from the database. With NILM
methods based on Source Separation, the disaggrega-
tion problem is formulated as an optimization prob-
lem (Rahimpour et al., 2017). Constraints like sparse-
ness are used on the optimization algorithm in order to
extract the individual power consumption signatures
of the appliances from the aggregated signal.
The use of public datasets is essential to com-
pare different NILM methods and their performance.
Several public datasets from different countries with
various types and number of appliances, sampling
frequencies, and data collection durations are avail-
able (Kriechbaumer and Jacobsen, 2018; Beckel
et al., 2014; Kolter and Johnson, 2011).
The definition and use of standardized perfor-
mance metrics is also essential in the comparison of
different NILM methods. For classification NILM
algorithms, performance metrics include Accuracy,
False positive and False Negative while for regression
NILM methods, performance metrics include Mean
Absolute Error, Root-Mean-Square Error and Estima-
tion Accuracy.
With accuracy ranging from 60 % to over 96
% (Zhou et al., 2022), the reported performance of
NILM systems strongly vary according to the used
method and mainly to the considered appliances. Un-
surprisingly, performance is also inversely propor-
tional to the number of appliances to be disaggre-
gated. Given the ever growing number of electrical
appliances in modern households, the complexity of
the NILM problem is not likely to decrease in the fu-
ture.
For further and more precise information, several
publications provide thorough reviews of the NILM
technique including recent developments and chal-
lenges (Angelis et al., 2022; Schirmer and Mporas,
2023; Mari et al., 2022; Dash and Sahoo, 2022). In
particular, Rafati recently reviewed the use of NILM
for fault detection and efficiency assessment of heat,
ventilation and air conditioning systems (Rafati et al.,
2022). Their investigation shows that NILM tech-
niques can successfully identify electro-mechanical
and electrical faults in such systems that are difficult
to detect by thermal measurements.
3 EXPERIMENTAL METHOD
3.1 Framework
The EU-funded domOS (Operating System for Smart
Services in Buildings) project (domOS Consortium,
2024) takes a closer look at the smart building sec-
tor by researching two axes. The first is the technol-
ogy and secure connection of smart devices and smart
appliances so that building owners can enforce pri-
vacy rules. The second addresses the development
of smart services that increase efficiency of space
heating. For instance, the project studies how build-
ings can become active nodes of an electricity grid
or a district heating grid. The project’s proposals are
tested on five demonstration sites, one of them is lo-
cated in Sion, Switzerland. This demonstration site
was initially deployed in the framework of the EU-
funded GOFLEX (Generalized Operational FLEXi-
bility for Integrating Renewables in the Distribution
Grid) project (GOFLEX Consortium, 2020) which
aimed to develop a vertical flexibility chain, from
buildings to grid control centres and energy markets.
This demonstration site is currently being upgraded
and extended in the framework of the domOS project.
3.2 Data Collection
Of the 52 households currently equipped with and
running the domOS monitoring and control system,
14 were selected for this study. The selected house-
holds passed both the following selection criteria:
• Relevance. The household features a heating sys-
tem relevant for the study, i.e., a heat pump pro-
viding energy for both SH and DHW. Further-
more, both the centralized electricity consump-
tion and the specific electricity consumption of the
heat pump were collected throughout 2022.
• Data Quality. The household features at least
80 % days with good quality data throughout 2022
(at least 292 days). Is considered a good data day
NILM-Based Solutions for the Automation of Energy Services in Residential Buildings
87

Figure 1: Typical collected data for a winter day. The heat
pump features several SH cycles (around 2 kW) and five
DHW cycles (around 2.3 kW).
any day (midnight to midnight) with at least 80 %
of the expected data points and no windows of
missing data points longer than an hour.
The centralized electricity consumption was collected
every 5 seconds and features the total active power as
well as the total reactive power. This was collected
using a Landis+Gyr E450 residential advanced me-
ter with an accuracy over 99.7 %. The heat pump
electricity consumption was collected every 15 sec-
onds and only features the active power. This was
collected using a Aeotec Home Energy Meter Gen5
with an accuracy over 99 %. This means that for
any day in 2022 to be kept, the centralized electricity
consumption data must contain at least 13’824 data
points for both the active and reactive power and the
heat pump electricity consumption data must contain
at least 4’608 data points. Figure 1 shows the col-
lected data for a typical winter day.
3.3 Data Processing
For each valid day, the collected data were first
cleaned (removal of duplicates, removal of outliers,
etc.) and then downsampled to one data point per
minute. The objective of this downsampling is
twofold, not only it allows synchronisation between
the collected data, but it also reduces the amount of
data being processed without loosing essential infor-
mation. This could become critical for future real-
time remote applications. The resampled data were
finally filtered using a median filter with a kernel size
of 5 in order to remove the high frequency compo-
nents of the signal.
3.4 Heat Pump Extraction
Due to the use of induction motors, most heat pumps
consume large amounts of reactive power in compar-
Figure 2: Estimation of the heat pump cycle power
P
heat pump
. The power consumed by all the other appliances
P
other
during the heat pump cycle is estimated as the aver-
age of P
be f ore
and P
a f ter
. P
other
is then subtracted from the
average power of the given cycle P
cycle
to provide the esti-
mation of P
heat pump
.
ison with other typical household appliances. This
feature is particularly interesting when trying to ex-
tract the heat pump consumption from the centralized
consumption. Indeed, it can be seen in Figure 1 that
large amounts of reactive power, typically well over
1.5 kVAR in this case, correspond almost perfectly to
the operation of the heat pump.
The time-wise extraction of the heat pump con-
sumption was therefore simply based on a household-
specific reactive power threshold. For each times-
tamp, the heat pump is considered in operation if the
value of the global reactive power is above the thresh-
old. For now, the estimation of the household-specific
reactive power threshold is done by manually inspect-
ing the centralized electricity consumption data of the
first available day. This will however be automated in
the future.
The daily number of cycles and operating time of
the heat pump are directly deducted from the time-
wise extraction of the heat pump consumption. To
achieve the full extraction of the heat pump from the
centralized electricity consumption, the system still
needs to estimate the power level of each cycle. This
estimation procedure, detailed below, is illustrated in
Figure 2.
1. The power before the beginning of a heat pump
cycle P
be f ore
is simply estimated as the average
power between the end of the previous cycle of
the heat pump and the beginning of the considered
one. The power after the end of a heat pump cycle
P
a fter
is estimated the same way as the average
power between the end of the considered cycle of
the heat pump and the beginning of the next one.
2. The power consumed by all the other appliances
P
other
during the considered heat pump cycle is
SMARTGREENS 2024 - 13th International Conference on Smart Cities and Green ICT Systems
88

estimated as the average of P
be f ore
and P
a fter
.
3. Finally, P
other
is subtracted from the average
power of the given cycle P
cycle
to provide the esti-
mation of the heat pump power P
heat pump
.
3.5 SH and DHW Separation
Since every heat pump cycle has been assigned a
power level P
heat pump
, it is now possible to classify
them as SH or DHW. This was performed using a two-
class k-means classifier (k=2). Each heat pump cycle
characterised by its P
heat pump
belongs to the cluster
(SH or DHW) with the nearest mean and the clus-
ters means were updated in a pseudo-online system
through every successive day of 2022.
Given a set of cycle powers (P
1
, P
2
, ..., P
n
) and
an initial set of two means m
1
and m
2
for two sets
S
1
and S
2
(SH or DHW), the algorithm proceeds by
alternating between two steps:
• Assignation. Each cycle is assigned to the cluster
with the nearest mean.
S
i
=
n
P
k
: |P
k
− m
i
| ≤ |P
k
− m
j
| i, j = 1, 2
o
• Update. The means are recalculated with the
powers assigned to each cluster.
m
i
=
1
|S
i
|
∑
P
k
∈S
i
P
k
The initial means of the clusters were roughly manu-
ally estimated based on the centralized electricity con-
sumption of the very first days of 2022. For example,
from Figure 1, the SH cluster’s mean would have been
initialized to 2000 (2400-400) and the DHW cluster’s
mean would have been initialized to 2300 (2700-400).
As for the estimation of the household-specific reac-
tive power threshold, this will be automated in the fu-
ture.
3.6 Power Bands Disaggregation
The extraction of the consumption of the heat pump
from the centralized electricity consumption allows
the reconstruction of the heat pump load curve. This
specific load can then be subtracted from the global
load in order to obtain the aggregated load curve of
the other household’s appliances. Based on an opti-
mized and adapted NILM algorithm previously pub-
lished (Ferrez and Roduit, 2014), the consumption of
the remaining non-heating appliances were disaggre-
gated in to the following four power bands:
• Base Load. This is the daily minimum power
level (> 0), it represents the continuously con-
suming appliances.
• Low Power (≤ 250 W). This includes lighting
and some home electronics.
• Medium Power (> 250 W and < 1 kW). This
includes micro-waves, vacuum cleaners and some
home electronics.
• High Power (≥ 1 kW). This include white appli-
ances and cooking appliances.
3.7 Performance Evaluation
While the extraction of the heat pump from the cen-
tralized electricity consumption and the disaggrega-
tion of the remaining load was performed exclusively
using the collected global active and reactive power,
a specific measure of the heat pump consumption is
also available. This specific measure was exclusively
used for performance evaluation purposes. Indeed,
the a priori daily heat pump consumption, daily num-
ber of cycles and daily total operating time can easily
be extracted from this specific measure and compared
to the results obtained using the centralized electric-
ity consumption. Three different performance metrics
were used, namely the Relative Error (RE), the Mean
Absolute Error (MAE) and the Root Mean Square Er-
ror (RMSE).
4 RESULTS
The centralized electricity consumption of 14 house-
holds was collected throughout 2022 and daily dis-
aggregated into six categories. This section first pro-
vides detailed results about one of these households
before showing global results about the 14 house-
holds.
4.1 Single Household
Daily disaggregation results for one of the 14 house-
holds are presented in this first subsection. Fig-
ure 3 shows the daily disaggregation throughout 2022
into six categories, namely, base load, low power,
medium power, high power, DHW and SH. Both the
base load and the low power are relatively stable at
roughly 5 kWh (equivalent to a constant power of
200 W). Both the medium and high power are small
but roughly constant over the year. The DHW is
roughly at 5 kWh in the winter, but plummets to 1
to 2 kWh in the summer. Finally, the SH is nil be-
tween May and September, but reaches 20 to 25 kWh
in January and December. These results are conform
to expectations.
NILM-Based Solutions for the Automation of Energy Services in Residential Buildings
89
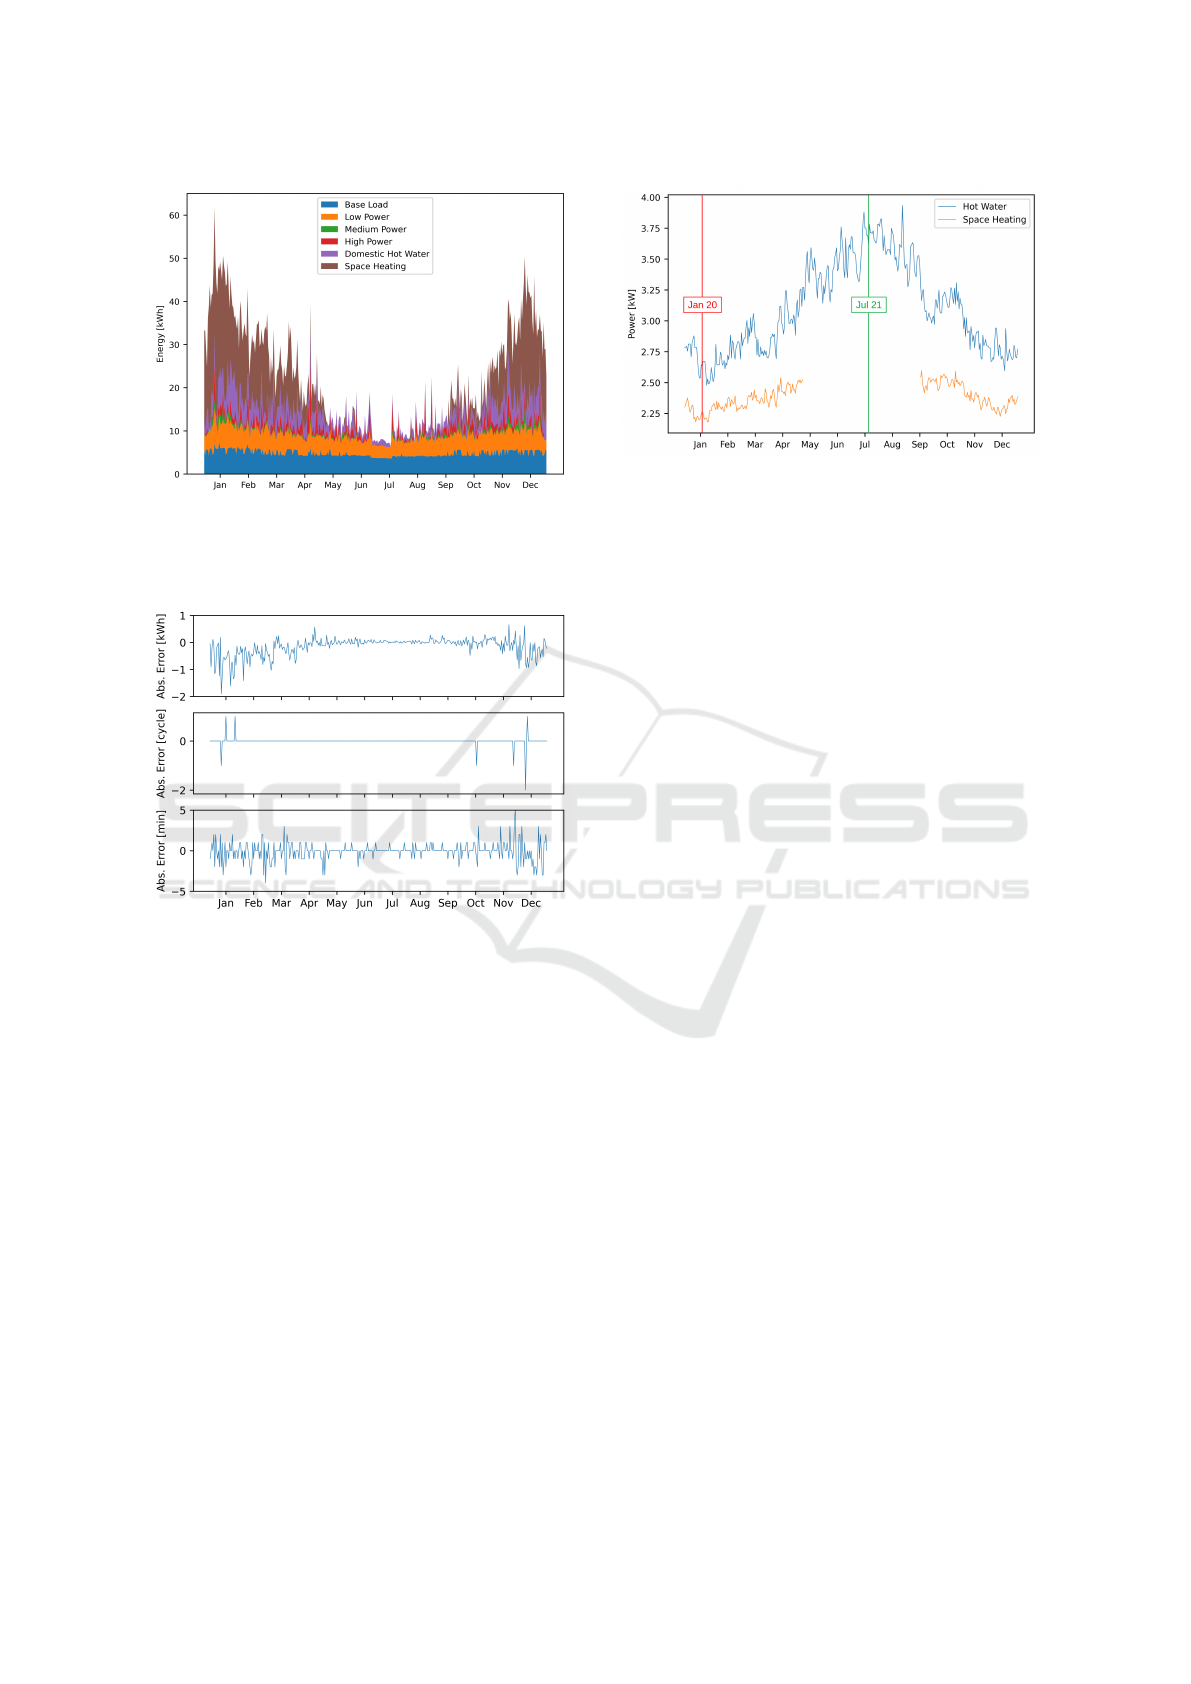
Figure 3: Daily disaggregation results for a single house-
hold throughout 2022. The centralized consumption is split
into six categories: base load, low power, medium power,
high power, HDW and SH.
Figure 4: Daily absolute energy error (top), daily absolute
cycle error (center), daily absolute operating time error (bot-
tom) for a single household throughout 2022. A positive
error means overestimation whereas a negative error means
underestimation.
Figure 4 shows the daily absolute error of the pre-
diction of the energy (top), the number of cycles (cen-
ter), and the operating time (bottom) of the heat pump.
A positive error means overestimation whereas a neg-
ative error means underestimation. Overall, the en-
ergy daily absolute error is under 2 kWh and there’s a
tendency to underestimate the energy in winter. These
absolute errors correspond to daily relative errors un-
der 10 %. With regard to cycles, there were only five
false negatives and three false positive, whereas with
regard to operating time, the absolute error is under
three minutes for most days, corresponding to relative
errors under 5 % for most days.
In a slightly different register, Figure 5 shows the
evolution of the daily predicted heat pump power for
both SH and DHW. Far from being constant, the SH
power ranges from about 2.2 to 2.6 kW with an in-
Figure 5: Daily heat pump power for both SH and DHW for
a single household. Far from being constant, the SH power
ranges from about 2.2 to 2.6 kW whereas the DHW power
ranges from about 2.5 to 3.9 kW. There was no detected SH
between May and September.
terruption between May and September, whereas the
DHW power ranges from about 2.5 to 3.9 kW. Fig-
ure 6 shows the collected data and the results of the
disaggregation for 20 January 2022 (vertical red line
on Figure 5). This figure shows that all the rather
narrow strictly SH heat pump cycles with an average
power of about 2.4 kW were successfully detected. It
also shows two hybrid cycles with an average power
of about 2.7 kW and mainly contributing to DHW be-
ing detected as such. The nature of the used classifier
forces every heat pump cycle to be either classified
as SH or DHW. Therefore, hybrid cycles are a source
of error in the estimation of both the SH and DHW
consumption. This will be addresses in the future. Fi-
nally, Figure 6 also shows a base load of 250 W and
the band disaggregation of the remaining load.
Similarly, Figure 7 shows the collected data and
the results of the disaggregation for 21 July 2022 (ver-
tical green line on Figure 5). As expected, there are no
SH cycles, but simply two DHW cycles with a signifi-
cantly higher average operating power, about 3.6 kW.
This figure also shows a base load of about 180 W and
the band disaggregation of the remaining load.
4.2 All Households
This second subsection provides detailed information
about the performance of the detection of the heat
pump as well as the overall consumption for the 14
households. Table 1 shows RE, MAE and RMSE for
the energy, number of cycles and operating time of the
heat pump for the 14 households in 2022. Absolute
values of the daily errors were used in order to avoid
compensation between positive (overestimation) and
negative (underestimation) errors. The average daily
energy RE is below 5 % for all but one household
whereas both the average daily cycles RE and the the
SMARTGREENS 2024 - 13th International Conference on Smart Cities and Green ICT Systems
90
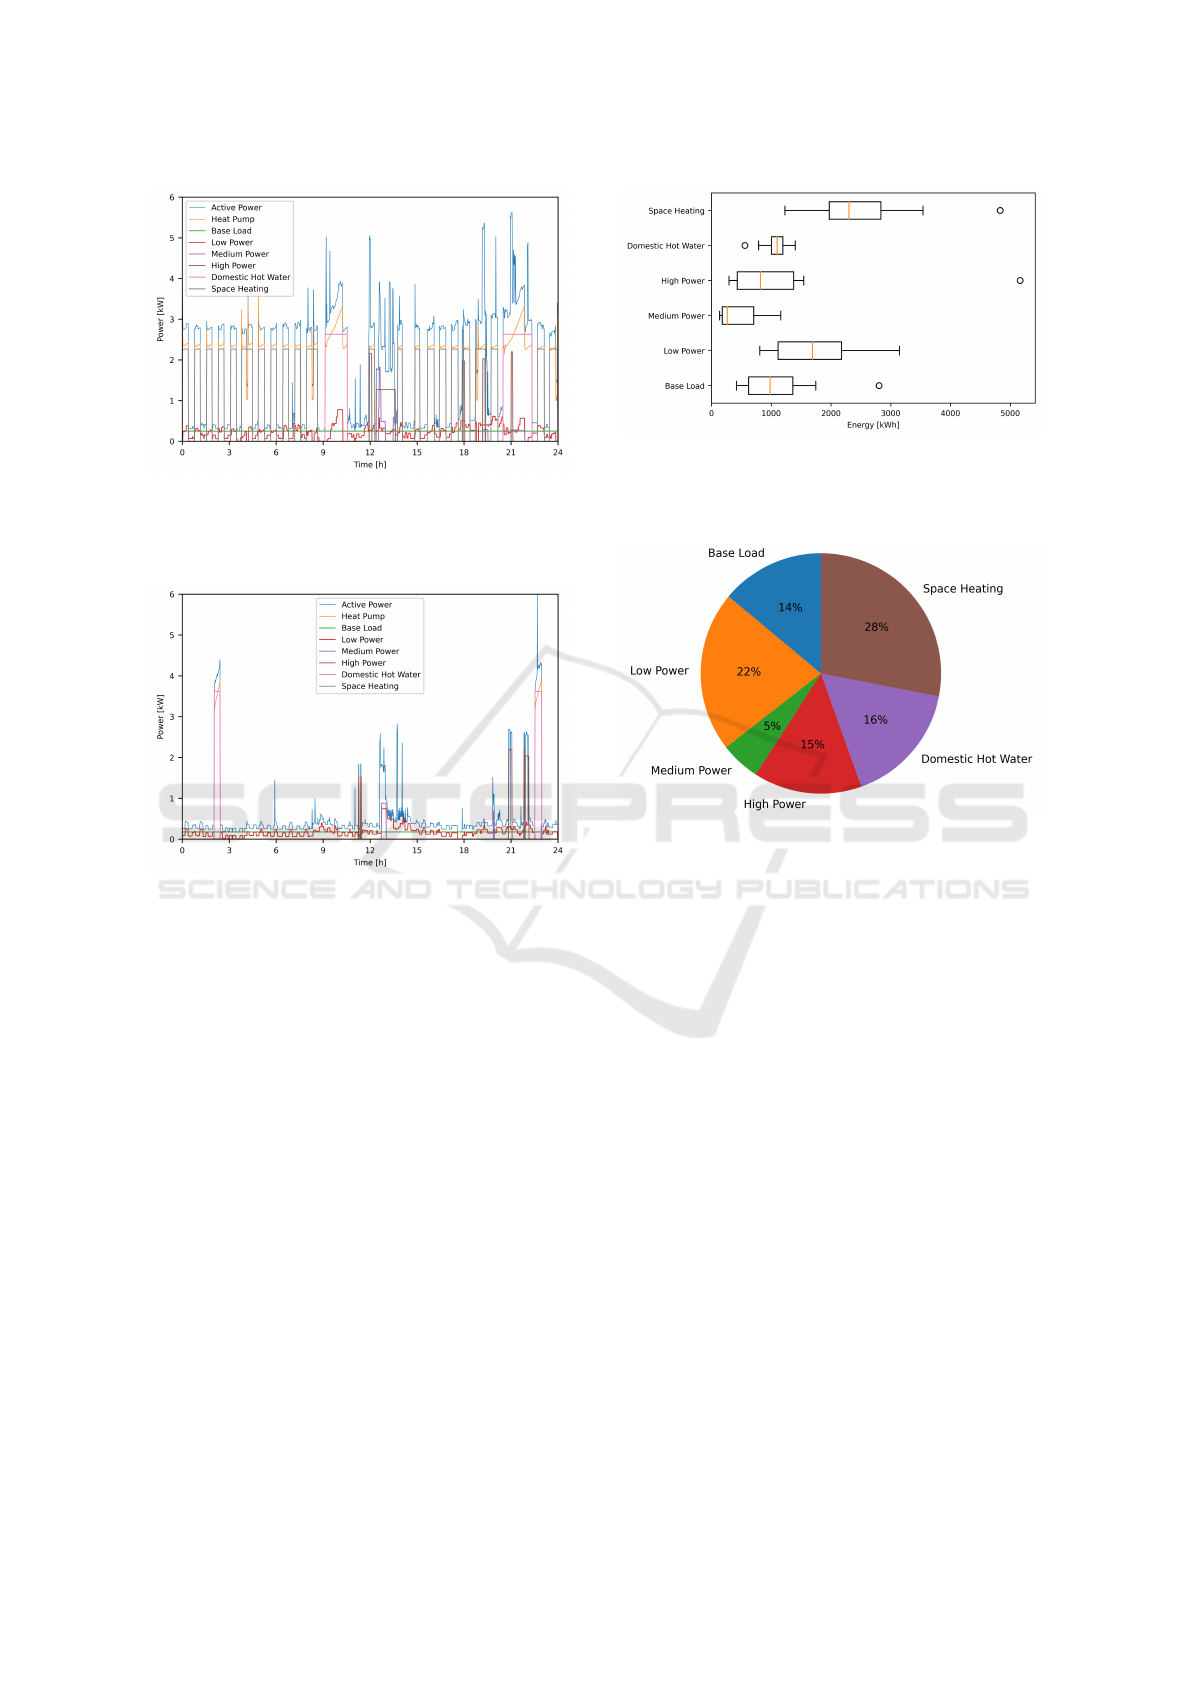
Figure 6: Collected data and disaggregation results for 20
January 2022. All strictly SH cycles (about 2.4 kW) were
successfully detected and two hybrid cycles (about 2.7 kW)
mainly contributing to DHW were detected as such.
Figure 7: Collected data and disaggregation results for 21
July 2022. There was no SH cycles and two successfully
detected DHW cycles (about 3.6 kW).
average daily operating time RE are below 2 % for all
but two households.
The box plots in Figure 8 show the overall disag-
gregation results of the 14 households in 2022 through
their quartiles. The horizontal whiskers indicate vari-
ability outside the lower and upper quartiles and cir-
cles show outliers. The low power appliances and the
SH are the two main contributors to the electricity bill
and both show a large variance. The consumption of
the other four categories is relatively low with a low
to moderate variance.
The pie chart in Figure 9 shows the distribution
of the overall detected consumed energy by the 14
households in 2022. The average total consumption is
8’050 kWh and the heat pump (SH and DHW) is re-
sponsible for 44 % of this consumption (3’585 kWh).
The base load and the low power appliances, cate-
gories with a high potential of consumption reduc-
tion, represent together over a third of the consump-
tion (1’120 and 1’740 kWh, respectively).
Finally, the lowest total consumption was
Figure 8: Overall disaggregation results for the 14 house-
holds for 2022. The horizontal whiskers indicate variability
outside the lower and upper quartiles and circles show out-
liers.
Figure 9: Distribution of the overall detected consumed en-
ergy by the 14 households in 2022. The average total con-
sumption is 8’050 kWh.
4’700 kWh, which is less than 60 % of the av-
erage whereas the highest total consumption was
15’940 kWh, almost twice the average consumption.
These variations reflect large differences of consump-
tion behaviours.
5 DISCUSSION
5.1 Algorithm Performance
The general error rates presented in Table 1 as well
as the daily error rates presented in Figure 4 are very
encouraging. Despite the fact that the described de-
tection algorithms are relatively simple, they lead to
good detection performance, not only for the con-
sumed energy, but also for the number of cycles and
the operating time of the heat pump for all 14 house-
holds.
Indeed, with an overall average energy RE below
3.5 %, an overall average cycles RE below 1 % and an
overall average operating time RE just above 1%, the
described heat pump detection method match the per-
NILM-Based Solutions for the Automation of Energy Services in Residential Buildings
91
Table 1: RE, MAE and RMSE for the energy, number of cycles and operating time of the heat pump for the 14 households
for 2022. RE is expressed in % and both MAE and RMSE are expressed in kWh, cycles and minutes, respectively.
House
Heat Pump Energy Heat Pump Cycles Heat Pump Op. Time
C MAE RMSE RE MAE RMSE RE MAE RMSE
H01 3.18 0.21 0.31 0.07 0.02 0.17 0.68 1.69 4.54
H02 5.56 0.44 0.73 0.03 0.01 0.08 1.81 0.96 1.88
H03 4.80 0.42 0.52 0.00 0.00 0.00 0.23 0.6 1.17
H04 3.38 0.39 0.55 0.84 0.01 0.16 0.23 0.45 1.53
H05 2.88 0.19 0.34 0.72 0.10 0.37 1.5 5.49 11.45
H06 2.69 0.23 0.34 0.02 0.00 0.06 0.79 1.04 2.06
H07 2.25 0.22 0.34 0.03 0.00 0.05 0.33 0.54 0.91
H08 3.56 0.28 0.39 2.15 0.10 0.36 1.03 1.56 3.38
H09 2.02 0.28 0.60 1.25 0.27 0.69 1.99 7.26 12.51
H10 3.83 0.22 0.34 0.78 0.11 0.36 0.41 0.39 0.86
H11 4.81 0.52 1.05 3.48 0.34 0.79 2.21 4.42 9.76
H12 2.51 0.24 0.35 0.00 0.00 0.00 0.43 0.8 1.41
H13 2.23 0.22 0.37 0.00 0.00 0.00 0.44 0.66 1.11
H14 4.36 0.21 0.30 1.47 0.06 0.25 2.59 1.26 1.85
Average 3.43 0.29 0.47 0.77 0.07 0.24 1.05 1.94 3.89
formance of state-of-the-art methods and could there-
fore be used not only for energy efficiency services,
but also for fault detection and efficiency assessment
of heating system. Indeed, by tracking deviations in
the daily energy consumption and the daily number
of cycles of the heat pump, keeping in mind the natu-
ral seasonal variations, it should be possible to detect
malfunctions.
Thanks to high quality data collection and down-
sampling to one data point per minute, the time-wise
extraction of the heat pump is performing extremely
well as shown by the cycle and operating time er-
ror rates. The rare errors of the time-wise extraction
based simply on a reactive power threshold can be
due to other appliances consuming large mounts of
reactive power. This time-wise detection could be en-
hanced by adding rules regarding what is and is not
a heat pump cycle (e.g., duration, power, number ac-
cording to the season). These rules could be learnt and
updated in a similar way to the SH and DHW power
levels.
As for the error on the predicted energy consumed
by the heat pump, it is the most challenging part of the
detection. Indeed, “guessing” the power level of the
heat pump from the aggregated power is a complex
task. Both data collection systems show accuracies
above 99 % and can therefore only explain part of the
errors. The power estimation of the heat pump cy-
cles could be enhanced ba a better estimation of the
subtracted power of the other appliances or by a more
complex model of the evolution of the power during a
cycle. Indeed, the relatively simple model presented
in this study assumes a constant power during a cycle
whereas power tends to increase during a cycle.
Since only the specific consumption of the heat
pump was collected using dedicated meters, it is im-
possible to precisely assess the performance of the
disaggregation of the other household’s appliances.
However, this power band disaggregation was per-
formed using an optimized and adapted NILM algo-
rithm previously published [reference blinded] and it
was applied and verified on the whole set of 14 house-
holds. The daily disaggregation results shown in Fig-
ure 3 and the reconstruction of the specific load curves
corresponding to the four power bands shown in Fig-
ure 6 and Figure 7 confirm it’s validity for a particular
house.
The objective of this study was not the develop-
ment of new complex NILM algorithms outperform-
ing the best previously published techniques. The
general objective of this study was the robust detec-
tion of the heat pump and other families of appliances
using simple solutions enabling its future use in real-
time remote EE and FDD feedback systems. The er-
ror rates presented for the 14 households in Table 1
show that although the detection method is not per-
fect, it is robust. Furthermore, the main advantage of
this technique is its simplicity and its low computa-
tional requirements. Indeed, it only requires a limited
number of household specific parameters easily esti-
mated with a couple of days of data, namely the level
of reactive power corresponding to the heat pump op-
eration and the initial means of the clusters of the two-
class k-means classifier. Furthermore, the whole daily
detection can be performed on a standard office com-
puter within a few seconds. This is a key issue for a
SMARTGREENS 2024 - 13th International Conference on Smart Cities and Green ICT Systems
92

future application in real-time remote feedback sys-
tems.
Finally, to enhance the evaluation of the heat
pump detection technique as well as that of the power
band disaggregation, it would be useful to extend the
analysis to more households, with a broader variety of
heat pumps and other electrical appliances. It would
also be useful to assess the performance of the pro-
posed technique on publicly available datasets featur-
ing households with a heat pump providing energy for
both SH and DHW for a more accurate comparison
with other state-of-the-art methods.
5.2 Overall Consumption
Figure 8 show the overall disaggregation results of the
14 households for 2022 through their quartiles and
Figure 9 presents the distribution of the groups of
appliances (power bands) according to their average
electricity consumption.
Unsurprisingly, the main contributor is SH with
28 %. Maybe more so, the second largest contribu-
tor with 22 % is the low power appliances (below 250
W) mainly including lighting and home electronics.
Adding the 14% of the base load, we reach almost
two third of the overall consumption and these three
categories show a rather large variance, as shown in
Figure 8). These three categories include a large vari-
ety of appliances, but more importantly, the behaviour
of the residents has a strong impact on their impor-
tance. Therefore, these categories have a high poten-
tial for energy savings. Indeed, with a feedback with
the residents in the framework of energy efficiency
services, it should be possible to point out which ap-
pliances contribute to the base load in order to reduce
their impact on the energy bill. Similarly, although
the electricity consumption due to home electronics
is ever growing, its impact can be reduced or at least
controlled by behavioural adaptation (e.g., turn off the
TV when nobody is watching it).
With 16 % of the overall consumption, the DHW
is the third largest, just above both the base load and
the high power appliances. More interestingly, it has a
very small variance suggesting that the consumption
of hot water was very similar for the 14 considered
households.
5.3 Energy Feedback Prototype
From the centralized electricity consumption mea-
surement of the household, the described disaggre-
gation methods allowed the reconstruction of the
specific load curve of six categories of appliances,
namely base load, low power, medium power, high
power, SH and DHW. With these specific load curves,
it is possible to estimate the energy consumed by any
of these categories for any time window. This is par-
ticularly useful to provide residents with direct feed-
back on their energy consumption, or provide them
with a comparison between days or relatively to ref-
erence values (EE services). Beyond the estimation of
the different consumed energies, the described disag-
gregation methods also allowed the accurate estima-
tion of the number of cycles and operating time of the
heat pump for any time window. This could be the
base of FDD services by tracking the number of cy-
cles of the heat pump, their duration and power over
time and therefore detect anomalies. A screenshot of
a very first prototype of a webpage providing energy
consumption feedback is presented in Figure 10. The
top chart shows the energy consumption of the six cat-
egories for a specific household over a year. The bot-
tom chart shows the six disaggregated load curves for
25 and 26 October 2022 for the same household.
6 CONCLUSION
The general objective of this study was the robust de-
tection of the heat pump and other families of appli-
ances using simple solutions enabling its future use in
real-time remote EE and FDD feedback systems. The
presented NILM technique is simple and yet robust
enough to be used in the implementation of such ser-
vices in order to optimize the energy efficiency of res-
idential buildings with potential savings for the resi-
dents. Indeed, with an overall average energy RE be-
low 3.5 %, an overall average cycles RE below 1 %
and an overall average operating time RE just above
1%, the described heat pump detection method is per-
forming well.
It is nevertheless not perfect and can probably be
enhanced without jeopardizing its usability in real-
time remote systems. As mentioned before, the time-
wise detection of the heat pump based on a reactive
power threshold could be enhanced by adding rules
regarding what is and is not a heat pump cycle (e.g.,
duration, power, number according to the season).
The prediction of the energy consumed by the heat
pump could also be enhanced by a more accurate es-
timation of the power consumed by the other appli-
ances during a heat pump cycle and by a more real-
istic power evolution model during a heat pump cy-
cle. Furthermore, the reactive power threshold and
both the initial means of the clusters of the two-class
k-means classifier are so far estimated manually but
this should be automated relatively easily. Finally,
the challenge of hybrid heat pump cycles (providing
NILM-Based Solutions for the Automation of Energy Services in Residential Buildings
93
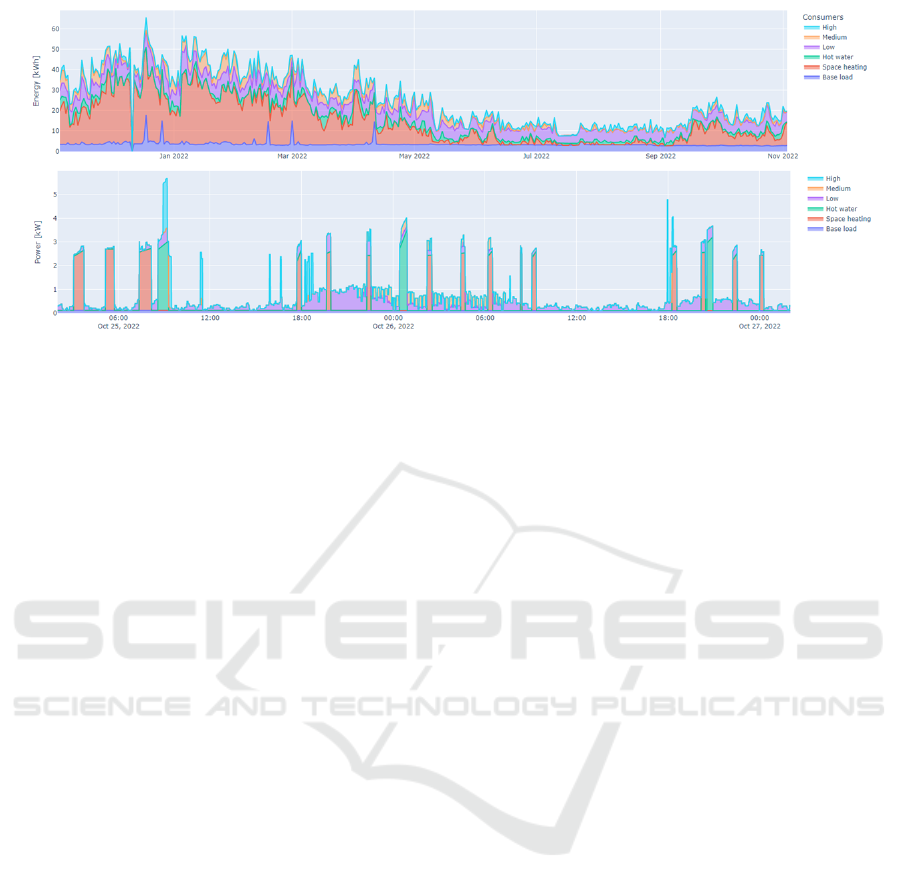
Figure 10: First prototype of the energy feedback webpage. The top chart shows the energy consumption of the six categories
for a specific household over a year. The bottom chart shows the six disaggregated load curves for 25 and 26 October 2022
for the same household.
energy to both SH and DHW) has to be addressed
and the described technique should be tested on more
households on a longer time frame, as well as on
publicly available datasets featuring relevant house-
holds, to better assess its validity and robustness in the
long run and in comparison with other state-of-the-art
methods.
ACKNOWLEDGEMENTS
This work was supported by the Engineering and Ar-
chitecture Faculty and the Institue of Sustainable En-
ergy of HES-SO University of Applied Sciences and
Arts Western Switzerland as well as by the domOS
project funded under the European Union’s Horizon
2020 Programme (GA 894240).
REFERENCES
Aboulian, A., Green, D. H., Switzer, J. F., Kane, T. J.,
Bredariol, G. V., Lindahl, P., Donnal, J. S., and Leeb,
S. B. (2019). NILM Dashboard: A Power System
Monitor for Electromechanical Equipment Diagnos-
tics. IEEE Transactions on Industrial Informatics,
15(3):1405–1414.
Al–Khadher, O., Mukhtaruddin, A., Hashim, F. R., Az-
izan, M. M., Mamat, H., and Saleh, N. (2022). Non-
intrusive load monitoring based on bagging decision
trees and the selective features for commercial build-
ing loads. In 2022 IEEE International Conference on
Power and Energy (PECon), pages 293–298.
Angelis, G.-F., Timplalexis, C., Krinidis, S., Ioannidis, D.,
and Tzovaras, D. (2022). NILM applications: Liter-
ature review of learning approaches, recent develop-
ments and challenges. Energy and Buildings, 261.
Bang, M., Engelsgaard, S. S., Alexandersen, E. K., Skydt,
M. R., Shaker, H. R., and Jradi, M. (2019). Novel real-
time model-based fault detection method for auto-
matic identification of abnormal energy performance
in building ventilation units. Energy and Buildings,
183:238–251.
Beckel, C., Kleiminger, W., Cicchetti, R., Staake, T., and
Santini, S. (2014). The ECO Data Set and the Per-
formance of Non-Intrusive Load Monitoring Algo-
rithms. In BuildSys 2014 - Proceedings of the 1st
ACM Conference on Embedded Systems for Energy-
Efficient Buildings.
Carrie Armel, K., Gupta, A., Shrimali, G., and Albert, A.
(2013). Is disaggregation the holy grail of energy
efficiency? The case of electricity. Energy Policy,
52:213–234.
Dash, S. and Sahoo, N. (2022). Electric energy disaggre-
gation via non-intrusive load monitoring: A state-of-
the-art systematic review. Electric Power Systems Re-
search, 213:108673.
domOS Consortium (2024). Operating System for Smart
Services in Buildings.
Egarter, D., Bhuvana, V. P., and Elmenreich, W. (2015).
PALDi: Online Load Disaggregation via Particle Fil-
tering. IEEE Transactions on Instrumentation and
Measurement, 64(2):467–477.
Federal Office for the Environment (2023). Greenhouse gas
emissions from buildings.
Ferrez, P. and Roduit, P. (2014). Non-Intrusive Appliance
Load Curve Disaggregation for Service Development.
In 2014 IEEE International Energy Conference (EN-
ERGYCON), pages 813–820.
Garc
´
ıa-P
´
erez, D., P
´
erez-L
´
opez, D., D
´
ıaz-Blanco, I.,
Gonz
´
alez-Mu
˜
niz, A., Dom
´
ınguez-Gonz
´
alez, M., and
Cuadrado Vega, A. A. (2021). Fully-Convolutional
Denoising Auto-Encoders for NILM in Large Non-
Residential Buildings. IEEE Transactions on Smart
Grid, 12(3):2722–2731.
GOFLEX Consortium (2020). Generalized Operational
SMARTGREENS 2024 - 13th International Conference on Smart Cities and Green ICT Systems
94

FLEXibility for Integrating Renewables in the Distri-
bution Grid.
Hart, G. (1992). Nonintrusive appliance load monitoring.
Proceedings of the IEEE, 80(12):1870–1891.
Hernandez, A., Ruano, A., Urena, J., Ruano, M., and Gar-
cia, J. (2019). Applications of NILM Techniques
to Energy Management and Assisted Living. IFAC-
PapersOnLine, 52(11):164–171.
Himeur, Y., Alsalemi, A., Bensaali, F., and Amira, A.
(2021). Smart non-intrusive appliance identification
using a novel local power histogramming descriptor
with an improved k-nearest neighbors classifier. Sus-
tainable Cities and Society, 67:102764.
Kelly, J. and Knottenbelt, W. (2016). Does disaggregated
electricity feedback reduce domestic electricity con-
sumption? A systematic review of the literature. In
3rd International NILM Workshop.
Kim, W. and Katipamula, S. (2018). A review of fault
detection and diagnostics methods for building sys-
tems. Science and Technology for the Built Environ-
ment, 24(1):3–21.
Kolter, J. and Johnson, M. (2011). REDD: A Public Data
Set for Energy Disaggregation Research. Artificial In-
telligence, 25.
Kriechbaumer, T. and Jacobsen, H.-A. (2018). BLOND,
a building-level office environment dataset of typical
electrical appliances. Scientific Data, 5.
Li, Y., Yang, Y., Sima, K., Li, B., Sun, T., and Li, X.
(2021). Non-intrusive load monitoring based on har-
monic characteristics. Procedia Computer Science,
183:776–782.
Mari, S., Bucci, G., Ciancetta, F., Fiorucci, E., and Fiora-
vanti, A. (2022). A Review of Non-Intrusive Load
Monitoring Applications in Industrial and Residential
Contexts. Energies, 15(23).
Rafati, A., Shaker, H. R., and Ghahghahzadeh, S. (2022).
Fault Detection and Efficiency Assessment for HVAC
Systems Using Non-Intrusive Load Monitoring: A
Review. Energies, 15(1).
Rahimpour, A., Qi, H., Fugate, D., and Kuruganti, T.
(2017). Non-Intrusive Energy Disaggregation Us-
ing Non-Negative Matrix Factorization With Sum-to-
k Constraint. IEEE Transactions on Power Systems,
32(6):4430–4441.
Rashid, H. and Singh, P. (2018). Monitor: An Abnormality
Detection Approach in Buildings Energy Consump-
tion. In 2018 IEEE 4th International Conference on
Collaboration and Internet Computing (CIC), pages
16–25.
Schirmer, P. and Mporas, I. (2021). On the non-intrusive
extraction of residents’ privacy- and security-sensitive
information from energy smart meters. Neural Com-
puting and Applications, 35:1–14.
Schirmer, P., Mporas, I., and Paraskevas, M. (2020). Energy
Disaggregation Using Elastic Matching Algorithms.
Entropy, 22.
Schirmer, P. A. and Mporas, I. (2023). Non-Intrusive Load
Monitoring: A Review. IEEE Transactions on Smart
Grid, 14(1):769–784.
Swiss Federal Office of Energy (2023). Buildings.
Welikala, S., Dinesh, C., Ekanayake, M. P. B., Godaliyadda,
R. I., and Ekanayake, J. (2019). Incorporating Ap-
pliance Usage Patterns for Non-Intrusive Load Mon-
itoring and Load Forecasting. IEEE Transactions on
Smart Grid, 10(1):448–461.
Wu, Z., Wang, C., Peng, W., Liu, W., and Zhang, H. (2021).
Non-intrusive load monitoring using factorial hidden
markov model based on adaptive density peak cluster-
ing. Energy and Buildings, 244:111025.
Zeifman, M. and Roth, K. (2011). Nonintrusive appliance
load monitoring: Review and outlook. IEEE Transac-
tions on Consumer Electronics, 57(1):76–84.
Zhou, Y., Li, F., Liu, L., Wang, T., Cheng, Z., Li, R., and
Gao, J. (2022). Non-intrusive load monitoring method
based on the time-segmented state probability. Energy
Reports, 8:1418–1423.
C¸ imen, H., C¸ etinkaya, N., Vasquez, J. C., and Guerrero,
J. M. (2021). A Microgrid Energy Management Sys-
tem Based on Non-Intrusive Load Monitoring via
Multitask Learning. IEEE Transactions on Smart
Grid, 12(2):977–987.
NILM-Based Solutions for the Automation of Energy Services in Residential Buildings
95
