
A Learning Analytics Dashboard for Improved Learning Outcomes and
Diversity in Programming Classes
Iris Groher
1 a
, Michael Vierhauser
2 b
and Erik Hartl
1
1
Johannes Kepler University Linz, Institute of Business Informatics, Software Engineering, Linz, Austria
2
University of Innsbruck, Department of Computer Science, Innsbruck, Austria
Keywords:
Learning Objectives, Assurance of Learning, Learning Analytics, Dashboard, Diversity.
Abstract:
The increased emphasis on competency management and learning objectives in higher education has led to
a rise in Learning Analytics (LA) applications. These tools play a vital role in measuring and optimizing
learning outcomes by analyzing and interpreting student-related data. LA tools furthermore provide course
instructors with insights on how to refine teaching methods and material and address diversity in student
performance to tailor instruction to individual needs. This tool demonstration paper introduces our Learning
Analytics Dashboard, designed for an introductory Python programming course. With a focus on gender
diversity, the dashboard analyzes graded Jupyter Notebooks, to provide insights into student performance
across assignments and exams. An initial assessment of the dashboard, applying it to our Python programming
course in the previous year, has provided us with interesting insights and information on how to further improve
our class and teaching materials. We present the dashboard’s design, features, and outcomes while outlining
our plans for its future development and enhancement.
1 INTRODUCTION
In recent years, the systematic management of
competencies and learning objectives has gained
widespread popularity, particularly in higher educa-
tion (Malhotra et al., 2023; Bergsmann et al., 2015).
In this context, Learning Analytics (LA) has become
a major endeavor and a means to track and analyze
learning outcomes and achievement of competencies.
LA is primarily concerned with the measurement, col-
lection, analysis, and interpretation of data related
to students and their learning in order to understand
and ultimately optimize learning outcomes (Scheffel
et al., 2014).
The importance of applications that support teach-
ing and learning has increased significantly in re-
cent years, due in no small part to the COVID-19
pandemic. Through the use of technologies such as
online platforms, virtual learning environments, and
learning management systems (LMS), huge amounts
of data are generated, which creates opportunities for
measuring the learning success of students and when
necessary, positively influencing learning outcomes
a
https://orcid.org/0000-0003-0905-6791
b
https://orcid.org/0000-0003-2672-9230
through targeted intervention (Vieira et al., 2018).
Making use of LA can support both students and
educators in many different ways. For students, it
can help to personalize the learning path and enhance
their learning experience. Students can further use LA
to monitor their own progress and the individual feed-
back gained can help them understand their strengths
and weaknesses and make improvements. Educators
can use LA to improve the quality of their courses
and refine their teaching methods, course materials,
and support services. They can identify difficulties of
their students and potential drop-outs, measure course
engagement and assessment performance, and mea-
sure learning objectives to ensure that their courses
meet the required standards. LA can further play a
crucial role in supporting diversity in higher educa-
tion by helping educators identify, understand, and
address disparities in student performance, engage-
ment, and outcomes.
As a step towards LA in Programming Education,
and to foster diversity analysis, we have created a
Learning Analytics Dashboard for our introductory
Python programming course. The dashboard takes
graded Jupyter Notebooks (Johnson, 2020) from as-
signments or exams as an input, and provides statis-
tical analyses and visualization of assignments and
618
Groher, I., Vierhauser, M. and Hartl, E.
A Learning Analytics Dashboard for Improved Learning Outcomes and Diversity in Programming Classes.
DOI: 10.5220/0012735000003693
Paper published under CC license (CC BY-NC-ND 4.0)
In Proceedings of the 16th International Conference on Computer Supported Education (CSEDU 2024) - Volume 2, pages 618-625
ISBN: 978-989-758-697-2; ISSN: 2184-5026
Proceedings Copyright © 2024 by SCITEPRESS – Science and Technology Publications, Lda.

their individual exercises or tasks. Furthermore, we
have put specific emphasis on the gender diversity
aspect, allowing us to drill down into submissions
and gain valuable insights into how well certain tasks
were performed by different groups of students. Our
main goal was, for us as educators and course in-
structors, to gain insight into the challenges and dif-
ficulties our students have with the different topics
covered in our Python course. As we were facing a
gender gap, with respect to course performance and
drop-outs in the previous semesters, which has also
been frequently reported as a major issue (Marquardt
et al., 2023; Rubio et al., 2015; Groher et al., 2022)
in computer science classes, we wanted to find out if,
where, and to what extent, female students might face
increased difficulties in our course.
In this tool demonstration paper, we present our
initial version of the dashboard, its application in our
programming course, and the insights and findings we
gained when using the LA capabilities of the dash-
board. We also report on the current and future plans
to further expand the capabilities of the dashboard.
The remainder of this paper is structured as fol-
lows. In Section 2 we provide a brief introduction
to the topic of LA in programming education and re-
lated tools and provide a brief introduction to our in-
troductory Python programming course and the main
requirements that stem from this course, guiding the
initial development of our dashboard. In Section 3
we then present the dashboard and its features, with
a concrete application use case in Section 4. Finally,
in Section 5 we discuss enhancements, additional fea-
tures we are planning on adding as part of our ongoing
work, and conclusions.
2 BACKGROUND AND COURSE
SETTING
In this section, we present the background and tools
related to our work, and a brief overview of our in-
troductory programming course, and requirements for
our LA dashboard derived from our experiences.
2.1 Learning Analytics in Programming
Education
Learning analytics has already successfully been ap-
plied in programming education. L
´
opez-Pernas and
Saqr (L
´
opez-Pernas and Saqr, 2021) combine data
from different sources, such as learning manage-
ment systems and programming assessment tools
to identify learning patterns among students. The
programming learning platform Artemis integrates
competency-based learning to generate personal-
ized learning paths for individual students (S
¨
olch
et al., 2023). Other work analyzes IDE usage pat-
terns of students to get insights into their skills
and performance (Ardimento et al., 2019). Uta-
machant et al. (Utamachant et al., 2023) assess stu-
dent engagement levels and identify at-risk students
through learning activity gaps. In general, LA has
been a growing issue in recent years with active re-
search and a slew of tools on the commercial market.
Moreover, established LMSs have integrated capabil-
ities into their platforms. For example, Moodle, as
an open-source platform, provides analytics capabil-
ities via a plug-in extension (Moodle, 2023). Moo-
dle Analytics provides several different models (static
and ML-based) that allow generating statistics about,
for example, drop-out risks, activities that are due to
submission, and further predictive models. In this
context, Mwalumbwe et al. (Mwalumbwe and Mtebe,
2017) conducted a study with the intent to develop an
LA tool and analyze data from Moodle LM systems.
Focusing on students as a target user group, Peraic
and Grubisic (Perai
´
c and Grubi
ˇ
si
´
c, 2022) have pre-
sented a “Learning Analytics Dashboard for students”
(LAD-s), providing visualization for student success
and engagement and further providing predictive an-
alytics capabilities.
Woodclap (Woodclap, 2023) is another platform,
that focuses on virtual classrooms facilitating com-
munication with students on smartphones, messages,
and real-time interaction while monitoring student en-
gagements and providing feedback on teaching tech-
niques. Moreno-Medina et al. (Moreno-Medina et al.,
2023) used this setting with chemical engineering stu-
dents in combination with gamification strategies to
assess and improve student participation and moti-
vation. Krusche and Berrezueta-Guzman (Krusche
and Berrezueta-Guzman, 2023) provide an interactive
learning environment for programming classes foster-
ing iterative performance enhancement by real-time
feedback mechanisms. However, the platform does
not integrate support for diversity analysis and is lim-
ited to task-level analysis.
While existing systems offer valuable functionali-
ties for course management and related analysis, they
lack specific support for assignment-level and task-
level analysis of programming courses. Also, support
for diversity analysis is often limited. This motivated
us to develop a customized dashboard for our setting.
A Learning Analytics Dashboard for Improved Learning Outcomes and Diversity in Programming Classes
619

2.2 Course Setting
We started our introductory Python programming
course in 2021, as part of a new university-wide digi-
talization initiative, where all study programs (includ-
ing non-technical/CS-related ones) should gain some
familiarity with programming and algorithmic think-
ing. As part of this, we took over the programming
education for business students, particularly, business
administration and economics.
With a total of 6 ECTS, the course is split into
a weekly, slide-based lecture with additional live-
coding sessions, and a corresponding weekly exer-
cise where students should apply the concepts from
the previous lecture by solving examples during class
and as part of their homework. Pair programming
is applied during the exercise and by this students
should work together on programming tasks covering
the topic of the lecture. Additionally, homework as-
signments consisting of 5-6 individual tasks are dis-
tributed that have to be completed and submitted by
the students within one week. Tutors manually cor-
rect the assignments, give feedback, and assign points
to the tasks of the assignments. Students are graded
based on the points they receive for the weekly as-
signments and an exam at the end of the semester.
The main challenge, in this case, was that, com-
pared to a computer science study program, where
one can expect a certain level of technical (and mathe-
matical) background, the students participating in our
courses are quite diverse, with different educational
backgrounds and prior knowledge related to program-
ming. For most students, our course was the first
time they have written code and/or executed a pro-
gram written by themselves.
For this purpose, we opted for Python as a pro-
gramming language, instead of Java – which is the
standard language for programming education in CS
courses, in conjunction with Jupyter Notebooks. The
weekly assignments are distributed as Jupyter Note-
books and the students submit their solutions as note-
books in Moodle. The final exam at the end of the
semester is conducted with the CodeRunner (Lobb,
Richard and Hunt, Tim, 2023) plugin in Moodle.
2.3 Stakeholders & Requirements
In higher education, effective utilization of LA plays
an important role in ensuring effective curriculum
management and enhancing student outcomes. This
is especially important for lecturers, and course in-
structors who engage directly with the course content
and the students. While the initial design of our plat-
form primarily targets the needs of these educators,
there’s also a foresight to expand the platform’s capa-
bilities to incorporate the needs of students and pro-
gram managers in the future. For now, we defined the
following requirements for our dashboard:
R1. Course Management. A fundamental re-
quirement revolves around the management of
courses. This includes functionalities to set
course settings, such as determining the start
and end dates, entering the number of assign-
ments, defining requirements such as the num-
ber of submissions and points for passing the
course, and setting the number of students en-
rolled in the course.
R2. Document Management. The dashboard
should allow for the seamless upload of graded
Jupyter Notebooks, adhering to a defined JSON
format.
R3. Analytical Insight into Assignments. To track
course progress and ensure equitable assess-
ment, there’s a need to provide analytics about
the number of submissions per assignment over
the semester.
R4. Student Data Management. This encompasses
the ability to manage pertinent student data, in-
cluding their names, IDs, gender, and details
about their enrolled study program.
R5. Descriptive Statistics on Performance. For an
in-depth analysis of student performance, edu-
cators require a distribution of points per assign-
ment over the semester for all students. Addi-
tionally, a separate analysis filtered by gender,
visualized using box plots to depict the variabil-
ity and central tendency is needed. For each as-
signment a detailed breakdown into the number
of submissions, average points for the collective
student body, and an analysis separated by gen-
der is necessary. An average effort metric fur-
ther illuminates the student’s engagement levels.
A similar granularity of insights is required for
each task and exam.
R6. Individual Student Analytics. For personal-
ized feedback and support, each student’s pro-
file should be enriched with their performance
metrics, including points per assignment, aver-
age points, pass status, number of submissions,
and other relevant details.
R7. Export Capability. Recognizing the diverse
uses of such data, there should be a provision for
exporting student-specific data for further anal-
ysis or reporting purposes.
CSEDU 2024 - 16th International Conference on Computer Supported Education
620
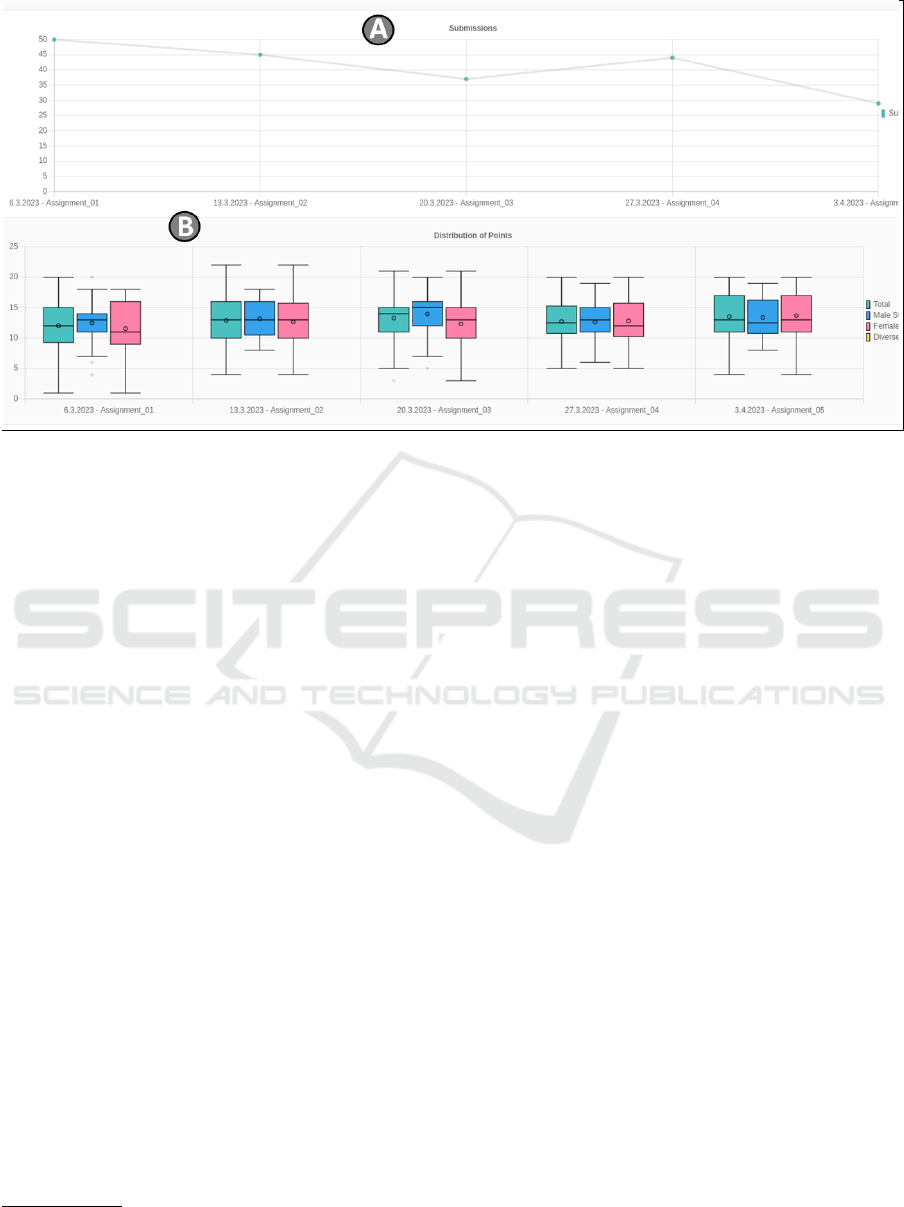
Figure 1: Learning Analytics Dashboard: Assignment-level analysis view.
3 ANALYSIS DASHBOARD
In this section, we present details of our Learning An-
alytics Dashboard by first providing an overview of its
main features from this first iteration prototype and
then providing a brief overview of the technical de-
tails of the implementation. A short demonstration
video of the main Dashboard features
1
is available on-
line.
3.1 Features
The requirements of our initial implementation were
driven by the need to gain insights into students’ abil-
ity to successfully solve assignments, the submission
rates of individual assignments and constituent tasks,
and identifying potential gender gaps (cf. R3, R5),
hence largely by our own requirements. In the fol-
lowing, we provide a brief overview of the function-
ality and show examples in the dashboard (cf. Fig. 1
and Fig. 2 )
• General Analysis and Trends of Assignments. In
our previous programming classes, we have often ex-
perienced drop-outs in the middle of the semester or
even towards the end of the course. Therefore, one of
our main requirements was to get a better overview
of individual assignments (handed out on a weekly
basis), and whether there was a steady number of
handed-in assignments (and successfully completed
1
https://github.com/TeachingAndLearningSciences/res
ources
tasks within the assignment) or a noticeable decline in
submissions over time. Fig. 1 provides an overview of
the main view of the dashboard. The top part [A] pro-
vides information about the raw submission numbers
for each assignment and allows us to easily identify
if submission numbers are declining for a particular
assignment, or steadily over time. Additionally, the
lower [B] part provides an overview of the results for
each assignment, i.e. the points achieved by students,
and the spectrum (Box Plot) of the results. This helps
us to identify exercises that might be particularly dif-
ficult (where students have received fewer points) or
potential effects of different educational backgrounds
(where we have a broad spectrum of points achieved).
• Detailed Analysis on Assignment and Task Level.
While analysis on the assignment level can provide
some valuable insights into the overall course, it does
not provide sufficient details on how students handle
individual assignments and the topics and ultimately
learning objectives associated with these assignments
(and the constituent tasks). The second analysis level
(cf. Fig. 2), therefore, is concerned with drilling down
into individual assignments and tasks part of the as-
signment (cf. R6). The top part [C] in this case pro-
vides again an overview of submission numbers and
results, whereas the bottom part [D] goes into further
detail for each of the tasks. For each task, we get de-
tailed insights into how well the students performed,
in terms of the points achieved. The ”point-per-point”
visualization (Grouped Bar Charts) provides detailed
insights on the distribution of points for individual
tasks and allows us to identify tasks that might be po-
A Learning Analytics Dashboard for Improved Learning Outcomes and Diversity in Programming Classes
621
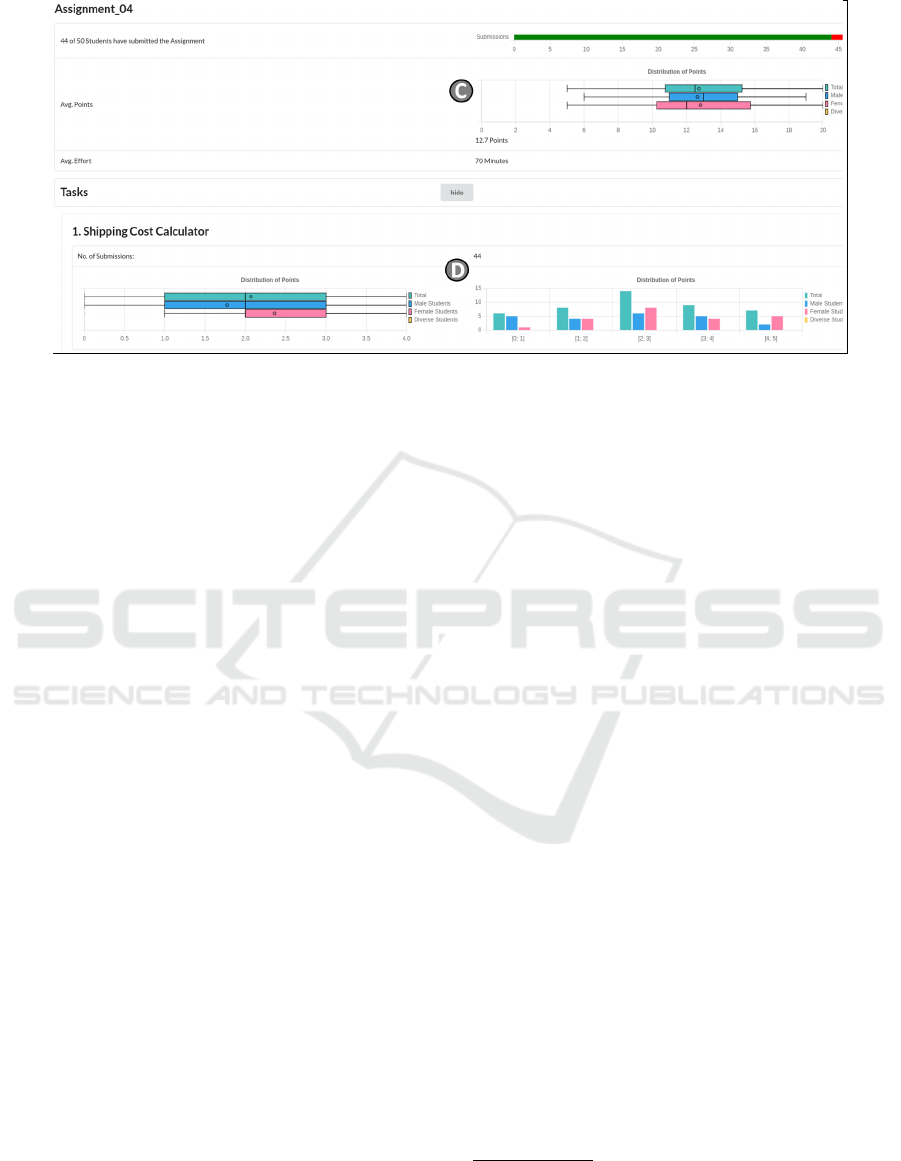
Figure 2: Learning Analytics Dashboard: Task-level analysis view.
tentially too difficult or complex.
• Gender Analysis. A cross-cutting concern for all
analysis activities is the aspect of gender. Based on
our previous, multi-year, experience of offering basic
programming classes for various different study pro-
grams, we have observed gender gaps in several of our
courses. Research in this area has shown that precau-
tionary measures and actions can (at least partially)
rectify such issues, for example, by providing ap-
propriate teaching material and assignments (Schmitz
and Nikoleyczik, 2009; Spieler and Slany, 2018).
• Automated Analysis. One of our key requirements
was to facilitate automated analysis of graded note-
books, while retaining manual grading of assignments
performed manually by tutors. Tutors do not only
grade assignments and tasks, but provide individual
feedback about how well a problem was solved, and
give hints and samples when a task could not be com-
pleted. With weekly assignments, the workload for
tutors is already quite high and we did not want to bur-
den them with additional requirements (e.g., entering
results in yet another tool – i.e. our dashboard). In-
stead, we opted for an automated parser, that reads out
assignment/task points (which are entered in a struc-
tured manner) and stores them as JSON information
in the meta-data of the notebook (cf. R2). This in-
formation is then used for subsequent analysis in the
dashboard. As a positive side-effect, this also decou-
ples the dashboard from the specific structure/format
of the assignments and allows for updated/changed
Jupyter notebooks in the future, as long as the grading
information is provided in the predefined JSON for-
mat. This further contributes to the aspect of general-
izability of the dashboard with potential applications
to other (types) of programming classes (cf. further
discussion in Section 5).
• Other Capabilities. Besides the main analysis
capabilities, additional functionality is related to the
ability to define courses with respective course set-
tings (e.g., the number of students part of the course,
grading schemes, and number of assignments) (cf.
R1). Additionally, as establishing interfaces to exist-
ing university systems where student data is stored,
is typically challenging, we added the ability to store
basic student information (e.g., names, gender, study
program), to ensure data privacy, stored only locally
on university premises (cf. R4). In conjunction with
this, we also added the ability to export results (cf.
R7) in a standard CSV format, to enable grading in-
formation to be fed back to the existing university
grading system.
3.2 Implementation
To facilitate easy access and availability to a broad
range of users, we decided to implement our Learn-
ing Analytics Dashboard as a web application using
JavaScript. The components of the dashboard are
structured in a 3-tier architecture, presentation, logic,
and data layer with central data storage. For this pur-
pose, we use a PostgreSQL database where informa-
tion in courses, and results extracted from the Jupyter
notebooks are stored. As the dashboard uses sensi-
ble data concerning students and learning outcomes,
we refrained from using cloud services, but deployed
our application as containers using Docker
2
. The core
implementation, presentation, and logic use Node.js
3
,
Next.js
4
, and React
5
.
2
https://www.docker.com
3
https://nodejs.org/en
4
https://nextjs.org
5
https://react.dev
CSEDU 2024 - 16th International Conference on Computer Supported Education
622
4 APPLICATION EXAMPLE &
DISCUSSION
As an initial assessment of the usefulness of our
Learning Analytics Dashboard application, we used
it to analyze one iteration of our Python course in the
summer semester of 2022. In this section, we present
the insights and findings and further discuss its limi-
tations and potential threats that need to be taken into
account.
4.1 Analyzed Python Course
As part of this initial validation, we used the
dashboard to analyze students’ performance in 10
homework programming assignments throughout the
course. The assignments covered a range of topics
from variables and data types, to advanced modules
like NumPy and Pandas, as well as object orientation.
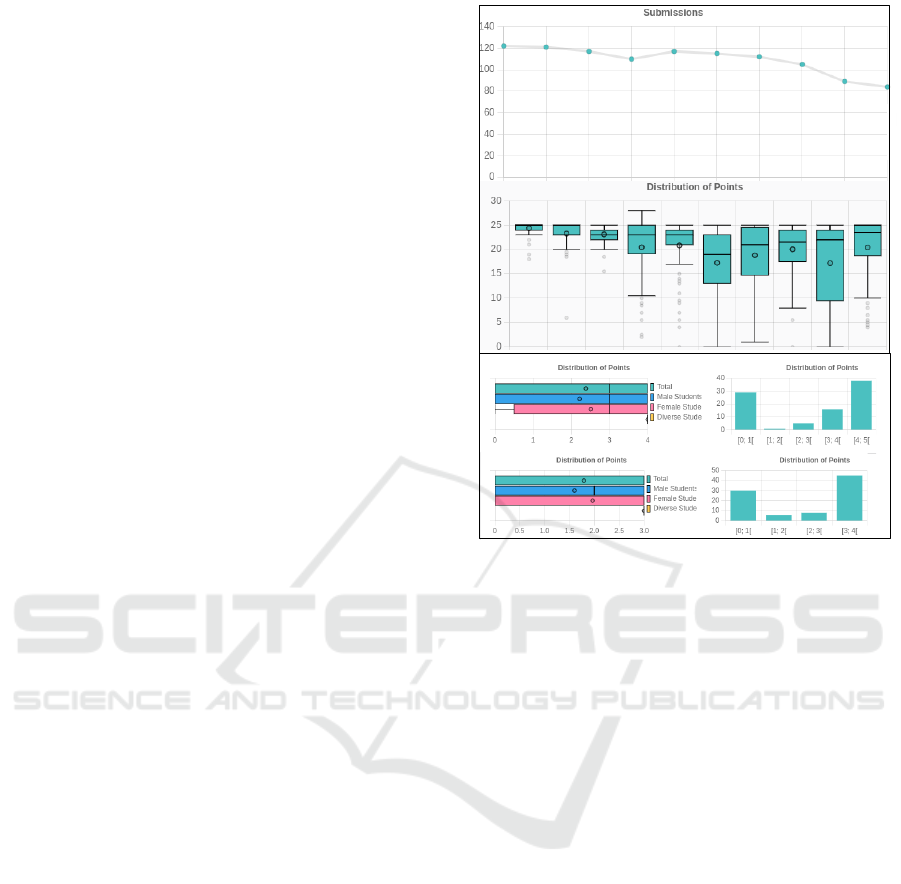
Fig. 3 (top) shows the number of submissions for
each assignment and the distribution of points re-
ceived for all students. The bottom part shows the
detailed results for two tasks part of Assignment 9.
The analysis of the assignments with the help of our
dashboard revealed several key insights.
• Submission Trends. While there was a slight de-
crease in the number of submissions for Assignments
9 and 10, we did not observe a significant drop-out.
The lower numbers for Assignments 9 and 10 can be
attributed to the fact that only 8 out of 10 submissions
were mandatory.
• Assignment Metrics. For the first three assign-
ments, covering basic concepts, data types, and sim-
ple programs, we observed a high average score and
little spread, However, further into the semester and
with increasing complexity, from Assignment 4 on-
ward, we observed a lower average score and a higher
spread in points.
• Assignment Drill-Down. The ability to further an-
alyze constituent tasks of an assignment also revealed
some interesting insights, particularly for assignments
where we already observed a significant spread in
points. Particularly, for Assignment 9, which covered
the topic of modules including Math, NumPy, Mat-
plotlib, and Pandas, we observed the largest variabil-
ity in scores. Notably, one-third of the students scored
less than 1 out of 3 points in the pandas task, whereas
half of the students reached the maximum score of 3
(cf. Fig. 3 – bottom part). For Assignment 10, which
focused on object orientations, the median score in-
creased, indicating better understanding compared to
the previous assignment.
• Gender Gap. Throughout the semester and across
all assignments, in contrast to our initial assumptions,
Matplotlib
Pandas
Figure 3: Results from our analysis – Trends in Assignment
Submission/Points (top) and detailed results for tasks (Pan-
das and Matplotlib) in the modules assignment (bottom).
no significant gender-based performance gap was de-
tected. We explicitly designed this course in an inclu-
sive way based on our previous findings in an intro-
ductory Java course. Further analysis of exam results
and time spent on homework assignments, however,
are required to further confirm the gender equality in
our Python course.
4.2 Implications and Limitations
Using the visualization capabilities of the dashboard
we were able to identify issues during the semester
pertaining to assignments and the topics covered in
the class. Parts of these findings were later – at the
end of the semester – also confirmed through a ques-
tionnaire we sent out to students, where we specif-
ically asked for issues/challenges they experienced,
and improvements for the class. Assignment 9, cov-
ering different modules like Pandas and Matplotlib,
seemed to be particularly difficult for the students in
our course. We, therefore, developed additional ma-
terial and planned an extra lesson in the following
semester. Also, the rule that students only need to
submit 8 out of 10 exercises leads to the fact that
many students drop the last two exercises (covering
modules and object orientation). As a result, we plan
A Learning Analytics Dashboard for Improved Learning Outcomes and Diversity in Programming Classes
623

to change this rule in future semesters especially the
topic of modules is needed in courses of subsequent
semesters.
• Limitations. This preliminary validation does not
capture other potential factors affecting student per-
formance, such as attendance, participation in tuto-
rials, or specific educational backgrounds hence, we
can only draw limited conclusions about the learning
outcomes of the course. However, the primary pur-
pose was to assess the usefulness of our dashboard
and the initial set of visualizations and statistical anal-
yses that are provided. Furthermore, we so far only
covered one semester, but after initial positive results,
our future plans to extend and apply the dashboard to
subsequent iterations and other programming classes
(cf. Section 5) will provide us with additional data and
relevant stakeholders for our tool.
4.3 Discussion
While our analytics dashboard offers many possibil-
ities for enhancing Python programming education,
it also raises several concerns that require attention.
One of the most important issues regarding the im-
plementation of our Learning Analytics Dashboard is
the concern for student privacy. The dashboard col-
lects and analyzes various types of data, including as-
signment points, task points, and gender information.
While this data is important for educational insights,
it also raises questions about the confidentiality and
anonymity of student information. Ensuring that the
data is securely stored and accessed only by autho-
rized personnel is vital. Additionally, the dashboard
must comply with relevant data protection regulations
to ensure student privacy.
Ethical considerations extend beyond data pri-
vacy. The gender analysis feature, for instance, could
inadvertently preserve stereotypes or biases if not
carefully designed and interpreted. There is also the
ethical question of how the data should be used. For
example, should low performance of students trigger
an automatic alert to educational staff, or should the
data only serve as an analytical tool for course im-
provement? Balancing data utility and ethical consid-
erations is crucial in this case.
The risk of data misinterpretation is inherent in
any analytics tool. In the educational context, incor-
rect interpretation of the dashboard’s data could lead
to misplaced educational interventions. For exam-
ple, a gender-based performance gap in assignment
points might be wrongly attributed to pedagogical is-
sues when external factors could be influencing the
data. Therefore, it is essential to provide adequate
training for lecturers and program managers who will
be interpreting the dashboard’s data. Contextualizing
the data with qualitative insights is also recommended
to avoid simplistic or misleading conclusions.
Future work should focus on addressing these is-
sues through a combination of technical safeguards,
policies, and user education to ensure that the dash-
board serves as an effective, ethical, and secure edu-
cational tool.
5 CONCLUSION AND FUTURE
WORK
The rapid development of LA in higher education em-
phasizes the need for systematic management of com-
petencies and learning objectives. In this tool demon-
stration paper, we introduced an innovative Learning
Analytics Dashboard specifically designed for an in-
troductory Python programming course. This dash-
board not only aims to assist educators in pedagogi-
cal decisions but also focuses on the critical area of
gender diversity within the course setting.
Our initial application which we used for our own
analysis, provided a series of valuable insights into
student performance and engagement, pointing out
specific challenges regarding the topics of modules
in Python. We could not detect a significant gender
gap and drop-out rates in our course. These insights,
even with our initial prototype, already demonstrated
the power of LA as not just a reactive tool for un-
derstanding student performance, but as a proactive
mechanism that allows for targeted interventions to
enhance educational equality.
Future work will expand on these initial successes.
We plan to enhance the dashboard’s capabilities to
include more diversified analytics features, poten-
tially adding support for analyzing different educa-
tional backgrounds. We further plan to add support
for competency management and the establishment
of links between competencies and assignment and
exam tasks and to analyze competency coverage of
the tasks and competency achievements of students
in the course. We are currently also working on sup-
port to increase the degree of automation. This in-
cludes a dedicated grading-support plug-in in Visual-
Studio for tutors, that generates the JSON data and
automatically uploads notebooks to the dashboard
when graded. Furthermore, we plan on going beyond
Jupyter notebook-based Python courses, and support
for analysis capabilities over multiple semesters. The
current version of our dashboard focuses on educa-
tors as our primary stakeholders. In the future, we
will also provide views for students to monitor their
progress in the course.
CSEDU 2024 - 16th International Conference on Computer Supported Education
624

REFERENCES
Ardimento, P., Bernardi, M. L., Cimitile, M., and Ruvo,
G. D. (2019). Learning analytics to improve coding
abilities: a fuzzy-based process mining approach. In
Proc. of the 2019 IEEE International Conference on
Fuzzy Systems, pages 1–7. IEEE.
Bergsmann, E., Schultes, M.-T., Winter, P., Schober, B.,
and Spiel, C. (2015). Evaluation of competence-based
teaching in higher education: From theory to practice.
Evaluation and Program Planning, 52:1–9.
Groher, I., Vierhauser, M., Sabitzer, B., Kuka, L., Hofer, A.,
and Muster, D. (2022). Exploring diversity in intro-
ductory programming classes: an experience report.
In Proc. of the ACM/IEEE 44th International Confer-
ence on Software Engineering: Software Engineering
Education and Training, pages 102–112. IEEE.
Johnson, J. W. (2020). Benefits and pitfalls of jupyter
notebooks in the classroom. In Proc. of the 21st an-
nual Conference on Information Technology Educa-
tion, pages 32–37. ACM.
Krusche, S. and Berrezueta-Guzman, J. (2023). Introduc-
tion to programming using interactive learning. In
Proc. of the 2023 IEEE 35th International Confer-
ence on Software Engineering Education and Train-
ing, pages 178–182. IEEE.
Lobb, Richard and Hunt, Tim (2023). Moodle CodeRun-
ner. https://moodle.org/plugins/qtype coderunner.
[Online; Accessed 01-10-2023].
L
´
opez-Pernas, S. and Saqr, M. (2021). Bringing synchrony
and clarity to complex multi-channel data: A learn-
ing analytics study in programming education. IEEE
Access, 9:166531–166541.
Malhotra, R., Massoudi, M., and Jindal, R. (2023). Shift-
ing from traditional engineering education towards
competency-based approach: The most recommended
approach-review. Education and Information Tech-
nologies, 28(7):9081–9111.
Marquardt, K., Wagner, I., and Happe, L. (2023). Engag-
ing girls in computer science: Do single-gender inter-
disciplinary classes help? In 2023 IEEE/ACM 45th
International Conference on Software Engineering:
Software Engineering Education and Training (ICSE-
SEET), pages 128–140. IEEE.
Moodle (2023). Moodle Analytics. https://docs.moodle.or
g/402/en/Analytics. [Online; Accessed 01-10-2023].
Moreno-Medina, I., Pe
˜
nas-Garz
´
on, M., Belver, C., and
Bedia, J. (2023). Wooclap for improving student
achievement and motivation in the chemical engi-
neering degree. Education for Chemical Engineers,
45:11–18.
Mwalumbwe, I. and Mtebe, J. S. (2017). Using learning
analytics to predict students’ performance in moodle
learning management system: A case of mbeya uni-
versity of science and technology. The Electronic
Journal of Information Systems in Developing Coun-
tries, 79(1):1–13.
Perai
´
c, I. and Grubi
ˇ
si
´
c, A. (2022). Development and eval-
uation of a learning analytics dashboard for moodle
learning management system. In Proc. of the 2022
HCI International Conference - Late Breaking Pa-
pers. Interaction in New Media, Learning and Games,
pages 390–408, Cham. Springer Nature Switzerland.
Rubio, M. A., Romero-Zaliz, R., Ma
˜
noso, C., and
de Madrid, A. P. (2015). Closing the gender gap in
an introductory programming course. Computers &
Education, 82:409–420.
Scheffel, M., Drachsler, H., Stoyanov, S., and Specht, M.
(2014). Quality indicators for learning analytics. Jour-
nal of Educational Technology & Society, 17(4):117–
132.
Schmitz, S. and Nikoleyczik, K. (2009). Transdisciplinary
and gender-sensitive teaching: didactical concepts and
technical support. International Journal of Innovation
in Education, 1.
Spieler, B. and Slany, W. (2018). Female teenagers and
coding: Create gender sensitive and creative learning
environments. In Constructionism 2018: Construc-
tionism, Computational Thinking and Educational In-
novation, pages 405–414.
S
¨
olch, M., Aberle, M., and Krusche, S. (2023). Integrat-
ing competency-based education in interactive learn-
ing systems. In Companion Proc. of the 13th Interna-
tional Learning Analytics and Knowledge Conference,
pages 53–56.
Utamachant, P., Anutariya, C., and Pongnumkul, S. (2023).
i-ntervene: applying an evidence-based learning ana-
lytics intervention to support computer programming
instruction. Smart Learning Environments, 10:37.
Vieira, C., Parsons, P., and Byrd, V. (2018). Visual learning
analytics of educational data: A systematic literature
review and research agenda. Computers & Education,
122:119–135.
Woodclap (2023). Woodclap. https://www.wooclap.com/
de/. [Online; Accessed 01-10-2023].
A Learning Analytics Dashboard for Improved Learning Outcomes and Diversity in Programming Classes
625
