
A Proposal for an Educational Well-Being Index (EWI) for
Undergraduate Course Design*
Maria J. Blesa
a
, Amalia Duch
b
, Joaquim Gabarr
´
o
c
and Maria Serna
d
Departament de Ci
`
encies de la Computaci
´
o, Universitat Polit
`
ecnica de Catalunya, BarcelonaTech, Spain
Keywords:
Social Progress Index, Well-Being, Educational Model, Educational Well-Being Index.
Abstract:
Every day it is more common to hear around us about the publication of studies, surveys or statistical results
about the well-being of people, workers, women in a given country. Indeed, as university professors, our work
cannot be independent of the level of well-being of our students. So, in this work, we propose a methodology to
asses the students well-being inside a course implementation by what we call the educational well-being index
(EWI). We start with a survey that gathers those factors that computing courses’ students at our university –of
two different levels and majors– consider most important. Our second step is the evaluation –by a group of
teachers– of the presence of those factors in different educational models of implementation of the courses.
We use principal component analysis to extract, from the student data, the valuations that they expressed
in the survey: the principal component of their own measurements on well-being. We work only with the
coefficients of the first dimension of the principal component. The third step is a (subjective) valuation of the
topics addressed in the survey when considering a particular educational model. Finally, we gather everything
together to obtain a well-being index of an educational model that allows their comparison. Besides the
methodology, we present and analyze the values obtained from our case study.
1 INTRODUCTION
Traditionally, the gross domestic product (GDP) of
a country has been calculated and studied as a mea-
sure of its economic “health” and of its “growth”
rate. Moreover, the economic development of a coun-
try has been an indicator of the “progress” of this
country and it is usually measured by the GDP. The
GDP measures, in money, the goods and services pro-
duced in a year and in order to compare different
countries among them, we usually use the GDP per
capita (Wikipedia, 2024) which has been traditionally
a measure of country’s development.
However, in recent times, this way of measur-
ing the “growth” or “hegemony” of countries and
institutions has been severely criticized. The mea-
sure does not take into account people individually
but just count them collectively, as just another num-
ber. In consequence, the GDP, as a measure of well-
a
https://orcid.org/0000-0001-8246-9926
b
https://orcid.org/0000-0003-4371-1286
c
https://orcid.org/0000-0003-3771-2813
d
https://orcid.org/0000-0001-9729-8648
∗
Supported by MCIN/AEI/10.13039/501100011033
under grant PID2020-112581GB-C21 (MOTION).
being, has been strongly criticized during the last
years (Skidelsky and Skidelsky, 2013) and, for in-
stance, the term growth has been replaced in some
economy schools by postgrowth or degrowth (Jack-
son, 2021; Paulson et al., 2020). In order to avoid
problems with the term growth, the current tenden-
cies replace it by an assessment of progress. Al-
though the study of Welfare economics is not new,
it dates back to the 1920s with Pigou’s famous book
(Pigou, 2013), we can say that it has now become
not only fashionable but mandatory to measure the
well-being in countries and institutions. One of such
measures is the Social Progress Index (SPI), that pro-
vides a better measure to look at if one wants to com-
pare the progress of countries and/or institutions in
terms of their welfare (Social Progress Org, 2024; The
Economist, 2023) .
Universities have not been an exception where dif-
ferent general indicators are calculated as measures of
the success or failure of the university education pro-
cess. For instance, if we are interested in how a uni-
versity is seen in the world, we can look at one of the
many available rankings, as for example the ranking
of the universities (July 2023) (Webometrics, 2023)
(see Table 1).
626
Blesa, M., Duch, A., Gabarró, J. and Serna, M.
A Proposal for an Educational Well-Being Index (EWI) for Undergraduate Course Design.
DOI: 10.5220/0012737500003693
Paper published under CC license (CC BY-NC-ND 4.0)
In Proceedings of the 16th International Conference on Computer Supported Education (CSEDU 2024) - Volume 2, pages 626-633
ISBN: 978-989-758-697-2; ISSN: 2184-5026
Proceedings Copyright © 2024 by SCITEPRESS – Science and Technology Publications, Lda.

Table 1: Rank of some institutions in the European Ranking (Webometrics, 2023).
European rank World rank Institution
115 314 University Duisburg Essen
116 320 University Wurzburg
117 322 Universitat Polit
`
ecnica de Catalunya
118 322 Technion Israel Institute of Technology
118 326 London School of Hygiene & Tropical Med.
The recent COVID pandemic has made clear that
it is necessary to look beyond the classic global in-
dicators –especially as a result of the multiple men-
tal health problems it has generated in society. It is
needed to look closely at the people individually and
in particular pay attention to their well-being. Many
studies of well-being at the university or campus level
have appeared in the last years; see, e.g., (Dodd et al.,
2021; Wang et al., 2022; Kanonire et al., 2022).
At a lower level, the success of a course is usu-
ally measured by general indicators such as the pass
rate although there are discussions on the teaching
methodology that a traditional face-to-face institu-
tion should adopt in the future and we believe that
such evaluations need to take into account a mea-
sure of well-being. In this work, we propose the
Educational well-being index (EWI), inspired in the
SPI (Social Progress Org, 2024), to assess the well-
being of the design of a course at university level. We
exemplify our proposal with a case study made on a
relatively small sample of students and several educa-
tional models.
To do so, we prepared a well-being question-
naire formed by 20 well-being related questions to
be ranked between 1 and 5. We poll the students
of two different courses at the Universitat Polit
`
ecnica
de Catalunya (UPC): Programming I (first year Math
studies) taught at the Facultat de Matem
`
atiques
(FME) and Algorithms (third year CS studies) at the
Facultat d’Inform
`
atica de Barcelona (FIB)to deter-
mine the elements that conform –according to them–
their well-being at university courses. We perform a
Principal component analysis (PCA) on the gathered
data to extract the first principal component (as it is
done to compute the SPI) which provides a quantifi-
cation of the value of each question.
Aside, we consider the three dimensions of teach-
ing that we believe have impact on well-being: lec-
turing, transportation, and school models. The first
dimension considers four different models to teach
the above-mentioned courses from totally in person
to as much online as possible in our university. Let
us observe that we focus on a university that offers
only synchronous education, meaning that in class
hours students and lecturers coincide either on-line
or in person. The transportation dimension consid-
ers the type of mobility needed to reach the university
campus, for example, cheap/expensive or long/short.
The school dimension takes into account the organi-
zational model which has particular trends in different
schools. Each combination of one model from each
dimension provides a description of a potential edu-
cational model.
For each educational model, we evaluate the
amount of the well-being components that conforms
it by grading –following our own opinion– the ques-
tions relative to the model in the survey. Finally, we
use the results of the PCA to provide a comparable
rank value. We name this value as EWI as an equiv-
alent of the SPI for courses. We study the trends and
components of our proposed index analyzing the ten-
dencies and singularities of our case study.
The paper is organized as follows: in Section 2 we
give the required preliminaries on SPI. In Section 3
we present the design of the student’s poll. Then, in
Section 4, we present the different course implemen-
tation models and our evaluation of them with respect
to the well-being elements. In Section 5, we provide
the EWI ranking of the course implementations, ac-
cording to our data, and analyze the tendencies by
component. Finally, we provide some conclusions
and lines of future work in Section 6.
2 WELL-BEING: THE SOCIAL
PROGRESS INDEX
The social progress index (SPI) is informally defined
in (Social Progress Org, 2024) as
The capacity of a society to meet the basic hu-
man needs of its citizens, establish the build-
ing blocks that allow citizens and communi-
ties to enhance and sustain the quality of their
lives, and create the conditions for all individ-
uals to reach their full potential.
The SPI considers only non-economic aspects of the
countries. The indicators (a total of 60) are organized
in three dimensions: 1) Basic Human Needs, 2) Foun-
dations of Well-being, and 3) Opportunities. Each
dimension contains four components. Our interest is
in the second dimension, that considers the following
components:
• Access to Basic Knowledge
A Proposal for an Educational Well-Being Index (EWI) for Undergraduate Course Design
627

Table 2: Countries and rankings; four indicators: (1) Social Progress Index (SPI) in 2022; (2) Gross Domestic Product (GDP)
according to FMI 2013; (3) CO
2
emissions in 2021; and (4) Most highly ranked university in the country in 2023.
Country SPI Rank GDP (k$) Rank CO
2
t per cap. University Rank
Sweden 89.42 6 58.014 7 3.82 Lund Universtiy 123
Germany 88.72 8 44.999 18 8.06 TU M
¨
unchen 86
UK 86.13 19 39.372 23 4.95 Oxford University 4
France 86.04 20 44.099 20 4.58 Sorbonne University 227
Spain 85.35 21 29.150 27 4.99 Universitat de Barcelona 108
Italy 85.23 22 34.715 26 5.41 Universit
`
a di Bologna 105
Greece 82.44 33 21.857 35 4.82 Patras University 571
Canada 88.17 10 52.037 10 14.86 Toronto University 16
USA 84.65 25 53.001 9 14.24 Harvard University 1
Israel 83.17 31 36.926 25 6.74 Tel Aviv University 115
Chile 80.78 36 15.776 45 4.61 Universidad de Chile 300
Argentina 78.64 41 14.709 50 4.12 Universidad de Buenos Aires 382
Mexico 70.84 66 10.650 64 3.09 Universidad Nacional Aut
´
onoma 108
• Accent to Information & Communication
• Health & Wellness
• Environmental Quality
It seems that, at least in developed countries wealth
and well-being are strongly correlated but not always
coincide as we can see in the SPI. Concerning En-
vironmental Quality, the main interest is on climate
change due to CO
2
emissions which is, as for today,
an unavoidable problem (Nordhaus, 2013).
In order to quantify some specific trends on the
different approaches, in Table 2, we give the SPI,
GDP, CO
2
emissions and the best University rank for
some countries. The different values of the parame-
ters show an up-and-down across countries and num-
bers. Some countries demonstrate strengths in certain
topics while displaying weaknesses in others.
For instance, if we compare Spain and EEUU,
we can observe that Harvard is the best world and
EEUU university, while the best Spanish university,
Barcelona U., is ranked 26. The GDP per capita in
EEUU (53k$) is much larger than in Spain (29k$).
However, in some aspects, Spain seems to be bet-
ter than EEUU; Spain is slightly better ranked in SPI
than EEUU. The difference becomes greather when
we look at CO
2
, 4.99t in Spain and 14.24t EEUU.
We could summarize (perhaps simplifying too much)
saying that people in EEUU are more rich and have
better universities than in Spain, but people in Spain
have a better well-being and pollute less.
3 QUESTIONNAIRE DESIGN
The first thing that we did was to identify which of
the topics listed in the SPI report were applicable to
university education on computing (and to university
education in general). Once these topics were identi-
fied, we created a list of 20 statements. For each of
them we add a question of the form: From 1 to 5, how
important is the topic T for your well-being in the sub-
ject, school, university, etc. with the idea of surveying
the largest number of students possible.
As we have already mentioned, we concentrate in
three dimensions:
• Lecturing
• Transportation
• School
The first dimension consider question related to the
ways of teaching. In particular the relevance from
the well-being perspective of having face-to-face or
on-line interactions. The second dimension addresses
one natural complaints, especially when reaching the
university requires some time, which has a clear im-
pact in well-being. On the other hand, all of us have
a clear idea that public transportation is better than
private but here we are using a point of view of CO
2
production. Our questionnaire focus on the comfort
of traveling and not on the division public/private mo-
bility. The third dimension, consider the institution
that is organizing the teaching. In our context, the
school is the agent that controls the use of resources.
The school decides the time tables, the class rooms,
the placement of the exams, the sizes of the groups,
etc.
4 EDUCATIONAL MODELS
As we already mention we focus only in what we
call “synchronous education”: at class time stu-
dents and lecturers are both present either in-person
CSEDU 2024 - 16th International Conference on Computer Supported Education
628

or in streaming. In order to identify which educa-
tional models fit better with those well-being topics
that our students consider more important, we con-
sidered three dimensions:
• Type of lecturing
• Transportation
• Resources and organization
4.1 Type of Lecturing Classes
We consider four different ways of teaching the
classes of the two courses on which we based our
study. These follow the different combination of face-
to-face and on-line interaction that we experimented
during the pandemics. Each type is set by fixing the
percentage of in-person requirements for each of the
following parts of the course: a) theory classes, b)
problem classes, c) laboratory classes, d) video taped
classes and e) assessment. Table 3 shows the percent-
age of in-person attendance of each of the four ways
of lecturing.
4.2 Transportation
One of the factors influencing well-being is the kind
of journeys needed to reach a university campus. In
our university, we were able to identify three kind of
campuses: a) campuses in which the duration of the
average journey is less than 30 minutes, b) campuses
in which the duration of the average journey is greater
than an hour and a half and c) campuses in which the
average journey duration is in between the other two.
For the first kind of campus, we observed that the
students transportation is mainly by means of public
transportation. It is questionable but we considered –
arbitrarily– that public transportation is less comfort-
able than private one but cheaper. Therefore, we have
considered that the journeys on public transportation
only were pretty uncomfortable (assigning a 1 value
in the corresponding question) and inexpensive (as-
signing a 5 value in the corresponding question). As
distances are higher, the use of public transportation
decrease, so for the second one we assume the per-
centage of public transportation to be around the 30%.
Thus, we assigned values of 5 in comfort (completely
comfortable journeys) and very expensive (assigning
a 1 value in the corresponding question). For the third,
it is likely to be 50% public transportation and the rest
private. Consequently all the assigned values were in
the middle (assigning them a value 3). The reason
to these choices was to include in the kinds of trans-
portation all the possible contrast of values.
Table 3: Percentage of in-person attendance according to
the type of classes.
Type L
1
L
2
L
3
L
4
Theory 100% 0% 0% 100%
Problems 100% 0% 0% 50%
Laboratory 100% 0% 100% 0%
Videos 0% 100% 50% 50%
Assessment 100% 50% 75% 75%
Table 4: Percentage of use of public transportation in stu-
dents journeys to university campuses.
Type Campus Campus Campus
T
1
T
2
T
3
Public 100% 30% 50%
Private 0% 70% 50%
4.3 School Types
The FIB offers a Computer Science degree with four
different specialties. Each generation consists of ap-
proximately 400 students who study subjects from a
common two-year core and then choose a specialty
from among four possible ones: computing, software
engineering, information systems and hardware. The
theory classes are divided into groups of 60 students
while the laboratories are conformed by 20 students.
There are lectures in the morning and afternoon for all
subjects and an enrollment order is imposed in which
the students choose the lecture times that they want
according to their average grade. In general, the stu-
dents do not feel that they are part of a group –since
it can change semester to semester and from one sub-
ject to another, even from theory classes to labora-
tory classes. In summary, we consider this school as
a large one in which students do not group together
in a single group but are grouped into small groups
according to friendships and affinities.
For its part, the FME offers the degree in Mathe-
matics without independent specializations. Each co-
hort consists of approximately 75 students. The the-
ory classes are divided into groups of 35-40 students
while the laboratories have a maximum of 30 stu-
dents. There are classes only in the morning for all
subjects and students are in the same group for both
theory classes and problem classes throughout their
entire degree. For this reason, a lot of cohesion is cre-
ated among all the students of this school. In contrast
to the FIB, the FME is a small school in which all the
students of the same generation (and even from dif-
ferent generations) work closely together and form a
kind of big family.
Both schools also have students’ associations, al-
though for the reasons we explained before, FME’s
students participate in them more actively than FIB’s
students. The same goes for the social and academic
A Proposal for an Educational Well-Being Index (EWI) for Undergraduate Course Design
629
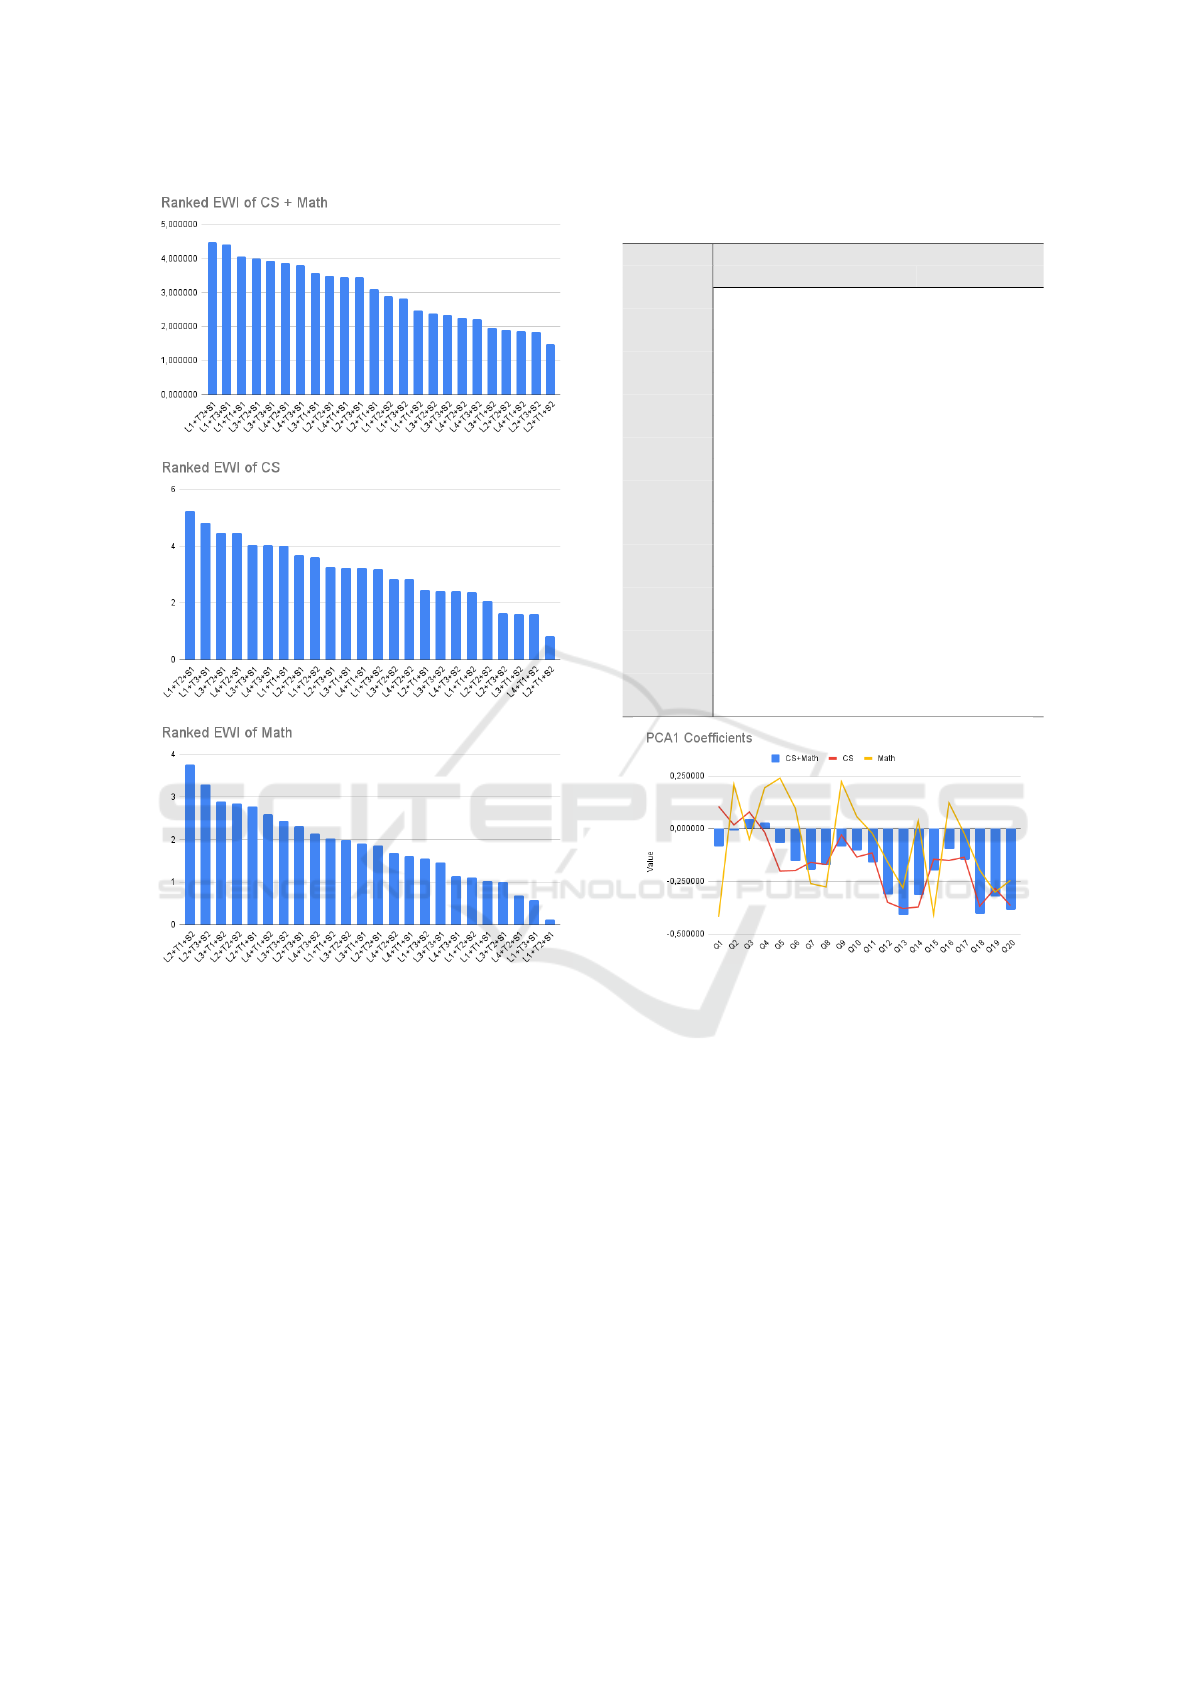
Figure 1: Ranked EWI of the different models for the con-
sidered populations.
activities that both schools offer to their students.
In order to provide support to students, it is also
possible in both schools (for those students who re-
quest it) to have a tutor (a lecturer who can advise
them on academic issues) and a mentor (a student of
more advanced courses who guide them in the first
years of studies). As expected, FME’s students tend to
ask for mentors more frequently than FIB’s students
and although they do not formally request them, the
cohesion between students in FME is so strong that
students from more advanced courses usually act as
mentors for newly arrived students.
4.4 Educational Models and Well-Being
Finally, we define educational models as 3-tuples se-
lecting the types of lecturing (4), transportation (3)
Table 5: Coefficients of the 1st PCA component for the con-
sidered populations.
Question PCA1 coefficients
CS + Math CS Math
Q1 -0.085275 0.105952 -0.419600
Q
2
-0.009672 0.017823 0.209514
Q
3
0.044217 0.079005 -0.049599
Q
4
0.029739 -0.016453 0.194054
Q
5
-0.068040 -0.200985 0.239976
Q
6
-0.154504 -0.198831 0.096388
Q
7
-0.196589 -0.159725 -0.260992
Q
8
-0.174137 -0.170388 -0.276614
Q
9
-0.084349 -0.030297 0.222551
Q
10
-0.103875 -0.134508 0.056949
Q
11
-0.159900 -0.115195 -0.021422
Q
12
-0.313385 -0.349402 -0.157717
Q
13
-0.409164 -0.379408 -0.281585
Q
14
-0.314704 -0.371641 0.037266
Q
15
-0.198096 -0.145104 -0.405415
Q
16
-0.096386 -0.150898 0.122577
Q
17
-0.147899 -0.135657 -0.023578
Q
18
-0.403038 -0.367978 -0.196697
Q
19
-0.322291 -0.283208 -0.301314
Q
20
-0.384016 -0.364963 -0.245365
and school (2). This gives a total of 24 combinations
defining the educational models considered in this pa-
per. For each of them, we calculate how present were
–in the model– each of the 42 topics of the survey.
Our topic assessment is personal, following from our
experience in teaching and our perception of the rele-
vance of the topics according to the selected parame-
ters.
5 THE EDUCATIONAL
WELL-BEING INDEX
Here we relate the components of Sections 3 and 4 to
obtain the EWI. Our index allows us to evaluate the
24 educational models considered in the previous sec-
tion in relation to what the surveyed students consider
important for their well-being.
The first step is to use the data gathered in the poll
to extract the relevance of each of the topics included
CSEDU 2024 - 16th International Conference on Computer Supported Education
630
in the survey. For doing so, we use the principal com-
ponents analysis (PCA) statistical method, that re-
duces categorized data to their essential features, the
so-called principal components. The principal com-
ponents are linear combinations of the original vari-
ables. The coefficients in the linear combination are
obtained so that the direction maximally explain the
variance of all the variables. In general, the method
provides an approximation of the original data table
using only these few major components. Following
the SPI definition, we only consider the first compo-
nent of the PCA. This approach allows us to rank by
its relative importance each one of the well-being fac-
tors of the survey. This rank is a projection on the first
component of the PCA.
On the other hand, in Section 4, we provide an
assessment (subjective to our view) on how present
are each of the factors considered in the survey within
each of the proposed educational models. We ob-
tained this assessment by subjectively grading the
same survey that we had administered to the students
for each of the 24 possible models.
To obtain the EWI of an educational model, we
use the coefficients of the first component of the PCA
to assign an index value to each educational model.
We multiply the value (duly scaled) given to each
question (or factor) by the coefficient of the question
in the first PCA component of the students responses.
This allows us to position each model on the principal
component axis in such a way that the higher the value
of the corresponding model on that axis, the more cor-
related the model is with the principal component, or
in other words, the higher the value obtained for each
model, the better the model adapts to what students
consider important for their well-being.
In our case study, we wanted also to analyze the
sensibility of the model to a population. For doing
so, we performed the PCA analysis on three data sets:
the CS, the Math, and the aggregated CS + Math. In
Figure 1, we depict the sorted values of the EWI, for
the three data sets. In Table 5, we present the co-
efficients of the PCA. As the two considered popu-
lation appear to have different sensibilities towards
well-being, none of the three rankings coincide. Let
us look to the PCA coefficients for questions in the
lecturing dimensions. Having in-person classes (Q
1
)
gets positive weight in EWI from CS and negative in
the other cases, while having them broadcasted live
(Q
2
) gets negative weight in the global data but posi-
tive in the others. Having offline classes prerecorded
(Q
3
) gets negative weight only from Math and broad-
casting platforms (Q
4
) only from CS.
It is also worth mentioning the weighting of the
questions in the transportation dimension. Travel-
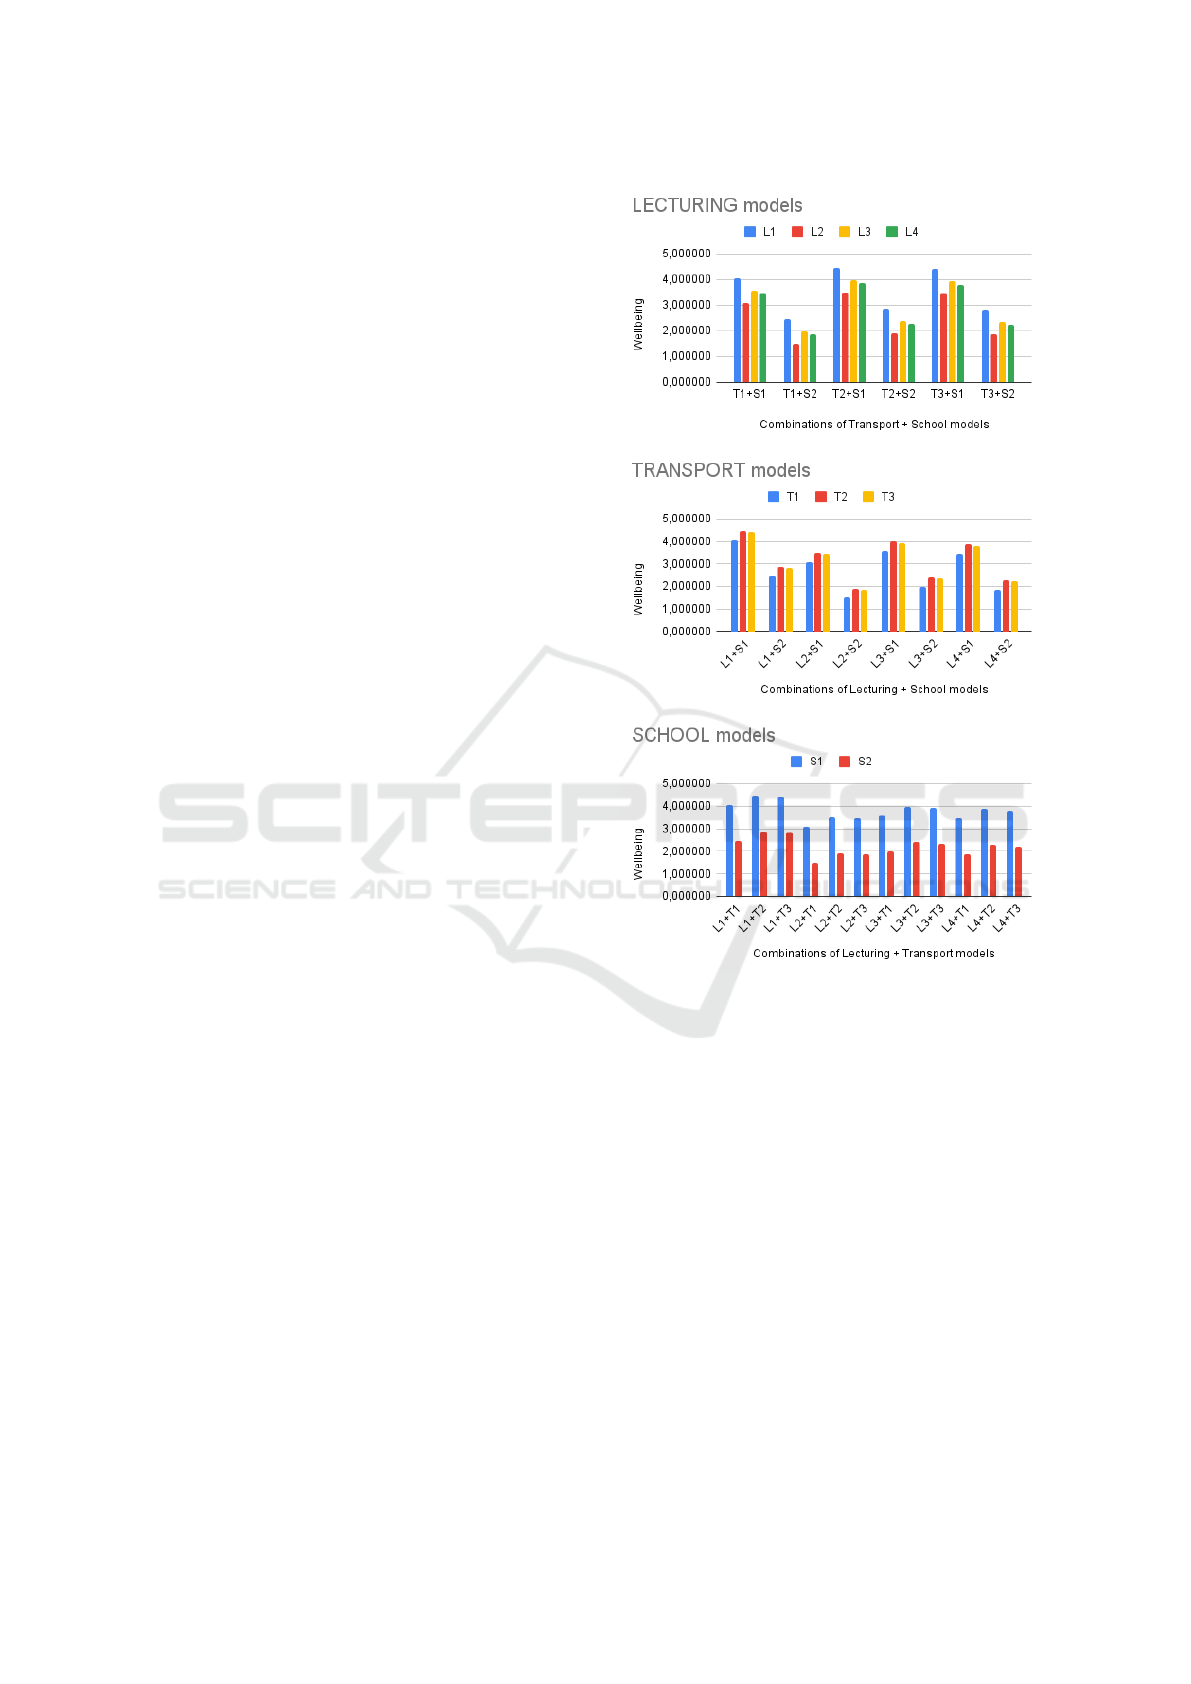
Figure 2: The EWI per dimension taking the PCA of the
poll from both CS and Math students.
ing time (Q
5
) and comfort (Q
6
) get positive weight
in EWI from Math and negative in the other cases.
This might be explained because there are more CS
students and usually their schedule is quite chaotic
while Math students are less and usually have com-
pact schedules.
In Figures 2, 3 and 4 we depict the results of the
EWI rankings per dimension. Under this point of
view, we can visualize better the variations of the EWI
when fixing a dimension. Analyzing the school di-
mension, we can see that the EWI of the educational
models follow the same tendencies in the three cases.
Using CS data, models with S
1
get higher values of
EWI than models with S
2
, the situation is reversed for
the Math data. When dealing with the complete data
set, the tendency seems to be dominated by the FIB
population. This is in accordance with the fact that
A Proposal for an Educational Well-Being Index (EWI) for Undergraduate Course Design
631
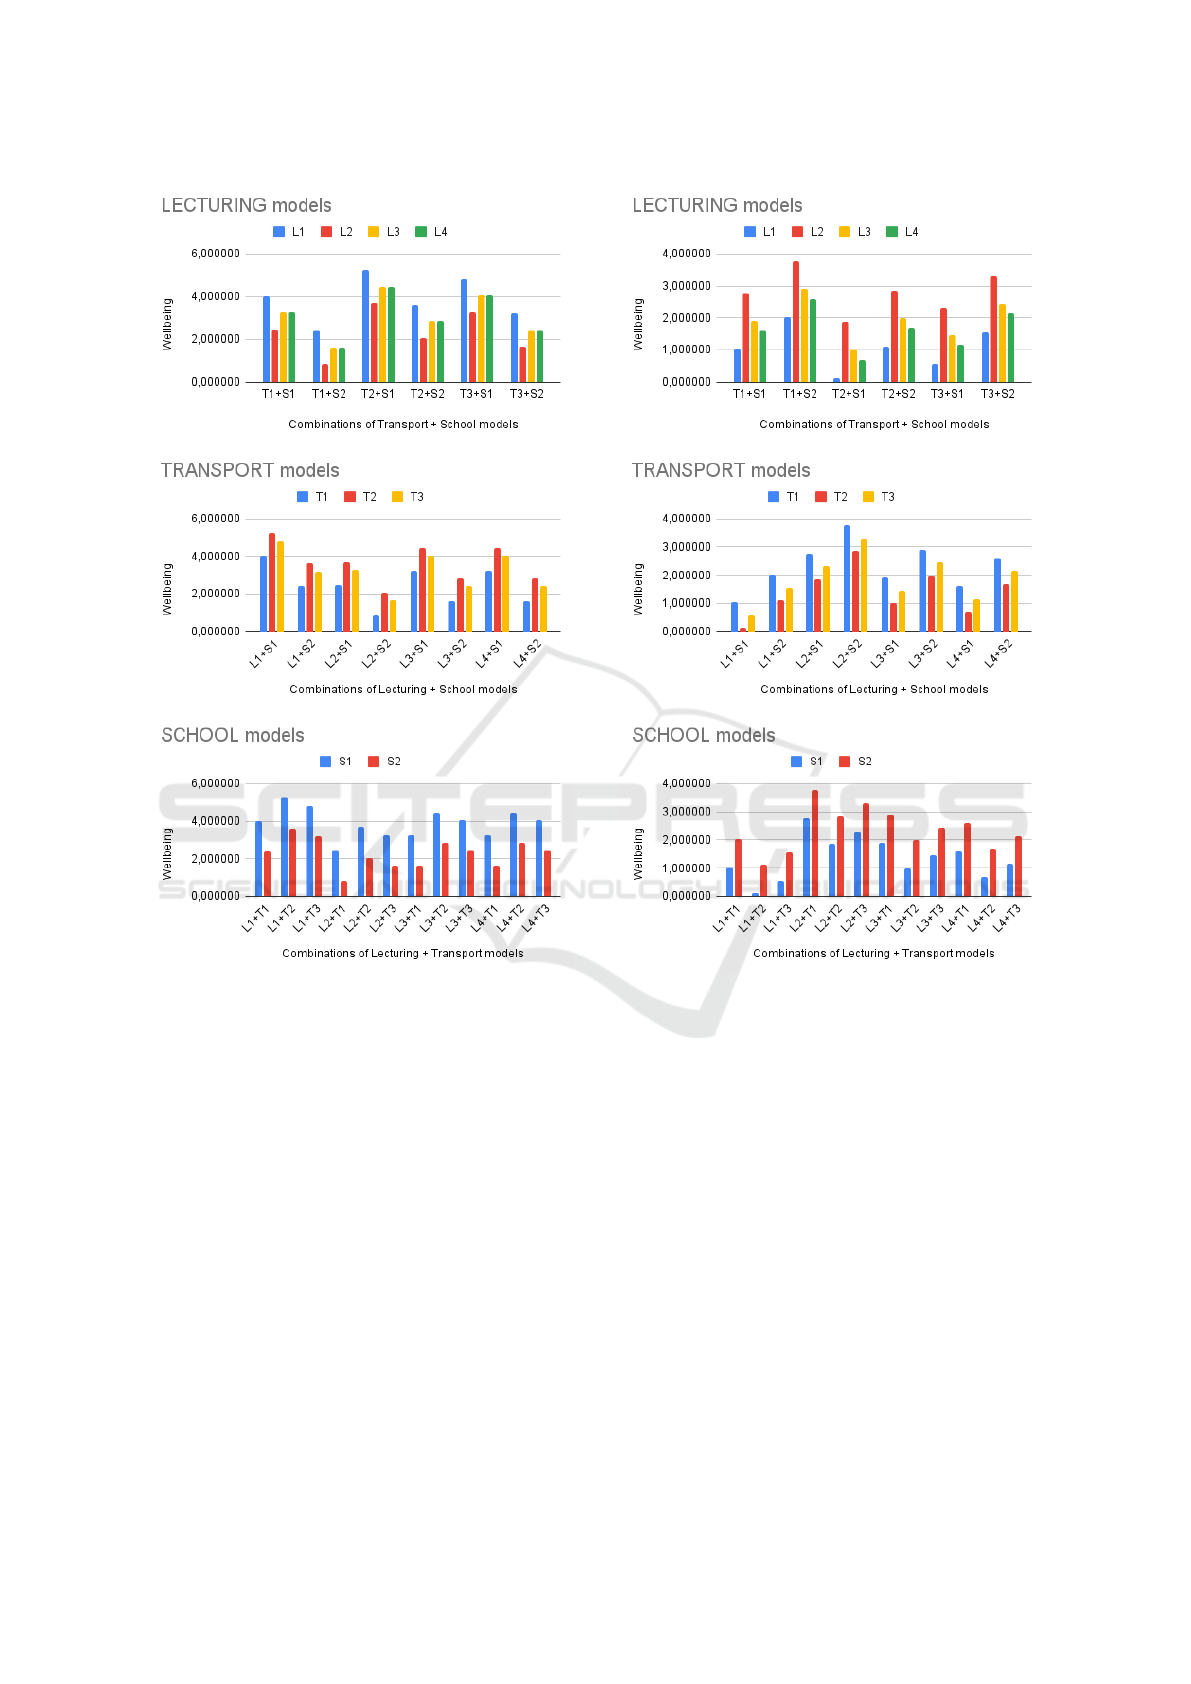
Figure 3: The EWI per dimension taking only the answers
of the CS students in the PCA.
when weighting school dimension, we have in mind
most trends of CS for S
1
and more from Math for S
2
.
A further interpretation is that in both populations, the
EWI increases in models considering a school model
similar to the chosen one.
From the point of view of the transportation one
can observe variability in the three models, while in
the lecturing dimension, models L
1
and L
2
present
the most different influences in the index. We do not
have any explanation of the changes of the EWI due
to these components. We suspect that there are some
relevant correlations between the lecturing and trans-
portation models that require further study to be ex-
plained.
Figure 4: The EWI per dimension taking only the answers
of the Math students in the PCA.
6 CONCLUSIONS AND FUTURE
WORK
At present, where the economic growth has been
widely criticised, the well-being appears as a funda-
mental issue. Recently, the importance of measuring
well-being has been recognized as a relevant tool in
the evaluation of countries, institutions, communities
and individuals in addition to the classic indicators
used in economics. We can say that, as individuals,
the well-being of every one is a personal concept that
depends at least in part on our worldview (weltan-
schauung). Therefore, the well-being has also many
components and can be analyzed at different levels.
We have proposed and study the EWI as a measure of
well-being for educational models to be used as an a
CSEDU 2024 - 16th International Conference on Computer Supported Education
632

priori appraisal when designing a course implemen-
tation. The EWI relies on parameters extracted from
a student valuation of some well-being topics. As the
student were taken from sectors with diverse interests,
we have been able to see that the index is sensible to
the trends of the selected population. In the coming
semesters, we plan to run a similar poll but asking for
the valuation of the topics in the context of the course.
This will help us to validate the result and understand
better the applicability of the index.
The student’s well-being is a multidimensional
concept, in this paper we have focused only in three
of the many possible dimensions, namely lecturing,
transportation and school facilities, but many other
could be incorporated in the index. Note that, some
of these aspects, like facilities or public transporta-
tion, are external to the pedagogical aspects of course
organization. Our proposal could be adapted to other
environments or interests, by redefining dimensions
and the corresponding topics of interest. We plan to
extend the survey on well-being to a bigger popula-
tion of students from CS and Math and look into more
than one dimension of the PCA. It will be also worth
to perform a factor analysis to identify the relevant
topics in every considered dimension.
REFERENCES
Dodd, A. L., Priestley, M., Tyrrell, K., Cygan, S., Newell,
C., and Byrom, N. C. (2021). University student well-
being in the United Kingdom: a scoping review of its
conceptualisation and measurement. J. Ment. Health,
30(3):375–387.
Jackson, T. (2021). Post Growth: Life after Capitalism.
Polity Press, Cambridge.
Kanonire, T., Kulikova, A., and Orel, E. (2022). Measur-
ing well-being in school and university: Approaches
and challenges. In Irtelli, F. and Gabrielli, F., edi-
tors, Happiness and Wellness - Biopsychosocial and
Anthropological Perspectives. IntechOpen.
Nordhaus, W. (2013). The Climate Casino: Risk, Uncer-
tainty, and Economics for a Warming World. Yale
University Press.
Paulson, S., D’Alisa, G., Demaria, F., and Kallis, G. (2020).
The Case for Degrowth. Polity Press, Cambridge.
Pigou, A. C. (2013). The Economics of Welfare. Palgrave
Classics in Economics. Springer. Originally published
in 1920.
Skidelsky, E. and Skidelsky, R. (2013). How Much is
Enough?: Money and the Good Life. Penguin.
Social Progress Org (2024). 2024 Social Progress Index -
Executive Summary.
The Economist (2023). How well does your country provide
for its citizens?
Wang, R.-J., Lin, S., Tseng, M., Tsai, M.-H., and Chang, T.-
H. (2022). Measuring college campus well-being with
multidimensional indices: Sustainability of higher ed-
ucation in Taiwan. Sustainability, 14(8260).
Webometrics (2023). Ranking Web of Universities.
Wikipedia (2024). List of countries by GDP (nominal) per
capita.
A Proposal for an Educational Well-Being Index (EWI) for Undergraduate Course Design
633
