
Introducing Flowride® Logger, an Onboard Data Collection Framework
for Commercial Automated Vehicles
Kerem Par
a
, Ali Ufuk Peker
b
, Reza Ghahremaninejad
c
, Ali Ozcan
d
and Ertan Sahin
e
Software Development Group, ADASTEC, Dudullu, Istanbul, Turkey
Keywords:
Advanced Drive System, Autonomous Driving, Self-Drive Vehicles, Automated Public Bus, Data Logging,
Data Collection, Data-Driven Development, Sensor Data Recording, Event Data Logger, Event-Based Data
Recording.
Abstract:
Rapid growth in the development, implementation, testing and deployment of Automated Vehicles (AV) in
recent years highlights the global eagerness toward safer, cost-effective, cleaner and accessible transportation
solutions. Reaching the promises requires continuous improvements in the AV software design and the prepa-
ration of pipelines to share that progress with the public and road authorities. An AV onboard data recording
system plays a crucial role in delivering such information. In this work, we introduce Flowride® logger, a
combined continuous and event-based data collection framework for real deployed AVs. Our approach con-
siders two objectives to accomplish: 1- To aid software engineering efforts with real data from the deployed
vehicle for data-driven development procedure. 2- To record, store, and share data with third party and road
authorities for safety purposes and incident reports. Flowride® logger framework performance was discussed
using observation from its implementation on the automated e-ATAK vehicle. This 8-meter electric-powered
bus is part of the public transportation fleet of Stavanger, Norway. The experimental results demonstrate the
effectiveness of Flowride® logger as a means for data collection from deployed AVs.
1 INTRODUCTION
Improving the performance of Automated Vehicles
(AVs) in terms of safety, cost-effectiveness, reliabil-
ity, and accessibility can be achieved by implement-
ing an agile research and development framework
(Lazar and Shyam, 2018). The use of recorded real-
world data from the AV On-Board Units (OBUs) can
help to better analyze the behavior of the Automated
Drive System (ADS) during both the design and de-
ployment stages of AVs. This has become a require-
ment from the U.S. National Highway Traffic Safety
Administration (NHTSA) and European road author-
ities, as stated in the general safety regulation (EU)
2019/2144, which mandates that deployed AVs must
provide continuous and reliable data recording means
to supply required data for safety assessments (Riehl,
2018), (Kohler and Colbert-Taylor, 2014), and (Ilkov
´
a
a
https://orcid.org/0000-0002-0659-6189
b
https://orcid.org/0000-0003-1332-0305
c
https://orcid.org/0000-0003-3766-6319
d
https://orcid.org/0009-0008-7000-0379
e
https://orcid.org/0009-0002-8464-7022
and Ilka, 2017).
AVs produce and process a large amount of data.
Most of this data comprises raw sensor measure-
ments, while other data include information resulting
from post-processing raw data or human operator in-
tervention. Deciding what to record at a lower level,
close to raw data, and what to discard depends on
the available resources in the OBU and the purpose
of recording. Essentially, a trade-off must be made
between the consumption of OBU resources (such as
network infrastructure, CPU, RAM, and local stor-
age) and the volume of data required for two pur-
poses:
• To collect data for data-driven development ef-
forts mainly consisting of raw sensor measure-
ments.
• To collect data required by road authorities from
the deployed AVs.
In AVs, recording all the generated data is a chal-
lenge due to the higher rate of data generation com-
pared to the rate of data recording. Also, the OBU
on AVs consists of a network of multiple locally dis-
tributed machines, and recording all data in a central-
488
Par, K., Peker, A., Ghahremaninejad, R., Ozcan, A. and Sahin, E.
Introducing Flowride® Logger, an Onboard Data Collection Framework for Commercial Automated Vehicles.
DOI: 10.5220/0012738300003702
Paper published under CC license (CC BY-NC-ND 4.0)
In Proceedings of the 10th International Conference on Vehicle Technology and Intelligent Transport Systems (VEHITS 2024), pages 488-495
ISBN: 978-989-758-703-0; ISSN: 2184-495X
Proceedings Copyright © 2024 by SCITEPRESS – Science and Technology Publications, Lda.

ized storage would require transferring data through
network infrastructure like switches and routers. This
increased network traffic can cause a failure in mes-
sages passing between safety-critical components,
which should be avoided.
To address these challenges, an event-based data
recording approach is proposed, which records a set
of information based on the occurrence of specific
events. This approach reduces the OBU resource oc-
cupation time and allows for the labeling of collected
data based on predefined event conditions, making it
easier to manage and scale the data management pro-
cedure.
In this work, we introduce the Flowride® logger,
a hybrid event-based and continuous logging frame-
work implemented on ADASTEC commercial full-
stack AV software, Flowride.ai® . This framework
is deployed on the KARSAN e-ATAK 8-meter elec-
trified bus in the U.S. and Europe, known as the first
commercial mid-size automated public transportation
bus in both regions. We use real data from the de-
ployed bus in Norway, Stavanger, to demonstrate the
effectiveness of the proposed framework. In the fol-
lowing sections, we discuss related work in the scope
of AV onboard data collection frameworks, provide a
problem description for data collection based on the
operation of a real deployed AV, and present statisti-
cal data representing the operation performance of the
Flowride® logger framework. Finally, we conclude
the current work and discuss future work paths.
2 RELATED WORKS
Real-time data recording of autonomous robots is es-
sential for providing evidence of their operation, both
successful and failed, and for utilizing real-scene data
in development. In their publication (Saaristola et al.,
2022), the authors provide a comprehensive overview
of the requirements and challenges of data collec-
tion for AVs. They divide the data collection frame-
work into three main components: data selection (se-
lecting content to record), data extraction (retriev-
ing recorded data), and data transmission (transfer-
ring data from the OBU to remote storage). The au-
thors conducted their research in collaboration with
a commercial AV software supplier and used numeri-
cal measurements to evaluate the performance of their
work. However, their study was conducted on a sin-
gle machine and did not consider the network infras-
tructure for an OBU of distributed machines. Addi-
tionally, the authors did not discuss event-based data
collection, which involves triggering the data collec-
tion module when predefined conditions are detected.
Generally, our methodology and experiments align
with those proposed by (Saaristola et al., 2022).
In our work, we follow a data collection approach
similar to that described in (Saaristola et al., 2022).
However, we use two different methods for data col-
lection: continuous and event-based data collection.
In the latter method, we record data within a time
range of t − δ < t < t + δ if one of the predefined
events occurs. It means the Flowride® logger should
keep all subjects to record data in the computer’s
stack memory for δ seconds instead of trying to write
to storage. This reduces continuous and unneces-
sary occupation of disk I/O usage bandwidth. In
Flowride.ai® we have δ = 20 seconds.
Regarding works on recording data based on trig-
gered events, we can refer to (B
¨
ohm et al., 2020) for
a detailed overview of the subject and to (Guo et al.,
2020) and (Guo et al., 2018), where the authors use
a blockchain-based mechanism to extract events. We
have noticed that the works in (B
¨
ohm et al., 2020),
(Guo et al., 2020), and (Guo et al., 2018) aim to
provide event detection procedures that lead to data
collection based on the requirements of road authori-
ties, focusing mainly on safety measures, incident and
crash reporting. However, these works did not dis-
cuss events related to data collection for data-driven
development. We refer to works (Guo et al., 2020)
and (Guo et al., 2018) as efforts to identify events that
trigger the whole or part of the data collection frame-
work. In our work, the event conditions are strictly
predefined, since we have mapped all requirements
from event-based data collection into a constant set of
messages to collect. However, this can be subject to
future work to utilize and expand event-based logged
data file metadata.
The benefits of data-driven development in the AV
sector are not a new topic among researchers (Koch
et al., 2020). For example, we can refer to the work of
(Ma and Qian, 2021), where the authors used a data-
driven approach to solve the traffic sensing problem,
such as determining traffic flow, density, and speed.
The authors in (Parsa et al., 2021) proposed a data-
driven approach to study the impact of connected AVs
on traffic flow. The authors in (F
´
enyes et al., 2021)
used a data-driven approach for the control design
of AVs by contributing data-driven approaches in AV
motion modelling. Data-driven modelling and AV
scenario simulation applications, where real-world
data was used to reconstruct the real scenario in the
simulation environment, also gained attention. For
example, we can refer to the work of (Amini et al.,
2020), where the author proposed a data-driven simu-
lation and training engine using human-collected tra-
jectory paths to develop a robust control policy. As
Introducing Flowride® Logger, an Onboard Data Collection Framework for Commercial Automated Vehicles
489
another example, the author in (Zofka et al., 2015)
proposed a framework to use raw sensor and vehi-
cle trajectory data to create traffic scenario simula-
tions to develop an advanced drive assistant system.
All the mentioned works on data-driven approaches
in the development and simulation of AV-related ap-
plications highly depend on the data collection frame-
work. Based on the related works to provide a data
collection framework and an investigation of the re-
quirements for a proper data collection framework, in
the following section, we will discuss the data col-
lection problem in Flowride.ai® . We will consider
the hardware and software frameworks and focus on
the requirements for data-driven development and in-
cident reporting. Then, by discussing the observed
measurements, we will evaluate the Flowride® log-
ger’s performance.
3 PROBLEM DEFINITION
ADASTEC Corporation deployed an SAE Level-4
(SAE J3016:202404, 2021) automated bus as part of
public transportation in Stavanger, Norway (Figure
1). The goal is to provide a data collection frame-
work with the dual objectives of providing real-scene
data:
• For AV data-driven development approach.
• Provide data required by road authorities.
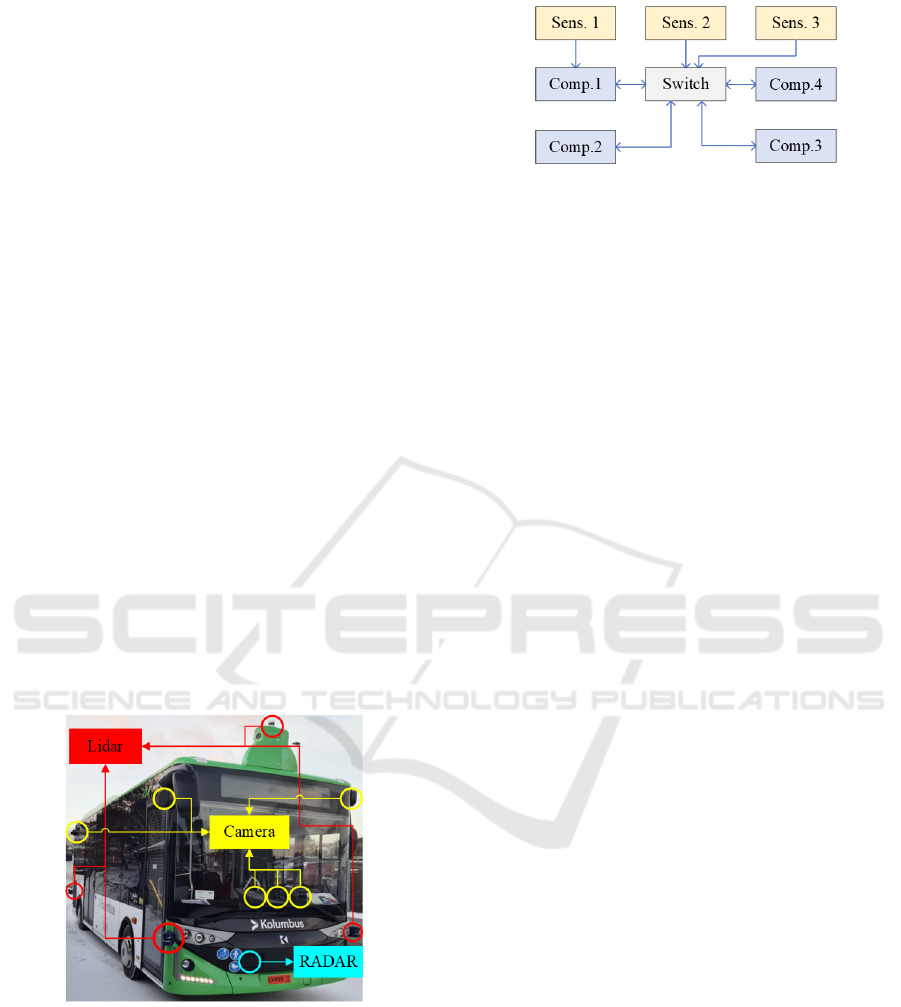
Figure 1: SAE level-4 automated e-ATAK, 8-meter electric
bus as member of public transportation fleet of Stavanger,
Norway.
Flowride.ai® software is implemented on a dis-
tributed network of computers with sensor suites. Fig-
ure 2 shows Flowride.ai® general hardware architec-
ture.
The system consists of four computers and three
sets of sensor suites. Two of the sensor suites and
the computers are connected via an industrial switch.
Figure 2: The hardware architecture of Flowride.ai®. In
general, compute 1 handles Sens. 1, CAN communication
with vehicle ECUs and RADAR, compute 2 holds HMI,
logger and redundant safety modules, compute 3 and 4 are
dedicated to perception, localization, planning and control
modules. Sensor suites 2 and 3 includes lidar, camera, and
GNSS/INS receiver.
The first sensor suite is directly connected to com-
puter 1. We can categorize electrical/electronic ar-
chitecture of the AV as a vehicle centralized architec-
ture (Apostu et al., 2019). The data collection module
should retrieve all data from the computers and sen-
sor suites through the switch. The message-passing
packet format is TCP/IP. The Flowride.ai® hardware
includes a 128-channel 3D lidar, four 64-channel 3D
lidars, a front-mounted RADAR, eight RGB cam-
eras, and a GNSS/INS receiver. Additionally, there
are 3-channel Control Area Network (CAN) buses to
communicate with vehicle Electronic Control Units
(ECUs), one CAN bus channel dedicated to RADAR
and another channel to communicate with the steering
wheel encoder sensor. All of these sensors, directly
or via the switch, are connected to the four comput-
ers. GNSS/INS receiver configured as ground clock
master, realizing time synchronization between sen-
sors and compute units using Precision Time Protocol
(PTP).
To meet our main objectives of collecting proper
data for a data-driven development approach and to
share data with road authorities according to EU and
local regulations, we need to collect all CAN bus
messages, RADAR, GNSS/INS messages, one front
mounting RGB camera, and a down-sampled point-
cloud of the concatenated point-cloud from the five
lidars. In addition to the mentioned data types, in-
formation such as debug data, diagnostics, status, and
some mid-level messages, such as tracked object lists,
high-level control, and decision-making commands,
are also required to be collected. The latter will boost
efforts to reproduce the scene without needing low-
level sensor data. As mentioned, the message packets
are in TCP/IP format, which may require more com-
putation effort on the source computer’s side. This is
because, in case of packet failure, the TCP/IP mes-
sage transmitter will try to resend the packet, reduc-
ing the probability of packet loss compared to a UDP
VEHITS 2024 - 10th International Conference on Vehicle Technology and Intelligent Transport Systems
490
packet delivery. When using UDP, there is no hand-
shake procedure and the sender has no feedback if the
packet is delivered to the destination.
By investigating a set of previously selected con-
tents to collect, it is observable that raw sensor read-
ings make up 83% of the data, while the remaining
17% are processed data. Table 1 presents the vol-
ume of data target to collection per byte per second
of Flowride.ai® sensors. N and DSR are the numbers
of sensors and the generic downsample ratio where
0 < DSR ≤ 1 respectively.
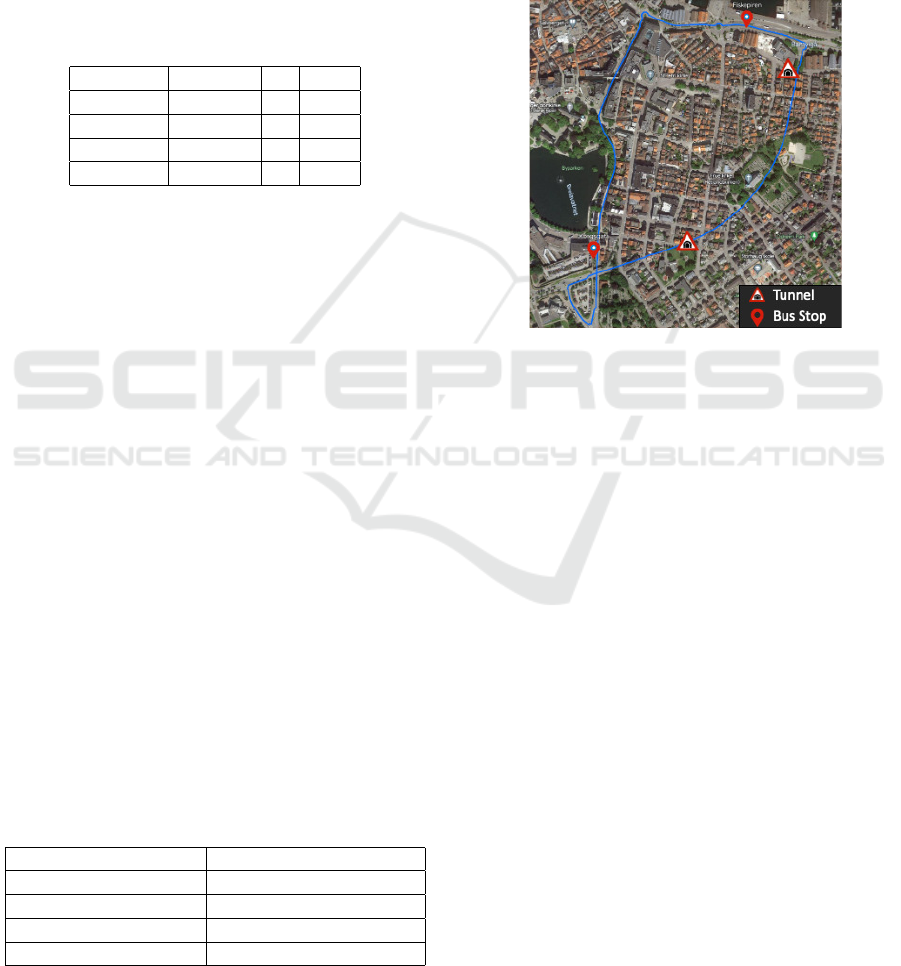
Table 1: Sensors raw data generation volume, MB/s.
Name Data N DSR
Lidar 46 MB/s 5 0.3
Camera 13 MB/s 1 1.0
CAN bus 82 KB/s 5 1.0
Others 47 KB/s - 1.0
The biggest proportion of raw sensor data is re-
lated to the lidar point cloud with 77% share of the
raw data. It consists of two downsampled point clouds
with 10 Hz transmission rate; a concatenated point
cloud of 5 lidars and a single 128-channel lidar sep-
arately. The second largest data belongs to a single
forward-looking RGB camera image with 1440 by
928 pixel resolution and 10 frame per second image
transmission rate with 22% shares of the raw data.
The rest of the sensors, including the GNSS/INS re-
ceiver, RADAR points cloud in the form of raw CAN
messages and three channels of CAN bus communi-
cating with vehicle ECUs, generate a relatively negli-
gible amount of data.
It is important to consider the volume and fre-
quency of message generation when dealing with
large amounts of data. The rate at which TCP/IP
packets are generated can affect the performance of
computer and network infrastructure. In Table 2,
all generated messages (including raw and processed
data) are sorted based on their frequency. We have
categorised data contents into four categories: CAN
bus messages, status and diagnostics, vehicle inter-
face and control messages, and lidar and camera raw
readings.
Table 2: Data generation frequency for four groups of data
sources in Flowride.ai® per Hz.
Data source Average frequency (HZ)
CAN bus 373
Status and diagnostics 40
Control 20
Lidars and cameras 10
Figure 3 shows a trajectory of 2.2 km in which the
AV travels an average of 6 hours per day, performing
36 round trips, each around 10 minutes. The route
contains a tunnel, roundabouts, bus stops, and rela-
tively dense traffic of pedestrians, cars, buses, trucks,
bicycles, and scooters. The average total volume of
data required to be collected is 73 MB/s, which for
each day of operation will result in:
73 MB · 6 Hours · 3600 Seconds = 1.576 T B.
The data retrieval procedure starts at the end of the
operation time to transfer data to the remote server.
Figure 3: 2.2 km route travelled by e-ATAK automated by
Flowride.ai® as member of public transportation fleet of
Stavanger, Norway.
In the next section, the Flowride® logger frame-
work considering the mentioned characteristics of de-
ployed AV will be discussed.
4 FLOWRIDE® LOGGER
FRAMEWORK
Challenges for onboard data collection can be sum-
marized as follows:
• The total data volume to be recorded continuously
will be around 1.6 TB daily, which is not feasible
to transmit via current Internet infrastructure.
• Continuous recording of the mentioned data re-
quires OBU resource constant allocation, which is
not an optimal approach considering safety criti-
cal components.
To overcome the mentioned challenges and maxi-
mize the utilization of onboard resources, we divide
Flowride® logger modules into two main parts: Con-
tinuous and event-based recording. Each part has a
set of data to collect which, except for the raw sensor
part, are the same for both parts. Figure 4 presents the
framework of Flowride® logger.
Introducing Flowride® Logger, an Onboard Data Collection Framework for Commercial Automated Vehicles
491
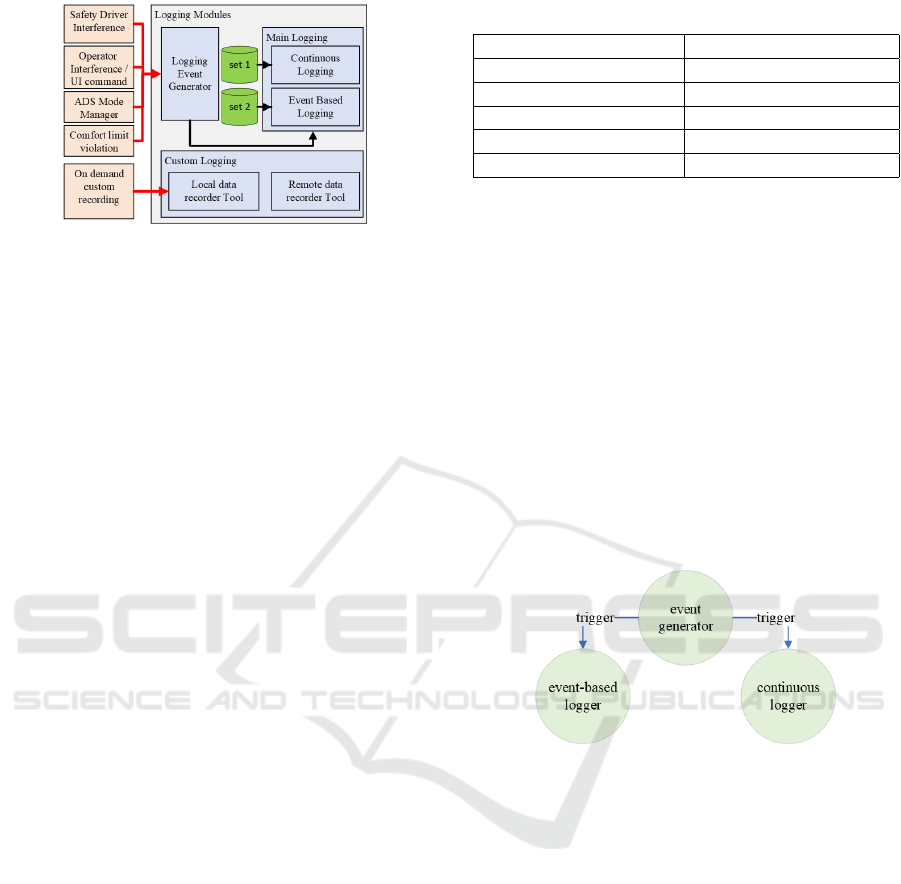
Figure 4: Flowride® logger framework consists of two
main parts: continuous and event-based recorders.
Flowride® logger also has a third auxiliary part,
namely custom logging. Each part, except for cus-
tom logging, has a set of predefined messages that
need to be recorded. The data collection is triggered
by specific event messages. The continuous logging
module aims to collect and label data based on each
trip, which begins and ends at the same location (first
bus stop), covering a complete round of 2.2 km. This
module provides continuous data that can be shared
with third parties if required. The event-based log-
ging module records data triggered by specific events,
which are categorized as follows:
• Safety Driver Intervention. This type of interven-
tion triggers data recording mainly for data-driven
development purposes, with the ultimate goal of
reducing the intervention of the safety driver.
• Safety Operator Intervention. The intervention
of a remote or local safety operator triggers data
recording for the same reason as the intervention
of the safety driver.
• ADS Mode Manager. This module monitors au-
tonomous operation, detects abnormalities, and
initiates Minimum Risk Manoeuvres (MRM). In-
cidents of this type should be referred to during
the development stage to improve AV behavior.
• Comfort Limit Violation. Surpassing passenger
comfort limit in terms of acceleration and jerk
triggers data recording mainly for data-driven de-
velopment purposes, with the goal of reducing oc-
currence of the incident.
Custom sets of data can be configured for on-
demand recording triggered by a local or remote op-
erator through the Human Machine Interface (HMI)
unit. This allows for customized data collection.
Computer 2 in Figure 2 is the host computer
where Flowride® logger applications running. Table
3 presents the host computer hardware configuration.
Software implementation of Flowride® logger
presented in Figure 5. Three applications realizing
Table 3: Host computer hardware configuration.
Name Value
CPU 2.4 GHz Intel (20 Core)
RAM 64GB / 59.6 GiB
Net. adapter bandwidth 10 Gb/s
Storage 5 TB / 530 MB/s
Operating System Linux based
Flowride® logger software implementation are as fol-
lows:
• Event Generator. Detecting and generating events
for continuous and event-based logger applica-
tions to trigger data recording and provide meta-
data for data labelling.
• Continuous Logger. To collect and label data per
trip. The trip information is received from the
event generator application, including the begin-
ning and end of the trip.
• Event-Based Logger. Triggered by a set of pre-
defined conditions. The event-based logger holds
data for δ seconds to write on storage in case of
receiving a trigger message from the event gener-
ator application.
Figure 5: Flowride® logger framework software implemen-
tation including three applications.
In the next section, we will discuss the measure-
ments taken on the resources of the host machine
to evaluate the performance of the Flowride® logger
framework in a particular scenario involving a real de-
ployed AV. To assess the framework’s performance,
we randomly chose a date of operation and discussed
the related data. However, the framework is currently
in daily commercial operation. Additionally, this pa-
per aims to provide insights to engineering and re-
search professionals in general, interested in experi-
ments and design related to the problem of data col-
lection in real deployed AVs, considering the require-
ments discussed earlier.
VEHITS 2024 - 10th International Conference on Vehicle Technology and Intelligent Transport Systems
492
5 OBSERVATIONS AND
MEASUREMENTS
It is expected that a data collection module should not
have any data loss. To evaluate the performance of
the Flowride® logger framework, we need to investi-
gate the data pipeline and ensure that the logger host
computer is receiving all data packets.
We observe the switch communication port to the
host computer for drops or error packets. Then, we
examine the packets at the host computer’s adapter
side to check for any errors or dropped packets. Fi-
nally, we inspect the final collected data to determine
if any packets were missed or failed to be captured.
We compare the number of written and generated
messages for specific data types to conclude our in-
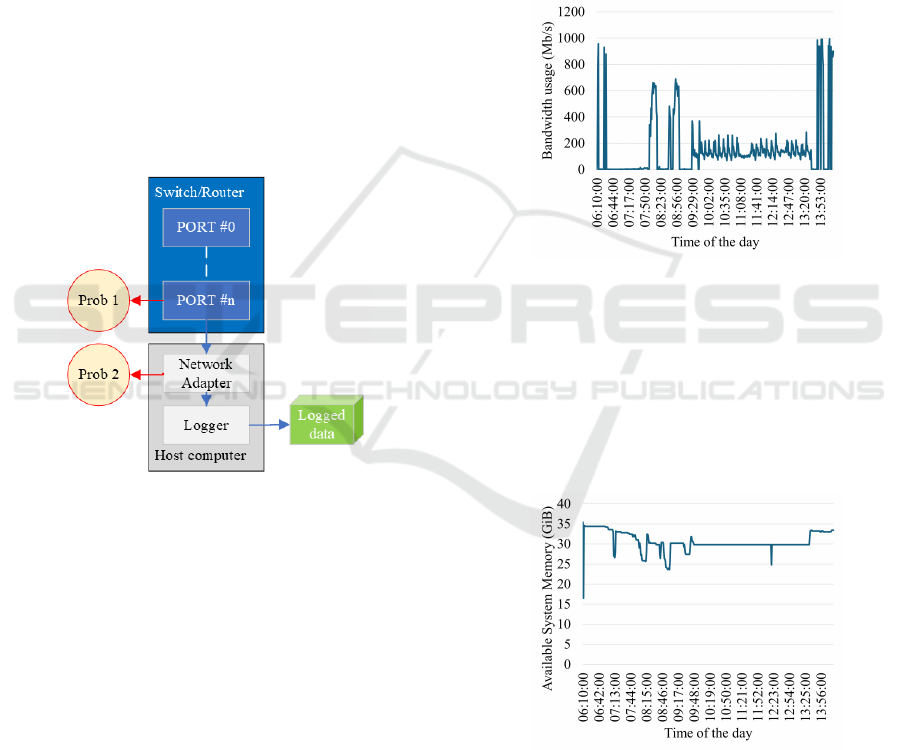
vestigation of packet loss. Figure 6 shows data flow
from the switch port to the host computer network
adapter. Data is then piped into logger modules and
ends up in a data file on storage.
Figure 6: Flowride® logger framework data pipeline from
switch to data file on storage.
We considered the host machine resource uti-
lization when discussing the performance of the
Flowride® logger. We consistently measured and
recorded the host computer resources, including
the total available memory, the CPU load of each
Flowride® logger application, available local storage,
and disk I/O usage bandwidth to observe the host re-
sources load.
For this section, we chose a random day of oper-
ation of the e-ATAK bus and used the data from the
whole day to discuss the mentioned performance me-
ters. We have observed no message drop on the log-
ger side by investigating the log file. Message drops
and error packet numbers are zero at the switch and
host network adapter side. We can verify zero packet
loss by referencing the host network adapter received
packets bandwidth. The bandwidth usage of the sent
packets is negligible compared to the received pack-
ets on the host machine. Figure 7 shows bandwidth
data on the host computer. The maximum value is
still less than 10% of the network adapter and related
switch port maximum bandwidth which is 10 Gb/s.
The jumps in the bandwidth are related to the mo-
ments of start and ending of the operation, which re-
quires message passing between machines. It’s worth
mentioning that at a different setup to investigate our
setup boundaries, we have observed packet losses in
case the bandwidth usage reaches 30% of the maxi-
mum value on switch. The reason for this behaviour
is the subject of more investigation in the future.
Figure 7: Bandwidth usage of host computer network
adapter for the whole day of operation, 6 hours.
Figure 8 shows the total available memory in GiB.
Available memory plays a crucial role discussed in the
previous section since the event-based logger applica-
tion holds history data for δ seconds intervals into the
memory and writes it into local storage if required. It
is observable that the minimum available memory is
far from zero, creating a safe margin.
Figure 8: Available system memory of host computer for
the whole day of operation, 6 hours.
The maximum data write speed of 530 MB/s =
4240 Mb/s should be considered to store collected
data on the local storage. Figure 9 shows a safe mar-
gin between disk I/O bandwidth usage and the maxi-
mum value. Figure 10 also shows the available stor-
Introducing Flowride® Logger, an Onboard Data Collection Framework for Commercial Automated Vehicles
493
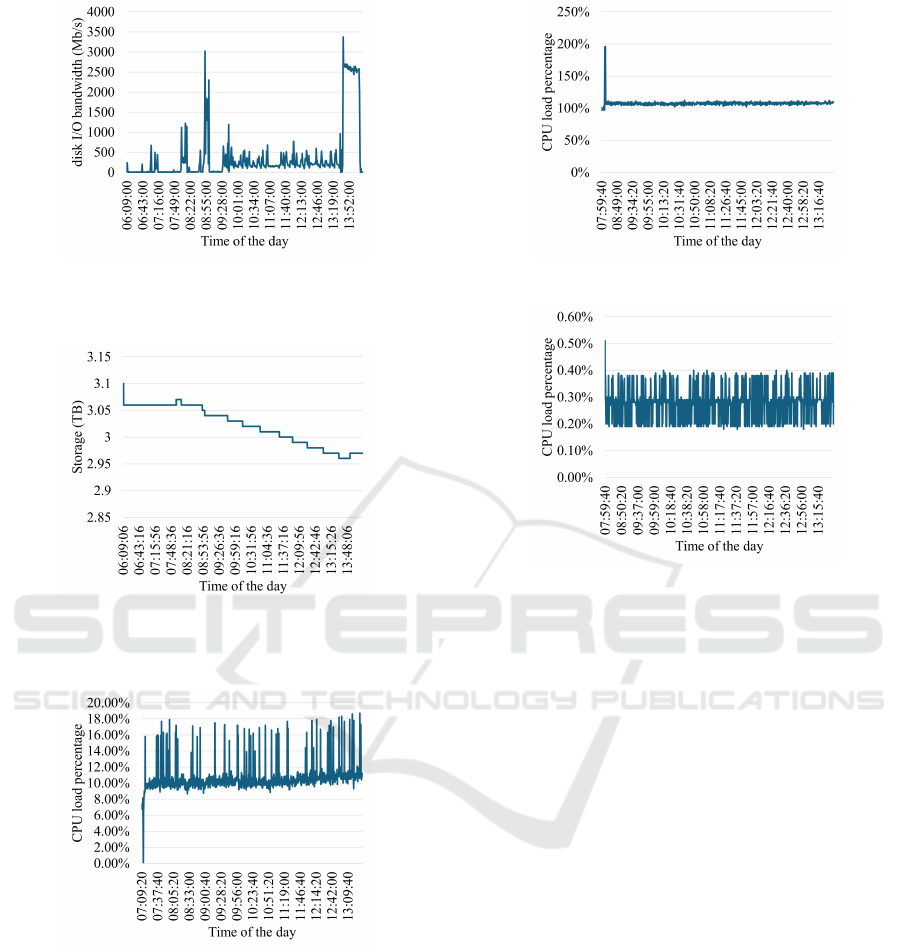
Figure 9: Storage disk write bandwidth of host computer for
the whole day of operation, 6 hours. The maximum storage
disk I/O speed is 4240 Mb/s.
Figure 10: Available local storage of host computer for the
whole day of operation, 6 hours. The value decreases by
storing more data on the storage during operation.
Figure 11: Event-based logger application CPU load.
age, which is decreasing over time as collected data
volume increases.
To discuss the CPU usage of the Flowride® log-
ging, we discuss each application’s CPU usage sep-
arately. Figures 11, 12 and 13 show CPU usage of
each of the three applications. From a CPU perspec-
tive, the continuous logger application imposes the
biggest load on the CPU, occupying more than one
core, 110%. The event-based log application uses al-
most 10% of a CPU core, and the event generator ap-
plication uses 0.3% of one of the cores.
Figure 12: Continuous logger application CPU load.
Figure 13: Logger event generator application CPU load.
6 CONCLUSION
In this work, we have demonstrated the data collec-
tion problem for deployed AVs in general and specif-
ically for the real deployed AV in service as part of
the public transportation fleet of Stavanger, Norway.
e-ATAK is an automated 8-meter electric bus that per-
forms SAE level-4 autonomous maneuvers operating
for 6 hours, 5 days a week, traveling around 80 km
daily with a top speed of 40 km/h. Data collection re-
quirements consider two main objectives: to support
the required data for safety measurement and incident
reports to third-party road authorities and to provide
real development-required data for a data-driven de-
velopment approach. We introduced Flowride® log-
ger framework and applications to collect the required
data. The framework’s performance was measured
by studying logger host computer resource utiliza-
tion: network, local storage, available system mem-
ory and CPU usage of the applications. To inves-
tigate possible packet drops or any failures in trans-
mission data probing conducted on the data pipeline
from the switch corresponding port to the host com-
puter ending in the logged data file. We have found
zero packet loss or transmission failure. This perfor-
mance was achieved by making trade-offs between
VEHITS 2024 - 10th International Conference on Vehicle Technology and Intelligent Transport Systems
494

data collection requirements and resource allocation
of the Flowride® logger framework.
We can also address future experiments to assess
Flowride® logger performance, such as increasing
the number of data contents to record and increas-
ing DSR of the lidar data. Using UDP packets in-
stead of TCP/IP packets is also an interesting subject
to experiment with. We should be able to deal with
packet losses since UDP packet transmission does not
guarantee packet delivery, whereas, in TCP/IP packet
transmission, the source will be retried to deliver the
packet. This retying will, however, impose a load on
the source machine. We need to make a trade-off be-
tween the decreasing logging quality by introducing
higher packet loss probability and easing source ma-
chines’ computation resources but preventing them
from retrying to send packets in case of failure. A
hybrid approach to classify data and choose packet
format according to the severity of the message con-
tent to benefit from both UDP and TCP/IP packets to
deliver data can be another path for future work.
ACKNOWLEDGEMENTS
This work is the result of collaborative effort and pas-
sion within the ADASTEC family. We extend our
special thanks to Onur Yucedag, Kerem Eyisoy, Tay-
fun Yurdaer, and Kaan Cakin.
REFERENCES
Amini, A., Gilitschenski, I., Phillips, J., Moseyko, J.,
Banerjee, R., Karaman, S., and Rus, D. (2020). Learn-
ing robust control policies for end-to-end autonomous
driving from data-driven simulation. IEEE Robotics
and Automation Letters, 5(2):1143–1150.
Apostu, S., Burkacky, O., Deichmann, J., and Doll, G.
(2019). Automotive software and electrical/electronic
architecture: Implications for oems. McKinsey &
Company, retrieved on 1st May.
B
¨
ohm, K., Kubjatko, T., Paula, D., and Schweiger, H.-
G. (2020). New developments on edr (event data
recorder) for automated vehicles. Open Engineering,
10(1):140–146.
F
´
enyes, D., N
´
emeth, B., and G
´
asp
´
ar, P. (2021). A novel
data-driven modeling and control design method for
autonomous vehicles. Energies, 14(2):517.
Guo, H., Li, W., Nejad, M., and Shen, C.-C. (2020). Proof-
of-event recording system for autonomous vehicles: A
blockchain-based solution. IEEE Access, 8:182776–
182786.
Guo, H., Meamari, E., and Shen, C.-C. (2018). Blockchain-
inspired event recording system for autonomous vehi-
cles. In 2018 1st IEEE international conference on
hot information-centric networking (HotICN), pages
218–222. IEEE.
Ilkov
´
a, V. and Ilka, A. (2017). Legal aspects of autonomous
vehicles—an overview. In 2017 21st international
conference on process control (PC), pages 428–433.
IEEE.
Koch, M., Wang, H., B
¨
urgel, R., and B
¨
ack, T. (2020). To-
wards data-driven services in vehicles. In VEHITS,
pages 45–52.
Kohler, W. J. and Colbert-Taylor, A. (2014). Current law
and potential legal issues pertaining to automated, au-
tonomous and connected vehicles. Santa Clara Com-
puter & High Tech. LJ, 31:99.
Lazar, P. A. and Shyam, V. (2018). Agile development of
automated driving system. Comput Internet Lawyer.
Ma, W. and Qian, S. (2021). High-resolution traffic sens-
ing with probe autonomous vehicles: A data-driven
approach. Sensors, 21(2):464.
Parsa, A. B., Shabanpour, R., Mohammadian, A., Auld,
J., and Stephens, T. (2021). A data-driven ap-
proach to characterize the impact of connected and
autonomous vehicles on traffic flow. Transportation
letters, 13(10):687–695.
Riehl, D. A. (2018). Car minus driver: autonomous vehi-
cles driving regulation, liability, and policy. Comput
Internet Lawyer, 35(5):1–18.
Saaristola, T. et al. (2022). Data collection system for au-
tonomous vehicles. Master’s thesis, Aalto University,
school of electrical engineering.
SAE J3016:202404 (2021). Taxonomy and definitions for
terms related to driving automation systems for on-
road motor vehicles. Standard, SAE International, US.
Zofka, M. R., Kuhnt, F., Kohlhaas, R., Rist, C., Schamm, T.,
and Z
¨
ollner, J. M. (2015). Data-driven simulation and
parametrization of traffic scenarios for the develop-
ment of advanced driver assistance systems. In 2015
18th International Conference on Information Fusion
(Fusion), pages 1422–1428.
Introducing Flowride® Logger, an Onboard Data Collection Framework for Commercial Automated Vehicles
495
