
A Proposal for Assessing Digital Maturity in French Primary
Education: Design of Tools and Methods
Christine Michel
1a
and Laëtitia Pierrot
2b
1
Techné, University of Poitiers, 1 rue Raymond Cantel, Poitiers, France
2
Cren, Avenue Olivier Messiaen, Le Mans University, Le Mans, France
Keywords: Digital Maturity, Technology Integration, Teachers’ Digital Practices.
Abstract: The aim of our work is to re-evaluate the concept of teacher digital maturity to make it more operational for
diagnosing technology adoption in education and supporting teachers' professional development in the use of
technology. To this end, our research adopted a three-pronged approach: 1) establishment of a theoretical
framework based on a critical analysis of existing digital maturity models, 2) development of MUME, a
unified model of teacher digital maturity based on professional development frameworks, and 3) design and
evaluation of a standardized self-report questionnaire to measure teacher digital maturity. This article presents
work in progress on the third axis. Using data from a survey of French primary school teachers in 2023, we
are comparing various measurement scales to come up with a new approach to diagnosing maturity, including
a new scale and new data analysis techniques. The validated questionnaire offers valuable insights into the
diversity and progression of uses, contributing to a better understanding of digital maturity and providing a
practical tool for assessing contemporary teaching practices.
1 INTRODUCTION
The growing digital transformation within education
has propelled it to the forefront of critical educational
issues (Antonietti et al., 2023). This is particularly
salient in the French context, driven by two key
factors: (1) the limited technology integration within
primary and secondary teacher practices (Tondeur et
al., 2008) and (2) the rapid development and societal
implementation of new technologies, posing
challenges for teacher appropriation.
Numerous initiatives, encompassing both initial
and in-service training and supported by institutional
actors, aim to empower teachers to achieve digital
maturity (defined as the ability to seamlessly integrate
technology into their practices) (Michel & Pierrot,
2023). However, both teachers and stakeholders
lament a lack of coordination between these efforts,
customization to individual needs, and transparency
regarding their impact on digital maturity.
To effectively address this lack of information
regarding teachers’ actual practices and foster
technological integration, European and international
a
https://orcid.org/0000-0003-3123-913X
b
https://orcid.org/0000-0003-1701-3783
educational institutions explore the utility of skills’
frameworks. DigCompEdu (Redecker, 2017) in
Europe and NETS-T (ISTE, 2017) in the Americas
enable the design of diagnostic tools and training
structures (Kimmons et al., 2020). This strategy
strives to establish a unified approach to directing
both initial and in-service teacher training.
A critical analysis of existing frameworks
(Michel & Pierrot, 2023) reveals their commendable
scope and inclusivity towards various usage
scenarios. However, substantial adaptation remains
necessary, particularly to incorporate the rapid
advance of emerging technologies. Notably, within
the K-12 context, the exploration of digital maturity
remains underdeveloped. While attempts to address
this gap exist (Francom, 2019), they primarily focus
on identifying hindering factors and levers, rarely
translating into concrete support guidelines for
teachers. The absence of a robust conceptual
framework within existing research further hinders
the identification of effective intervention strategies
for teacher development.
Michel, C. and Pierrot, L.
A Proposal for Assessing Digital Maturity in French Primary Education: Design of Tools and Methods.
DOI: 10.5220/0012740200003693
Paper published under CC license (CC BY-NC-ND 4.0)
In Proceedings of the 16th International Conference on Computer Supported Education (CSEDU 2024) - Volume 1, pages 569-577
ISBN: 978-989-758-697-2; ISSN: 2184-5026
Proceedings Copyright © 2024 by SCITEPRESS – Science and Technology Publications, Lda.
569

In a prior study (Michel & Pierrot, 2023), we
conducted a hermeneutic analysis of existing models
for technology integration and teacher digital
maturity in K-12 education. This analysis informed
the development of the MUME model, a unified
framework encompassing the individual,
organizational, and contextual dimensions
influencing technology adoption (Harrison et al.,
2014). The MUME model, with its non-use to
transformation maturity levels, is designed to assess
technology integration initiatives across various
scales, from large-scale district or regional efforts to
targeted support for smaller teacher groups. This
paper focuses on the latter application.
To evaluate our model, we investigated the digital
practices of K-12 teachers, specifically their use of
virtual learning environments (VLEs) and other
available digital tools. The subsequent section delves
into the literature on teacher digital uses and on the
models and tools used to analyze their maturity.
2 LITERATURE REVIEW
2.1 Teaching Practices and Technology
Existing research on technology integration
predominantly focuses on tool-driven impacts on
learning. However, a gap exists in the investigation of
actual teaching practices themselves. While studies
investigating into this domain often analyze the
pedagogical strategies employed (Lai & Bower,
2019), others emphasize the importance of
understanding how teachers leverage technology in
innovative combinations (Antonietti et al., 2023).
These novel uses are touted to exert a long-term
influence on teacher efficacy and responsibility
(Griful-Freixenet et al., 2021), while fostering
practices that promote student motivation and
success.
Virtual learning environments (VLEs) are a prime
area of exploration for teachers. In France, despite
VLEs deployment since 2006, research suggests use
remains confined to basic functionalities (Michel et
al., 2021). Among other things, teachers' negative
perceptions, such as feelings of inadequacy, lack of
professional meaning and time constraints,
particularly limit the use of these technologies.
Additionally, insufficient support and limited
visibility of usage further limit their adoption (Abel et
al., 2022).
2.2 Tools for Measuring Digital
Maturity
The investigation of teachers' technology use
encompasses various objectives, ranging from
generating descriptive accounts of their practices to
identifying and explaining the factors influencing
adoption, associated effects to usage, and even
modelling the dynamics of appropriation
(Taherdoost, 2018). While large-scale surveys
employing questionnaires provide representative
insights into population-level trends, their utility
primarily lies in generating descriptive studies or
models of appropriation (Schmidt et al., 2009).
Complementing these quantitative approaches,
qualitative case studies offer in-depth explorations of
specific technology usage (Hilton, 2016). However,
such singular perspectives inherently limit the scope
of inquiry, failing to fully capture the multifaceted
nature of technology integration in educational
contexts. This necessitates the development of
multidimensional classification methods that can
encompass a broader range of factors, including the
intended purpose of technology use, users’ skill
levels, perceived benefits and value, and the dynamic
evolution of usage over time.
While predominantly focusing on observational
studies of technology use, the educational research
literature offers several promising tools for measuring
digital maturity. The European Commission's
"SELFIE for Teachers" project (Redecker, 2017)
provides an online self-assessment tool
encompassing six key dimensions: pedagogy,
resources, assessment, collaboration, professional
development, and leadership. Powered by the
DigCompEdu skills repository, it guides schools in
crafting improvement roadmaps based on their self-
assessment results. Antonietti et al.'s ICAP-TS scale
(2023) focuses on evaluating teachers' technology
integration in the classroom, encompassing twelve
items that measure student and teacher digital
engagement across four cognitive levels. Drawing
upon the TPACK framework by Mishra and Koehler
(2006), the TPACK.xs scale (Schmid et al., 2020)
incorporates the contextual dimension of technology
use.
Despite their grounding in validated conceptual
models and the resulting ease of data interpretation,
the identified scales, like their underlying models,
exhibit limitations. They remain fragmented, failing
to encompass the full spectrum of teacher
professional activity, thereby hindering efforts to
provide generalized support (Michel & Pierrot,
2023). Additionally, their context-specific nature
CSEDU 2024 - 16th International Conference on Computer Supported Education
570

raises concerns regarding subjectivity and the
comparability of results across diverse settings
(Voogt et al., 2013).
3 METHODS
3.1 Dimensions and Items
To comprehensively assess the integration of
technology within teaching practices, we constructed
a multifaceted questionnaire (Table 1) drawing upon
two key sources: (1) validated measurement scales of
technology integration in teaching practices:
ICAP.TS (Antonietti et al., 2023); SELFIE (SELFIE,
2022) and TPACK.x (Schmid et al., 2020), (2)
targeted questions from previous research:
FreqNume, FreqENT (Michel & Pierrot, 2022).
Table 1: Questionnaire structure.
Question category Items
Socio-demographics
*Gender
*Age
*Seniority
*Level of Education
*Initial and Technology Training
VLE usage experience
*Technology use before the pandemic
*VLE use during the pandemic
Technology
knowledge and
representations
*General representations of the
usefulness of technology for education
(TPACK-XK and XK2)
*Knowledge of how technology is used
in educational contexts (TPACK-XK4)
*Digital Competences (DigCompEdu)
Uses
*Technology use frequency (FreqNume)
* VLE service frequency (FreqENT)
*Classroom usage (ICAP-UseEnclasse),
made up of two parts: ICAP-UseEns for
teacher usage and ICAP-UseElev for
student usage.
To ensure clarity and efficiency, we meticulously
translated and streamlined the initial scales while
eliminating redundancy across questions. This
resulted in a concise questionnaire of manageable
length. Additionally, the initial section gathers socio-
demographic data and inquiries about the VLE usage
experience, providing valuable contextual
information for analysis.
3.2 Validation Process
The validation process adhered to the established
guidelines outlined by Taherdoost (2016). Content
validation commenced with the evaluation of the
questionnaire by five subject-matter experts. Their
feedback served to refine the content and enhance its
overall validity. Additionally, Cronbach's alpha was
employed to gauge the questionnaire's internal
reliability, specifically assessing the inter-item
correlation. An alpha coefficient exceeding 0.70 was
targeted to ensure a robust level of internal
consistency.
3.3 Data Analysis Method
The core questionnaire, assessing technology
knowledge/representations (TPACK-XK, XK2,
XK4) and use (UseEnclasse, UseElev, UseEns,
FreqEnt, FreqNume), employed 6-point Likert scales
recoded for consistency: 0 (never/strongly disagree)
to 1 (strongly agree/agree almost daily) for Likert
scales and 0 (don't know how) to 4 (regularly
do/advise others) for DigCompEdu. This resulted in
quantitative data ranging from 0 to 1 and 0 to 4.
Subsequently, descriptive and multivariate
statistical techniques were applied to analyze the
collected data. K-means clustering, an unsupervised
learning algorithm, was used to classify responses for
each variable group. This method partitions
individuals into distinct, homogeneous clusters based
on distance to the cluster's centroid (Ahmed et al.,
2020). Smaller distances indicate greater individual
similarity to the cluster. Executed on XLstat, K-
means identified the central objects representing the
individuals closest to the barycenter of each cluster.
In coherence with the MUME model, the number of
clusters was set to 7. Based on this classification, we
characterized each cluster and defined maturity levels
for each variable group.
To explore deeper into the data, we employed
Principal Component Analysis (PCA), a technique
that reduces dimensionality by identifying the least
informative dimensions within the dataset. Reduction
is achieved by analyzing data correlations and
projecting them onto a matrix. This matrix is then
used to visualize axes (components) around which the
data resides. As the matrix is multidimensional,
multiple axes can be extracted, with the most
informative ones explaining up to two thirds of the
total information. By examining the cosine squared of
each variable with respect to each axis, we can
determine its relevance: a high value indicates a
significant contribution of the variable to that specific
axis (Jolliffe & Cadima, 2016).
3.4 Study Context
The CoAI – DATA SIM project seeks to develop
data-driven approaches and methods to empower
teachers in their individual adoption of digital
resources and foster more mature, collaborative
A Proposal for Assessing Digital Maturity in French Primary Education: Design of Tools and Methods
571
practices. This collaborative effort, involving various
educational stakeholders, is being piloted in the
French academic region of Paris.
In June 2023, we distributed an online
questionnaire to all teachers within the academy via
their VLE platform. The final analysis included
responses from 143 participants, comprising 86
primary school teachers and 18 secondary school
teachers. 39 individuals did not respond.
The sample demographics revealed a female
majority (101) compared to 22 male teachers; 20
individuals did not disclose their gender. Regarding
age, the most prominent group consisted of teachers
aged 41-50 (52), followed by those above 51 (43).
Individuals under 30 and between 31-40 represented
6 and 23 teachers, respectively; 13 participants did
not provide their age. Experience-wise, the majority
(88) possessed over 10 years of experience, while 23
had 3-10 years. Five teachers had less than 3 years,
and 8 belonged to the "Other" category; 19
individuals did not share their experience data.
To ensure data homogeneity, we focused on the
55 complete responses from primary school teachers,
the majority group in our survey. Additionally, we
confirm that sub-questionnaires have achieved
internal reliability with Cronbach's Alpha exceeding
0.70 (table 2).
Table 2: Sub-questionnaire reliability.
Variable groups Cronbach's Alpha
DigCompEdu 0,969
UseEnclasse 0,948
UseElev 0,959
UseEns 0,916
X
K
0,901
FreqENT 0,924
FreqNume 0,820
XK4 0,741
4 RESULTS
4.1 Different Maturity Level
Classifications
The processing approach for classifying maturity
levels is the same for all questionnaires. It is detailed
in section 4.1.1 only. All other analyses follow the
same methodology.
4.1.1 VLE Usage Questionnaire
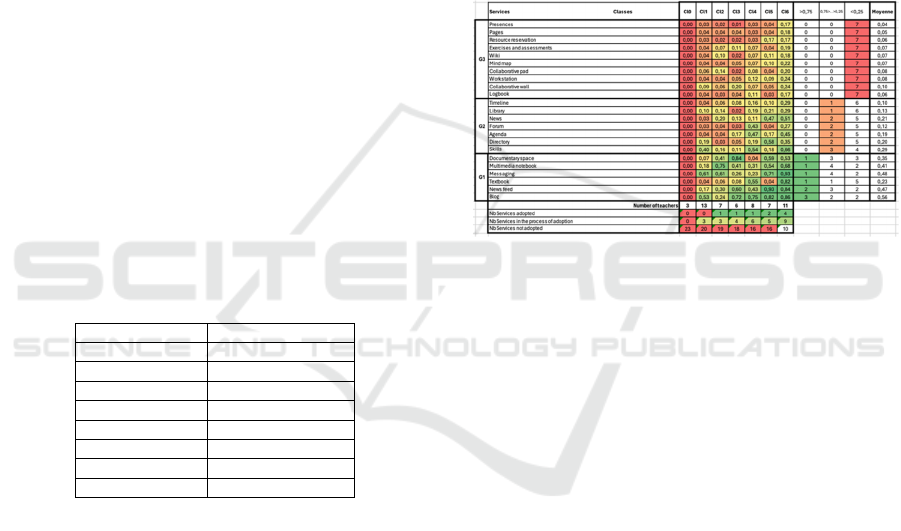
Table 3 details the average frequency of VLE service
use as classified by the K-means algorithm. The
questionnaire enquired teachers on the frequency of
using 23 specific VLE services for professional
activities. Details on response methods and
calculations are included in Table 3.
K-means clustering was employed to reduce data
dispersion, resulting in the identification of seven
distinct teacher profiles (classes). The "non-user"
class (Cl0) comprised three teachers with all service
usage values at 0, while the remaining 52 teachers
distributed across classes Cl1 to Cl6 displayed varied
usage patterns. This classification revealed distinct
behavioral trends: Cl1 exhibited infrequent service
use, while Cl6 demonstrated regular use and
exploration of all available services.
Table 3: Primary teacher classes by VLE use.
To investigate deeper into these dynamics, we
examined service adoption levels by teacher class.
Services with values exceeding 0.75 were considered
"adopted," while those below 0.25 were deemed "not
adopted." Intermediate values indicated services
undergoing adoption. This analysis identified three
service groups. 10 services (group G3) have hardly
been adopted by teachers. 8 services (group G2) are
in the process of being adopted. 6 services (group G1)
have been adopted by at least one class of teachers.
Interestingly, adopted services primarily served
communication objectives, while non-adopted
services were more closely aligned with
teaching/learning activities. Services undergoing
adoption tended to cater to mixed objectives.
Further analysis explored how each teacher class
(Cl1 to Cl6) adopts or rejects VLE services. Cl1
exhibited partial adoption of three services
(messaging, blog, and skills), indicating an emergent
stage with no established VLE practices. Conversely,
Cl2 adopted the multimedia notebook and pursued the
adoption of messaging, document space, and news
feed services. Interestingly, classes Cl2, Cl3, and Cl4
each adopted distinct service combinations
(multimedia notebook, document space, and blog).
Finally, Cl6 demonstrated the highest service
adoption (messaging, blog, news feed, and textbook)
with exploration of nine additional services.
CSEDU 2024 - 16th International Conference on Computer Supported Education
572
These findings highlight a diverse spectrum of
VLE adoption strategies among the identified teacher
classes. Examining the adopted and non-adopted
services within each class reveals distinct levels of
digital maturity.
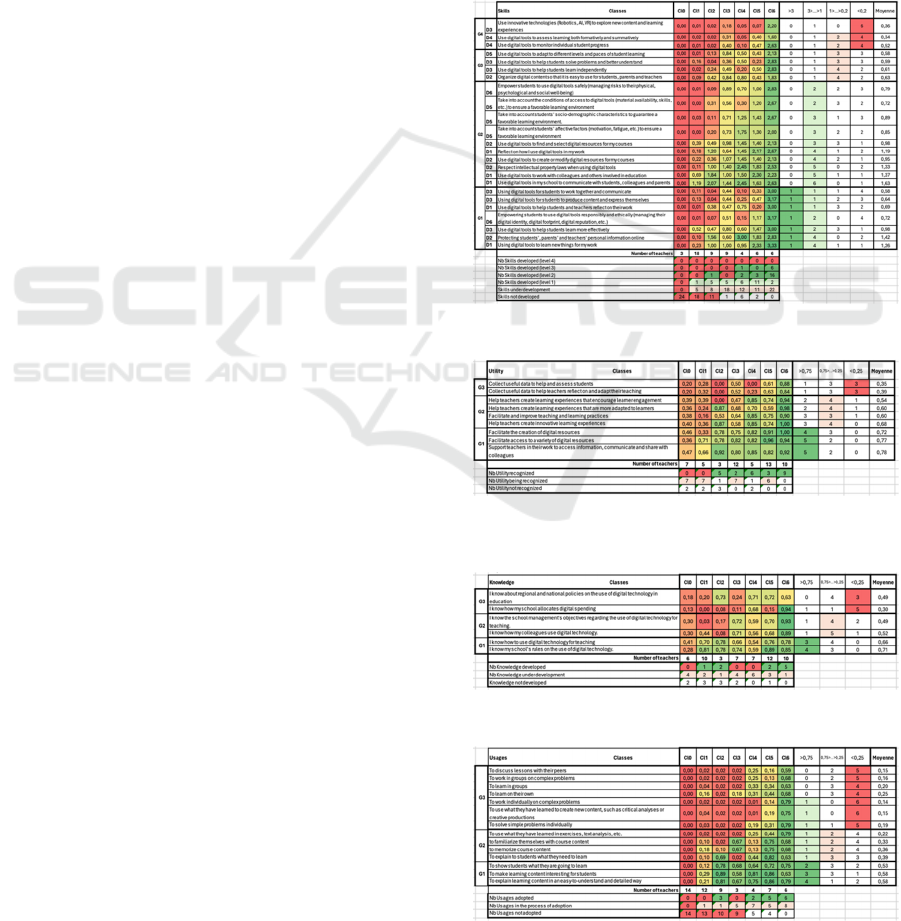
4.1.2 DigCompEdu
Questionnaire
Table 4 shows the average skill level according to the
DigCompEdu questionnaire adapted for our study.
The treatments are the same as above.
Most of these skills correspond to regular practice
(level 1) in at least one teacher's class. Group G1
corresponds to skills mastered at expertise level 3 in
at least one class, and at level 1 in many others: self-
training skills (D1), data protection (D2) or student
protection (D6), and the use of technology for certain
forms of pedagogy: collaboration, active learning and
efficiency gains (D3). Group 4 corresponds to the
most difficult skills to acquire, because 4 to 6 classes
have not developed them. They correspond to specific
pedagogies: problem-solving or experimentation
(D3), evaluation (D4), or adaptation/personalization
(D5). This structuring makes it possible to qualify
skills according to their level of difficulty in terms of
expertise: G1 being the simplest to develop, G4 the
most complex. We can assume that, over time, all
teachers will succeed in developing level 1 skills for
groups G1 and G2, but that they will have more
difficulty with groups G3 and G4.
4.1.3 TPACK Questionnaire
The mean values per class of teachers' representations
of the usefulness of technology for professional
practice (XK) are described in Table 5. Class mean
values for teachers' knowledge of technology use in
their professional context (XK4) are described in
Table 6.
4.1.4 ICAP
Questionnaire
Table 7 describes the average frequency of digital
classroom use by teachers, according to the ICAP
scale. The communication uses from the teachers to
the learners are adopted by almost all classes (group
G1). The collaborative learners centered uses (discuss
lessons, working in groups…) are not adopted (group
G3). The individual learners centered uses have been
adopted by one or two classes or are in the process of
being adopted.
4.1.5 Technology Usage Questionnaire
Table 8 shows the average frequency of use of digital
services by teachers according to the K-means
classification based on the FreqNum questionnaire.
The technologies adopted by almost all classes
(group G1) are the classic document production and
communication tools: Word, e-mail, search engines,
VLE (“ENT”) and other design tools. The tools not
adopted are serious games and online quiz design
applications. Other tools have been adopted by one or
two classes or are in the process of being adopted.
Table 4: Classes by DigCompEdu skills.
Table 5: Classes by utility representations (TPACK-XK).
Table 6: Classes by knowledge of the activity context
(TPACK-XK4).
Table 7: Primary teacher classes by ICAP use.
A Proposal for Assessing Digital Maturity in French Primary Education: Design of Tools and Methods
573
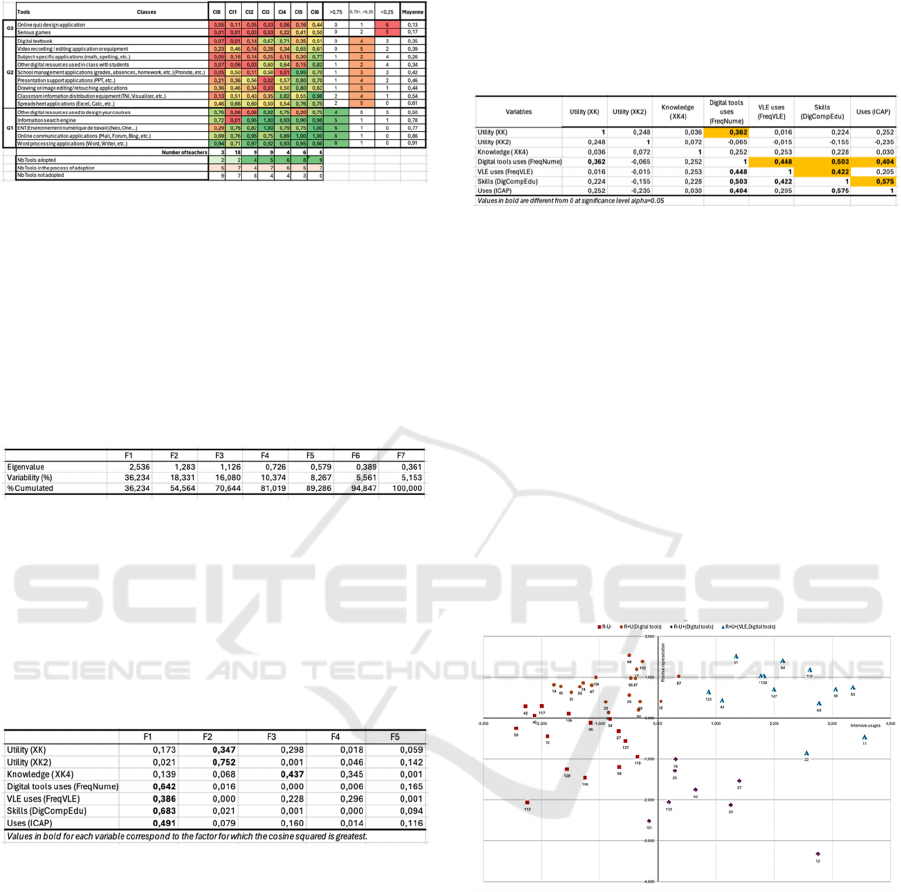
Table 8: Primary teacher classes by use of digital tools.
4.2 Comparing Classes
To compare all classifications, a Principal
Component Analysis (PCA) was conducted on the
different classifications obtained using the K-means
method for the six groups of variables. Table 9
presents the eigenvalue analysis, Table 10 the squared
cosine analysis, and Table 11 the correlation analysis.
Table 9: Eigenvalue Analysis.
The first two axes explain half of the information
(54%). The first four axes explain 81% of the
information.
The analysis of the squared cosines of the
variables (see Table 10) allows us to identify the
variables that are the most explanatory for the set of
constructed classes.
Table 10: Squared cosine analysis.
The most coherent and explanatory variables for
the classifications are those constructed from the
questionnaires: « DigCompEdu », « technology use
frequency », « ICAP uses » et « VLE use
frequency ». These variables explain 36% of the
information on the classes and are represented by
Axis F1. This axis represents the skills related to the
implementation of technology in classroom teaching
activities.
The second axis (F2) explains the classifications
based on « TPACK question on the perceived
usefulness of technology (XK2) » and to a lesser
extent « general knowledge about technology
(TPACK-XK) ». Axis F2 represents both
representations and general knowledge related to
technology. The knowledge about the general context
of the application of technology suggested in the
TPACK (XK4) contributes to a lesser extent in Axis
F3.
Table 11: Correlation analysis.
Correlation analysis (see Table 11) shows that the
DigCompEdu classification is significantly correlated
with the ICAP classification (0.575), the Frequency
of Use of Digital Tools classification (0.503), and the
Frequency of Use of VLE Services classification
(0.422). General knowledge about technology
(TPACK-XK) is significantly correlated with the
Frequency of Use of Digital Tools classification
(0.362). The Frequency of Use of Digital Tools and
VLE Services classifications are also correlated
(0.448).
A K-means clustering analysis was performed on
the classifications derived from the five methods
representatives of F1 and F2. This analysis allowed
us to classify teachers according to the intensity of
their use of technology (axis F1) and the types of
representations they have of technology.
Figure 1: Clustering of Teachers Based on PCA of K-means
Classes.
Four groups of teachers were identified (see
Figure 1). On the left (respectively right): teachers
who use technology to a limited extent (respectively
intensively). At the top (respectively bottom):
teachers who have positive (respectively negative)
representations of the value of technology in the
context of education.
It is a classic observation that representations
condition uses (for groups R-U- and R+U+), but that
they are not a condition for the realization of uses
(R+U-). On the other hand, we observe a group of
CSEDU 2024 - 16th International Conference on Computer Supported Education
574

teachers who have negative representations but
intensive uses (R-U+).
4.2.1 Respondents’ Profiles by Digital
Maturity Levels
An examination of each teacher group's composition
reveals that those with negative perceptions and
limited use (R-U-) demonstrate the lowest awareness
of mastering digital competencies (DigCompEdu).
This occurs despite their (marginal and restricted)
classroom utilization of digital tools (ICAP). Notably,
this group falls within the category of non-users of
digital tools (FreqNum Cl0 ranking). A representative
teacher from this group is a recent hire (less than 10
years' experience) who serves as the digital referent.
However, their work in kindergarten (medium and
large sections) might explain the limited student
exposure to digital tools in their classroom.
Teachers who hold positive views of technology
but exhibit limited use (R+U-) acknowledge its
various applications (variable XK). While they
occasionally employ digital tools beyond the VLE
(FreqNum), their classroom integration remains
restricted (ICAP). Similar to the previous group, these
teachers belong to the non-user’s category (FreqNum
Cl0 classification). A representative teacher from this
group has over 10 years of experience teaching
primary school. Despite participating in digital
education training and previously using digital tools
moderately in the classroom, her pandemic-era use
remained limited.
Teachers with negative perceptions but intensive
use (R-U+) perceive themselves as competent
(DigCompEdu) and recognize the benefits of digital
education (TPACK XK). However, they prioritize
other digital tools over the VLE, preferring to
maintain control over classroom technology use,
potentially hindering student engagement (ICAP).
This group primarily consists of teachers from the
FreqNum Cl2 class. A representative teacher from
this group has over 10 years of experience in
kindergarten. Before the pandemic, she was a regular
user of technology and had participated in relevant
training courses.
Finally, the group with the most positive
perceptions and intensive use (R+U+) considers
themselves digitally literate (TPACK DigCompEdu
and XK variables). They regularly integrate digital
tools into their own practices and those of their
students (ICAP). This group invests less heavily in
the VLE and comprises teachers from the FreqNum
Cl4 class. The representative teacher from this group
has over 10 years of experience working with Cycle
3 pupils. Her pre-pandemic use was moderate, and
she likely doesn't require frequent digital training due
to her high level of digital literacy.
5 DISCUSSIONS
Our study offers a multifaceted perspective on teacher
technology usage and integration. Employing a
multidimensional approach, we enlighten various
usage dynamics linked to teachers' immediate
contexts. Notably, technology use primarily aligns
with student interaction and self-training objectives,
reflecting teachers' prioritization of these purposes.
Further analysis reveals teachers' confidence in their
mastery of skills linked to professional commitment
(D1) and teaching and learning (D3). Comparing this
confidence with technology and VLE use frequency
reinforces this finding, as evidenced by the higher
utilization of general-purpose digital tools (office
automation, search engines, messaging) and
communication-oriented VLE services.
By leveraging corpus-based classifications, we
identified four distinct teacher profiles based on their
technology representations (R) and usage intensity
(U). Consistent with our findings, teacher digital
maturity manifests in more diverse technology use,
with highly engaged teachers exhibiting greater
versatility within the available VLE ecosystem.
Furthermore, our results echo existing research that
links higher self-reported digital competence
(DigCompEdu) and positive technology perceptions
(TPACK XK2) to increased use of available services,
particularly in classroom settings (Abel et al., 2022;
Francom, 2019; Tondeur et al., 2008).
These findings highlight key challenges for
professional development and teacher support
programs. Specialized software remains
underutilized and less prominent in teachers'
representations (Abel et al., 2022). Additionally,
limited confidence exists in D4 skills related to
assessment. These areas represent priorities for
targeted development efforts. Conversely, the
observed adoption of VLE services suggests a
promising maturation process. Specific support
measures should be explored to facilitate the further
integration of these practices.
This study successfully validated our unified
questionnaire-based approach for measuring teacher
digital maturity. Additionally, the proposed
multidimensional analysis approach demonstrated its
effectiveness in addressing the limitations often
associated with usage observation methods.
A Proposal for Assessing Digital Maturity in French Primary Education: Design of Tools and Methods
575

The current research acknowledges two
limitations. Firstly, the sample size was relatively
small. To address this, we plan to compare our
findings with a larger dataset of traces of VLE
activity. This will also mitigate the second limitation
concerning the self-reported nature of questionnaire
data.
6 CONCLUSION
This research explores the digital maturity of
teachers, a multidimensional concept encompassing
teachers' knowledge, skills, attitudes, and practices
towards technology. By identifying distinct teacher
profiles based on their perception of technology and
their usage patterns, we have gained new insights into
the importance of considering the immediate context
of teachers, as interaction with students and self-
training are driving forces in their use of technology.
Additionally, teachers' confidence in their digital
skills and their positive perception of technology
significantly influence the integration of technology
in the classroom.
Our results suggest that initial and continuous
training programs should focus on the use of
specialized tools and the strengthening of assessment
practices, while fostering a positive attitude towards
technology.
ACKNOWLEDGEMENTS
This work was done in collaboration with the
company EDIFICE and financed within the
framework of the CoAI-DataStim project (Academy
of Paris).
REFERENCES
Abel, V. R., Tondeur, J., & Sang, G. (2022). Teacher
Perceptions about ICT Integration into Classroom
Instruction. Educ. Sci., 12(9), Article 9.
https://doi.org/10.3390/educsci12090609
Ahmed, M., Seraj, R., & Islam, S. M. S. (2020). The k-
means Algorithm: A Comprehensive Survey and
Performance Evaluation. Electronics, 9(8), Article 8.
Antonietti, C., Schmitz, M.-L., Consoli, T., Cattaneo, A.,
Gonon, P., & Petko, D. (2023). Development and
validation of the ICAP Technology Scale to measure
how teachers integrate technology into learning
activities. Comput Educ, 192, 104648.
Francom, G. (2019). Barriers to technology integration: A
time-series survey study. JRTE, 52, 1–16.
Griful-Freixenet, J., Struyven, K., & Vantieghem, W.
(2021). Exploring pre-service teachers’ beliefs and
practices about two inclusive frameworks: Universal
Design for Learning and differentiated instruction.
TATE, 107.
Harrison, C. Tomás, C. & Crook, C. (2014). An e-maturity
analysis explains intention–behavior disjunctions in
technology adoption in UK schools. Comput Human
Behav, 34, 345‑351.
Hilton, J. (2016). A Case Study of the Application of
SAMR and TPACK for Reflection on Technology
Integration into Two Social Studies Classrooms. The
Social Studies, 107, 68–73.
ISTE. (2017). ISTE Standards for Educators. International
Society for Technology in Education. https://www.iste.
org/standards/iste-standards-for-teachers
Jolliffe, I. T., & Cadima, J. (2016). PCA: A review and
recent developments. Philos. Transact. A Math. Phys.
Eng. Sci, 374(2065), 20150202.
Kimmons, R., Graham, C. R., & West, R. E. (2020). The
PICRAT Model for Technology Integration in Teacher
Preparation. CITE, 20(1), 176–198.
Lai, J. W. M., & Bower, M. (2019). How is the use of
technology in education evaluated? A systematic
review. Comput Educ, 133, 27–42.
Michel, C., & Pierrot, L. (2022). Towards Modelling the
Technology Integration in Elementary School. A
Diachronic Study of Teachers’ Digital Practices During
and After Covid-19 Lockdown. In I. Hilliger, P. J.
Muñoz-Merino, T. De Laet, A. Ortega-Arranz, et al.
(Eds.), Educating for a New Future: Making Sense of
Technology-Enhanced Learning Adoption (pp. 201–
214). Springer International Publishing.
Michel, C., & Pierrot, L. (2023). Modelling Teachers’
Digital Maturity: Literature Review and Proposal for a
Unified Model. Proceedings of the 15th International
Conference CSEDU, 535–542.
Michel, C., Pierrot, L., & Solari-Landa, M. (2021). VLE
Limits and Perspectives for Digital Integration in
Teaching Practices. In T. De Laet, R. Klemke, C.
Alario-Hoyos, I. Hilliger, & A. Ortega-Arranz (Eds.),
Technology-Enhanced Learning for a Free, Safe, and
Sustainable World (pp. 96–109). Springer International
Publishing.
Mishra, P., & Koehler, M. J. (2006). TPACK: A
Framework for Teacher Knowledge. Teach. Coll. Rec.,
108(6), 1017–1054.
Redecker, C. (2017). European Framework for the Digital
Competence of Educators: DigCompEdu. Publications
Office of the EU.
Schmid, M., Brianza, E., & Petko, D. (2020). Developing a
short assessment instrument for Technological
Pedagogical Content Knowledge (TPACK.xs) and
comparing the factor structure of an integrative and a
transformative model. Comput Educ, 157, 103967.
Schmidt, D. A., Baran, E., Thompson, A. D., Mishra, P.,
Koehler, M. J., & Shin, T. S. (2009). TPACK: The
CSEDU 2024 - 16th International Conference on Computer Supported Education
576

Development and Validation of an Assessment
Instrument for Preservice Teachers. JRTE, 42(2), 27.
SELFIE. (2022). SELFIE Questionnaire—Discover the
digital potential of your school. European Commission.
https://education.ec.europa.eu/sites/default/files/2022-
07/SELFIE_Questionnaires_EN.pdf
Taherdoost, H. (2016). Validity and Reliability of the
Research Instrument; How to Test the Validation of a
Questionnaire/Survey in a Research. IJARM, 5, 28–36.
Taherdoost, H. (2018). A review of technology acceptance
and adoption models and theories. Procedia Manuf., 22,
960–967.
Tondeur, J., Hermans, R., van Braak, J., & Valcke, M.
(2008). Exploring the link between teachers’
educational belief profiles and different types of
computers use in the classroom. Comput Human Behav,
24(6), 2541–2553.
Voogt, J., Fisser, P., Pareja Roblin, N., Tondeur, J., & van
Braak, J. (2013). TPACK – a review of the literature. J.
Comput. Assist. Learn., 29(2), 109–121.
A Proposal for Assessing Digital Maturity in French Primary Education: Design of Tools and Methods
577
