
Leveraging NLP and Machine Learning for English (L1) Writing
Assessment in Developmental Education
Miguel Da Corte
1,2 a
and Jorge Baptista
1,2 b
1
University of Algarve, Faro, Portugal
2
INESC-ID Lisboa, Lisbon, Portugal
Keywords:
Developmental Education (DevEd), Automatic Writing Assessment Systems, Natural Language Processing
(NLP), Machine-Learning Models.
Abstract:
This study investigates using machine learning and linguistic features to predict placements in Developmental
Education (DevEd) courses based on English (L1) writing proficiency. Placement in these courses is often
performed using systems like ACCUPLACER, which automatically assesses and scores standardized writing
assignments in entrance exams. Literature on ACCUPLACER’s assessment methods and the features accounted
for in the scoring process is scarce. To identify the linguistic features important for placement decisions, 100
essays were randomly selected and analyzed from a pool of essays written by 290 native speakers. A total
of 457 Linguistic attributes were extracted using COH-METRIX (106), the Common Text Analysis Platform
(CTAP) (330), plus 21 DevEd-specific features produced by the manual annotation of the corpus. Using the
ORANGE Text Mining toolkit, several supervised Machine-learning (ML) experiments with two classification
scenarios (full and split sample essays) were conducted to determine the best linguistic features and best-
performing ML algorithm. Results revealed that the Naive Bayes, with a selection of the 30 highest-ranking
features (21 CTAP, 7 COH-METRIX, 2 DevEd-specific) based on the Information Gain scoring method,
achieved a classification accuracy (CA) of 77.3%, improving to 81.8% with 60 features. This approach sur-
passed the baseline accuracy of 72.7% for the full essay scenario, demonstrating enhanced placement accuracy
and providing new insights into students’ linguistic skills in DevEd.
1 INTRODUCTION AND
OBJECTIVES
Developmental Education (DevEd) course models
have been implemented in higher education institu-
tions in the United States as a path for students to
improve their literacy skills. Upon successfully com-
pleting these courses, students are deemed proficient
in reading and writing and become eligible to partic-
ipate in an academic program leading to a degree or
certificate (Cormier and Bickerstaff, 2019).
Despite the significant role of DevEd, the efficacy
of student placement methods, predominantly reliant
on standardized entrance assessments such as ACCU-
a
https://orcid.org/0000-0001-8782-8377
b
https://orcid.org/0000-0003-4603-4364
PLACER
1
, COMPASS
2
, and ACT
3
, have played a key
role in the expansion and reform of DevEd, not only
in the United States (King et al., 2017; Kafka, 2018;
Zachry Rutschow et al., 2021), but also worldwide
(Qian et al., 2020). Studies suggest that these exams
misplace, on average, 40% of college-intending stu-
dents, with a poor correlation between test scores and
future college success (Hassel and Giordano, 2015).
At Tulsa Community College (TCC)
4
, ACCU-
PLACER is the primary tool for assessing incoming
students’ writing proficiency in English (L1). The
entrance exam includes the completion of a short es-
say (300-600 words) on topics like One’s Ability to
Change or Learning Practical Skills. Following the
submission of students’ written productions, ACCU-
PLACER automatically evaluates and categorizes each
1
https://www.accuplacer.org/ (last access: April 5,
2024; all URL in this paper were checked on this date.)
2
https://www.compassprep.com/practice-tests/
3
https://www.act.org
4
https://www.tulsacc.edu/
128
Da Corte, M. and Baptista, J.
Leveraging NLP and Machine Learning for English (L1) Writing Assessment in Developmental Education.
DOI: 10.5220/0012740500003693
Paper published under CC license (CC BY-NC-ND 4.0)
In Proceedings of the 16th International Conference on Computer Supported Education (CSEDU 2024) - Volume 2, pages 128-140
ISBN: 978-989-758-697-2; ISSN: 2184-5026
Proceedings Copyright © 2024 by SCITEPRESS – Science and Technology Publications, Lda.

essay into a specific tier: DevEd-Level 1, DevEd-
Level 2, or College-Level. Every year, over 43% of
new students are determined to need a minimum of
one DevEd course at this institution based on data re-
ported by its Institutional Research, Reporting, & An-
alytics department.
5
For this study, the levels were operationalized as
follows: DevEd-Level 1: text indicated that develop-
ment is needed in the overall use of the English lan-
guage: grammar, spelling, punctuation, and sentence
and paragraph structure. DevEd-Level 2: text indi-
cated that support is needed in specific areas of the
English language, e.g., sentence structure, punctua-
tion, editing, and revising. College-Level: text indi-
cated no need for DevEd.
According to The College Board (2022), auto-
matic placement is based on 6 broad linguistic de-
scriptors: (i) Purpose and Focus; (ii) Organization
and Structure; (iii) Development and Support; (iv)
Sentence Variety and Style; (v) Mechanical Conven-
tions; and (vi) Critical Thinking.
The system’s manual definitions of these descrip-
tors (The College Board, 2022) are arguably too ab-
stract (and limited), posing challenges not only to the
automatic extraction and assessment of relevant fea-
tures from texts but also for human annotators to ac-
curately replicate these nuanced intuitions (Da Corte
and Baptista, 2024b). Hence, there is a pressing
need for a detailed linguistic analysis customized for
DevEd, serving as the key motivation for this study.
This study uses NLP tools and Machine-learning
(ML) algorithms to assess the effectiveness of vari-
ous linguistic features sourced from well-known plat-
forms like COH-METRIX and CTAP in a task that
classifies texts by proficiency level for student place-
ment in two-level DevEd courses. The research fo-
cuses on identifying optimal predictors, feature com-
binations, and algorithms to enhance placement accu-
racy (Santos et al., 2021), aiming to improve educa-
tional outcomes. By fine-tuning the placement pro-
cess, more equitable opportunities for linguistically
underprepared students can be available, thus reduc-
ing educational disparities and supporting fair access
to college education (Beaulac and Rosenthal, 2019;
Goudas, 2020; Qian et al., 2020).
In view of the limitations and motivations, this
study’s objectives are twofold: (i) to refine the identi-
fication of linguistic features critical for DevEd place-
ment decisions, and (ii) to enhance students’ L1 writ-
ing proficiency assessment within DevEd.
5
https://www.tulsacc.edu/about-tcc/institutional-resea
rch
2 RELATED WORK
Research on enhancing student placement in DevEd
courses, particularly for L1 English speakers, has
focused on improving classification accuracy (CA)
through lexical and syntactic pattern analysis, lever-
aging Text Mining techniques (Da Corte and Baptista,
2024a).
Pal and Pal (2013) employed the WEKA
Machine-learning (ML) platform to classify students
into appropriate courses using Naive Bayes, Multi-
layer Perceptron, and Tree models, achieving a CA
of 86.15% and benefiting placement accuracy. Simi-
larly, Filighera et al. (2019) utilized Neural Networks
and embeddings to classify texts into 5 reading levels,
achieving an accuracy of 81.3% through 5-fold cross-
validation.
Using ML, Bujang et al. (2021) developed a mul-
ticlass prediction model for course grades, achiev-
ing 99.5% accuracy with Random Forest, facil-
itated by Synthetic Minority Oversampling Tech-
nique (SMOTE) (Chawla et al., 2002). Crossley
et al. (2017) analyzed STEM student essays, identi-
fying text variations across disciplines and suggest-
ing subject-specific teaching approaches for DevEd.
Subsequent studies like Crossley (2020) emphasized
lexical sophistication and syntactic complexity for
automatic assessment. Nazzal et al. (2020) advo-
cated for integrating ML with linguistic data in non-
standardized assessments to enhance student place-
ment in DevEd.
NLP tools like COH-METRIX
6
(McNamara et al.,
2006) and CTAP
7
(Chen and Meurers, 2016) have
been pivotal in analyzing linguistic complexity across
languages. Leal et al. (2023) adapted cohesion and
coherence metrics from Coh-Metrix English to Coh-
Metrix (Brazilian) Portuguese, while Okinina et al.
(2020) extended CTAP measures to Italian. Akef
et al. (2023) used CTAP to assess language profi-
ciency in Portuguese, achieving 76% CA, and high-
lighted feature selection’s role in refining analysis.
Recent work by Wilkens et al. (2022) emphasized lex-
ical diversity and dependency counts in French lan-
guage development assessment.
Identifying more descriptive linguistic features
and incorporating them into systems like ACCU-
PLACER, leveraging NLP and ML algorithms, could
enhance skill-level classification, laying the ground-
work for this study. This research builds on previ-
ous studies that outline a framework for assessing stu-
dents’ linguistic skills, focusing on how outcomes de-
6
http://141.225.61.35/CohMetrix2017/
7
http://sifnos.sfs.uni-tuebingen.de/ctap/
Leveraging NLP and Machine Learning for English (L1) Writing Assessment in Developmental Education
129

termine their course placement and participation in an
academic program.
3 METHODS
3.1 Corpus
From a pool of essays written by 290 native speak-
ers enrolled in DevEd courses, 100 essays were ran-
domly selected, ensuring a balanced representation
across the two DevEd levels. These essays were pro-
duced at the institution’s monitored testing center dur-
ing the 2021-2022 academic year. Essays were writ-
ten without time constraints or the ability to use edit-
ing tools. Despite the modest sample size, it estab-
lishes the groundwork for a corpus aimed at docu-
menting the linguistic variety among community col-
lege students as they commence their higher educa-
tion journey.
The samples were extracted from the institution’s
standardized entrance exam database in plain text for-
mat. This process followed the Institution’s Review
Board (IRB)
8
approved protocols, with the identifier
#22-05, focusing on educationally disadvantaged in-
dividuals, meeting stringent ethical standards. The
main metadata indicated the students’ DevEd place-
ment level as assigned by ACCUPLACER. At this
point, additional metadata, such as demographics (in-
cluding gender and race), was not considered.
As presented in Table 1, sample text units were
balanced by level but varied in length (number of to-
kens per text), making the corpus quite unbalanced
concerning this metric. A custom Python function
from Python’s standard libraries was used to tokenize
the texts. Punctuation signs were kept as tokens, as
punctuation is a potentially good predictor of how
proficiently students write at the onset of develop-
ing their academic writing skills. No text transfor-
mation was used since the upper/lower case distinc-
tion may be relevant to model students’ behavior in
DevEd courses, as they do not utilize capitalization
consistently when writing for academic purposes.
Table 1: Original corpus characteristics.
Corpus Total
Tokens 27,916
Average tokens per text 279
Maximum number of tokens in a text 422
Minimum number of tokens in a text 95
To address the length issue, the sampling units
were split into segments of 100 words. All sampling
8
https://www.tulsacc.edu/
units below this threshold were discarded. The result
was 94 units from Level 1 and 119 from Level 2. To
achieve a balanced corpus across levels, 25 units from
Level 2 were excluded through random resampling,
resulting in an equal count of 94 units from each level
for this analysis.
Results of this trimming process are summarized
in Table 2.
9
Table 2: Corpus characteristics after splitting the text sam-
ple units.
Split Sample Text Units
Level 1 141
Level 2 199
Total 340
Text units discarded - Level 1 47
Text units discarded - Level 2 80
Total split samples discarded 127
Total balanced split samples for both levels 188
3.2 Linguistic Features
A total of 436 linguistic features were extracted from
the analyzed sample text units utilizing two distinct
analytical tools, COH-METRIX and CTAP, with these
features grouped into cluster categories as detailed in
Table 3. Specifically, the distribution of these features
across the tools is as follows: the COH-METRIX tool
accounted for 106 of these features, while CTAP ac-
counted for the remaining 330 features. A detailed
description of these features can be found in the doc-
umentation of these tools.
These features were supplemented with DevEd-
specific (DES) features
10
obtained by the manual an-
notation of the corpus. In their majority, DES features
include features that signal errors and indicate a devi-
ation from proficiency standards; a few reveal patterns
that signal proficiency.
The annotation proper of DES features was con-
ducted by two qualified, trained annotators who em-
ployed an annotation scheme developed by the au-
thors of this paper (Da Corte and Baptista, 2024a).
The 21 most salient features utilized, distributed
across 4 textual patterns (feature clusters), are briefly
mentioned in Table 4.
To assess the reliability of the annotations, the
Krippendorff’s Alpha (K-alpha) interrater reliability
coefficient was calculated, obtaining a moderate score
of k=0.40 (Da Corte and Baptista, 2024a). Given the
intricate nature and complexity of the annotation task,
this score was considered adequate. Based on this as-
9
The potential bias from the assumed independence of
segments in the study was recognized, with the decision to
defer addressing it made at this point.
10
https://gitlab.hlt.inesc-id.pt/u000803/deved/
CSEDU 2024 - 16th International Conference on Computer Supported Education
130

Table 3: Feature cluster categories: COH-METRIX & CTAP.
COH-METRIX CTAP
Patterns Feature Clusters Feature Clusters
Lexical Descriptive (e.g., number of tokens) (DESC) Descriptive (e.g., number of tokens) (DESC)
Connectives (CONNECT) Lexical Density (LEXDENS)
Lexical Richness (LEXRICH)
Lexical Sophistication (LEXSOPH)
Lexical Variation (LEXVAR)
Syntactic Syntactic Complexity (SYNTCOMPLX) Syntactic Complexity (SYNTCOMPLX)
Syntactic Pattern Density (SYNTPATTERNDENS) Number of Syntactic Constituents (NUMSYNTCONST)
Word Information (WORDINFO) Number of POS (NUMPOS)
POS Density (POSDENS)
Referential Cohesion (REFCOH) Referential Cohesion (REFCOH)
Discursive Situation Model (SITMODEL) -
Latent Semantic Analysis (LATSEMANALYSIS)
Text Easability (TXTEASA)
Readability Readability (e.g., Flesch Kincaid Grade Level) (READ) -
sessment, a consensual annotation was reached, ulti-
mately retaining 6,495 tags for analysis. All of the
tags were systematically accounted for using Python
code.
While some of these features partially overlap
with those extracted by COH-METRIX and CTAP,
others constitute novel contributions to the profi-
ciency assessment field. For example, Fictional You
(rhetoric, generic representation of a person, using
the pronoun you) and Fictional We (a similar device,
but using the pronoun we). Multiword expressions
(MWE) is another example and was previously in-
vestigated in Da Corte and Baptista (2022), which,
along with other studies (Laporte, 2018; Kochmar
et al., 2020; Pasquer et al., 2020) confirmed that us-
ing MWE as lexical features can improve the CA of
students in DevEd.
3.3 Experimental Design
Several supervised ML experiments were conducted
as part of this study, construed as a classification task,
to determine: (i) a selection of the best linguistic fea-
tures for the task; and (ii) the best-performing ML
algorithm. A hardware configuration comprising an
11th Gen Intel(R) Core(TM) i7-1165G7 CPU with a
base clock speed of 2.80GHz, complemented by 8.00
GB of RAM, operating on a 64-bit system with an
x64-based processor, was used.
The data mining tool ORANGE (Dem
ˇ
sar et al.,
2013)
11
was selected for analysis and modeling for its
usability and the diversity of ML tools and algorithms
it makes available. A total of 10 ML algorithms were
selected from the set available in ORANGE (in alpha-
betical order): (i) Adaptive Boosting (AdaBoost); (ii)
CN2 Rule Induction (CN2); (iii) Decision Tree (DT)
(iv) Gradient Boosting (GB); (v) k-Nearest Neigh-
11
https://orangedatamining.com/
bors (kNN); (vi) Logistic Regression (LR); (vii) Naive
Bayes (NB); (viii) Neural Network (NN); (ix) Ran-
dom Forest (RF); and (x) Support Vector Machine
(SVM). The default configuration of these learners
was selected. Figure 1 shows the basic workflow
adopted for this study.
For the training step and to assess the models, the
TEST&SCORE widget was used. Models were as-
sessed using the Classification Accuracy (CA) as the
primary evaluation metric, which closely aligns with
the task at hand. Precision (Prec) was used as a sec-
ondary method to rank the models in the event of ex
aequo CA values. Given the corpus size, the data
was automatically partitioned (DATA SAMPLER) for
a 3-fold cross-validation, leaving 2/3 of the corpus for
training and 1/3 for testing purposes. The RANK wid-
get was used to assess the discriminative value of each
feature for the task. A Confusion Matrix also allowed
for a detailed inspection of the results.
Two classification scenarios were devised to as-
sess the impact of text length on the task:
Scenario 1, involves the initial set of full (F) 100
text samples, in their original form, with different text
sizes (spanning from 95 to 422 words), and balanced
for placement level.
Scenario 2, involves samples split (S) into fragments
of 100 words each and then resampled to keep the
placement level balanced, as mentioned in Subsection
3.1 and shown in Table 2.
For scenario 2, a new dataset was produced to cor-
respond to the contents of the split essay fragments.
The CTAP and COH-METRIX platforms had to be
rerun on this new dataset, while the DES features had
to be retrieved again.
For each scenario, four experiments were carried
out:
Experiment 1, where sample text units were classi-
fied using the entire feature sets from COH-METRIX,
CTAP, and DES. Due to the availability of compara-
Leveraging NLP and Machine Learning for English (L1) Writing Assessment in Developmental Education
131
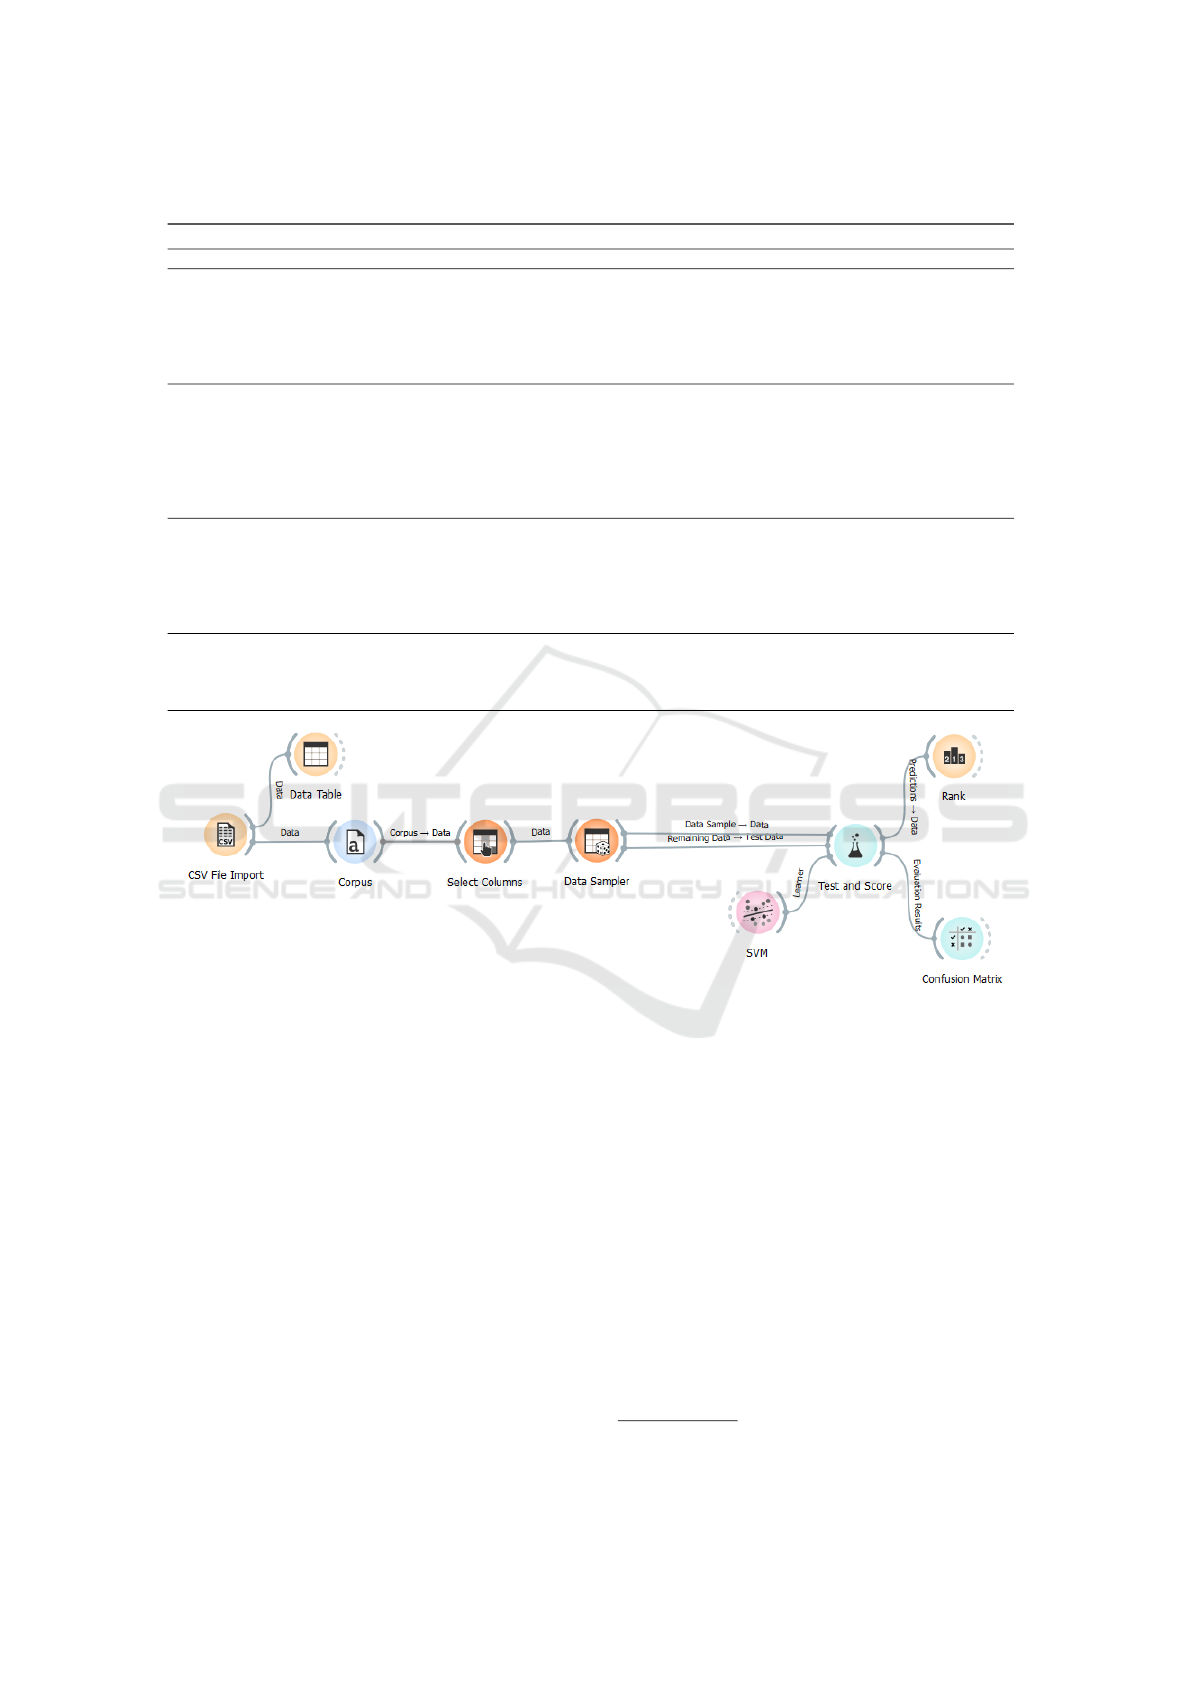
Table 4: DevEd-specific (DES) features summary.
DevED-Specific (DES) Features
Patterns Description Feature Clusters
Orthographic (ORT)
Patterns representing the foundational language skills
needed to represent words and phrases.
Grapheme (addition, omission,
transposition, and capitalization)
Word split
Word boundary merged
Punctuation used
Contractions
Word omitted
Grammatical (GRAMM) Patterns evidencing the quality of text production. Word added
Word repetition
Verb tense
Verb disagreement
Verb form
Pronoun-alternation referential
Lexical & Semantic (LEXSEM)
Patterns contributing to the structuring
of a writer’s discourse.
Slang
Multiword expressions (MWE)
Word precision
Mischosen preposition
Connectives
Discursive (DISC) Patterns exhibiting the writer’s Fictional ‘we’
ability to produce extended discourse. Fictional ‘you’
Argumentation with reason
Argumentation with example
Figure 1: ORANGE workflow setup. The SVM algorithm is displayed merely as a representative of the chosen learners.
ble data, this experiment serves as the baseline for the
3 next experiments.
Experiment 2, classified the text samples based on
the top 11 more discriminative features, as indicated
by the RANK widget for each feature set; two ranking
measures were compared: the Information Gain and
Chi-square (χ
2
) scoring methods.
Experiment 3, using a one-out approach, the clas-
sification involved removing one feature cluster at a
time. These clusters have been presented in Tables 3
and 4. The goal here was to measure the magnitude of
the decrease in the CA of the ML algorithms. For the
analysis of the results, the following guiding principle
was adopted: the larger the decrease, the greater the
significance of the feature cluster.
Experiment 4, consisted in classifying the text sam-
ple units by aggregating features from the three dis-
tinct sets (COH-METRIX, CTAP, and DES) and sub-
sequently identifying the most discriminative ones us-
ing the Information Gain ranking method, which is a
common method used for feature selection.
4 RESULTS
The results from Experiments 1 through 4 are detailed
in this section, providing a comparison of classifica-
tion accuracies across different experimental setups
and feature analysis methods. The dataset with the re-
spective scores (ratios) for all 457 linguistic features
mentioned in Section 3.2 can be found on Da Corte
and Baptista (2024c).
12
12
https://gitlab.hlt.inesc-id.pt/u000803/deved/
CSEDU 2024 - 16th International Conference on Computer Supported Education
132

Experiment 1
Table 5 presents the CA scores of the 10 different ML
models introduced in Section 3.3, applied to both full
(F) and split (S) scenarios and utilizing using differ-
ent feature sets (COH-METRIX, CTAP, and DES).
Notably, for COH-METRIX, GB and LR achieved the
highest CA scores for F (0.697) and S (0.616) scenar-
ios, respectively. With the CTAP feature set, RF out-
performed COH-METRIX for the F scenario, yielding
a CA of 0.727, whereas NN was the best-performing
learning algorithm in the S scenario with a CA of
0.624. Using the DES feature set, CN2 and NB per-
formed comparatively to the classification scores ob-
tained with COH-METRIX, achieving accuracies of
0.652 (CN2) for the full scenario and 0.640 (NB) for
split samples. Regarding the S scenario, the NB with
the DES feature set achieved the highest CA score.
As previously mentioned, this experiment estab-
lishes the baseline for this study, aiming to enhance
the CA beyond the 0.727 benchmark set by RF (in
the F scenario). This benchmark is relatively high
and correlates to the fact that RF is often recognized
for its efficacy in ML applications, particularly in the
context of writing analysis (Huang, 2023).
Experiment 2
Two feature ranking methods, Information Gain and
χ
2
, were used to identify the top 11 best-performing
features. The two ranking methods produced very dif-
ferent results. To quantify this discrepancy between
the ranking methods, the Spearman Rank Correlation
coefficient was calculated, which resulted in a mod-
erate correlation (Schober et al., 2018) score of ρ =
0.575. In general, the top 11 features selected using
Information Gain yielded better CA results for most
models and in both scenarios than those produced by
χ
2
, and thus, chosen for feature selection. Due to
space limitations, these results are not presented here.
The outcome of this selection process is detailed in
Table 6. For each feature source, specifically COH-
METRIX and CTAP, the descriptions provided by the
respective feature extraction platforms were utilized.
Table 7 presents the differences in CA values be-
tween Experiment 2 and Experiment 1 (baseline) for
F and S scenarios. Positive values indicate an increase
in CA (from the baseline), while negative values (-)
indicate a decrease. The largest increase per ML al-
gorithm’s CA based on COH-METRIX, CTAP, and
DES feature sets is in bold, while the largest decrease
is italicized.
A notable increase in CA of nearly 14% is ob-
served for the NB and GB models on the full sce-
nario. This improvement was achieved by employing
only the top 11 features identified through Informa-
tion Gain from the COH-METRIX and CTAP feature
sets. In contrast, with the DES feature set, the in-
crease in accuracy in the full scenario was compar-
atively smaller, at 6.1% for DT, which is less than
half of the improvement observed with the previous
models. In the S scenario, NB demonstrated a 16%
accuracy increase with CTAP features, likely due to
the uniform size of text sample units. This model
also showed nearly a 10% improvement with COH-
METRIX features. Meanwhile, GB exhibited a more
modest increase of 4.8% with the DES feature set.
The largest performance decline was observed
with the kNN model for both F and S scenarios, show-
ing decreases of 7.6% and 7.2%, respectively, when
employing the top 11 COH-METRIX features. When
the top CTAP features were used, the LR model’s ac-
curacy slightly decreased by less than 5% for the full
scenario. However, in the S scenario, the performance
across all models increased. For the DES features, GB
and NN experienced a decline of 6.1% (F) and 6.4%
(S), respectively.
Results, as presented in Table 7, indicate that fea-
ture selection generally enhances the performance of
the models, with the exception of DES when applied
to the full scenario. However, based on the informa-
tion included in Table 6, what can be inferred from
the selected features from each feature set is very lim-
ited, as they correspond to very disparate properties,
e.g., Sentence length, number of words, mean; Flesch
Reading Ease; Number of tokens; Number of POS
feature: existential there tokens; Mischosen preposi-
tion; MWE. To gain a better insight into the predictive
impact of these feature sets, they were clustered by
types, which is the purpose of Experiment 3.
Experiment 3
In this experiment, features were clustered by type
(within their respective platform), and each cluster
was sequentially removed. The models tested, along
with their ORANGE configuration, remained as intro-
duced initially and presented in Figure 1. To inter-
pret the results, positive values in the classification
experiment denote an improved CA when the cluster
is removed, while negative values indicate a hindered
classification. The aim is to pinpoint the most crucial
feature clusters for the task, particularly focusing on
those whose removal significantly impacts classifica-
tion. The largest decrease in CA per ML algorithm
is highlighted in bold, while the largest decrease per
cluster is italicized.
COH-METRIX
First, Table 8 presents the changes in CA values
for the full (F) and split (S) scenarios, as com-
Leveraging NLP and Machine Learning for English (L1) Writing Assessment in Developmental Education
133

Table 5: Experiment 1: Classification Accuracy (CA): full (F) vs. split (S) scenarios using COH-METRIX, CTAP, and DES
features.
Features COH-METRIX CTAP DES
Model CA (F) CA (S) CA (F) CA (S) CA (F) CA (S)
AdaBoost 0.621 0.560 0.606 0.560 0.455 0.576
CN2 0.667 0.584 0.591 0.560 0.652 0.520
DT 0.606 0.568 0.606 0.504 0.515 0.616
GB 0.697 0.584 0.545 0.528 0.561 0.592
kNN 0.682 0.592 0.621 0.504 0.576 0.560
LR 0.652 0.616 0.652 0.568 0.561 0.464
NB 0.652 0.576 0.712 0.552 0.591 0.640
NN 0.636 0.560 0.606 0.624 0.515 0.632
RF 0.652 0.560 0.727 0.512 0.530 0.632
SVM 0.576 0.576 0.712 0.544 0.561 0.552
Table 6: Experiment 2: Top 11-ranked features, per feature source, ranked by Information Gain method.
COH-METRIX CTAP DES
Sentence length, number of words,
¯
X Lexical sophistication: easy word types (NGSL) Argumentation with example
Flesch-Kincaid grade level Syntactic complexity feature: prepositional phrases per sentence Word omitted
Left embeddedness, words before main verb,
¯
X Number of word types with more than 2 syllables Mischosen preposition
Word count, number of words Number of tokens Word precision
Flesch Reading Ease Number of tokens with more than 2 syllables Grapheme
Negative connectives incidence Number of POS feature: adverb lemma types Word repetition
Paragraph length, number of sentences in a paragraph, σ Number of POS feature: existential there tokens Verb disagreement
Sentence syntax similarity, all combinations, across paragraphs,
¯
X Lexical sophistication: easy lexical types (NGSL) Multiword Expressions
Lexical diversity, type-token ratio, content word lemmas Lexical sophistication: easy lexical tokens (NGSL) Argumentation with reason
Text easability PC syntactic simplicity, z score Number of POS feature: preposition types Pronoun-alternation referential
Text Easability PC Syntactic simplicity, percentile Number of syntactic constituents: postnominal noun modifier Punctuation used
Table 7: Experiment 2: Classification Accuracy (CA) differences from baseline (Experiment 1) for full (F) vs. split (S)
scenarios using top 11 features ranked by Information Gain. Baseline: 0.727 (F) and 0.640 (S).
Features COH-METRIX CTAP DES
Model CA (F) CA (S) CA (F) CA (S) CA (F) CA (S)
AdaBoost -0.015 0.008 0.000 0.064 0.045 0.040
CN2 0.000 -0.024 0.121 0.112 -0.031 0.016
DT -0.015 0.032 0.015 0.120 0.061 0.008
GB -0.045 0.040 0.137 0.112 -0.061 0.048
kNN -0.076 -0.072 0.091 0.104 -0.031 0.032
LR 0.015 -0.024 -0.046 0.072 0.000 0.000
NB 0.136 0.096 0.030 0.160 0.045 0.008
NN 0.016 0.080 0.121 0.024 -0.015 -0.064
RF 0.045 0.024 0.015 0.128 -0.060 -0.032
SVM 0.060 0.032 0.046 0.096 0.030 0.016
pared to the baseline, using COH-METRIX features.
Within the F scenario analysis, significant decreases
in CA scores were observed when holding out the
Descriptive (DESC), Syntactic Complexity (SYNT-
COMPLX), and Word Information (WORDINFO)
clusters. DESC focuses on formal text properties like
sentence length and word count, while SYNTCOM-
PLX focuses on syntactic aspects such as left embed-
dedness and sentence syntax similarity. WORDINFO
includes cognitive features associated with language
development, like age of acquisition and familiarity
for content words.
The impact of holding out these clusters varied
across learning models, with notable decreases ob-
served with the kNN, LR, and CN2 algorithms. For
example, the kNN model experienced a large decrease
of nearly 23% when the DESC cluster was removed.
At the same time, LR saw a decrease of almost 11%
with the removal of WORDINFO, and CN2 experi-
enced a decrease of 9.1% with the removal of SYNT-
COMPLEX. All of these clusters belong to lexical
and syntactic patterns.
In contrast, the S scenario showed improvements
in performance for many ML models when certain
feature clusters were removed, suggesting that these
clusters may hinder the classification task when in-
cluded. The clusters leading to the most consid-
erable increases in CA included Syntactic Pattern
Density (SYNTPATTERNDENS), Situational Model
(SITMODEL), Connectives (CONNECT), and Refer-
ential Cohesion (REFCOH), each contributing to dif-
ferent linguistic aspects. These clusters are associated
with syntactic and discursive patterns.
Results varied depending on the learner used. For
instance, the NN model showed an average improve-
ment of 13.7% when the four mentioned clusters were
removed, with the highest improvement of 18.2% at-
tributed to the removal of SYNTPATTERNDENS.
CSEDU 2024 - 16th International Conference on Computer Supported Education
134

Table 8: Experiment 3: Changes in Classification Accuracy (CA) for full (F) vs. split (S) scenarios using COH-METRIX
features with one-out feature cluster removal. Baseline: 0.727 (F) and 0.640 (S).
COH-METRIX
Models
Holdout Clusters CA AdaBoost CN2 DT GB kNN LR NB NN RF SVM
DESC F 0.015 -0.031 0.000 -0.076 -0.227 -0.061 -0.061 0.016 -0.061 0.015
S 0.092 0.052 0.038 0.068 -0.137 -0.025 -0.061 0.076 0.107 0.015
CONNECT F -0.015 0.000 -0.015 -0.015 -0.061 0.000 0.015 0.031 0.000 0.030
S 0.046 0.083 0.023 0.083 0.029 0.036 0.015 0.137 0.107 0.030
SYNTCOMPLX F 0.061 -0.091 0.046 -0.015 0.000 0.000 -0.031 0.016 -0.031 0.000
S 0.107 -0.008 0.084 0.098 0.090 0.036 -0.031 0.061 0.031 0.000
SYNTPATTERNDENS F 0.015 -0.031 -0.015 0.015 0.015 0.045 -0.016 0.031 0.030 0.000
S 0.076 0.052 0.023 0.128 0.105 0.096 -0.016 0.182 0.001 0.000
WORDINFO F 0.015 -0.061 0.015 -0.076 -0.015 -0.107 0.045 0.046 0.030 0.060
S 0.046 0.037 0.053 0.037 0.075 -0.040 0.045 0.122 0.061 0.060
REFCOH F 0.046 -0.031 0.000 0.000 0.000 0.000 0.000 0.076 -0.016 0.045
S 0.107 0.052 0.038 0.113 0.090 0.036 0.000 0.152 0.046 0.045
SITMODEL F 0.046 0.000 0.015 0.000 0.000 -0.016 0.015 0.031 0.000 0.015
S 0.061 0.083 0.053 0.113 0.090 0.020 0.015 0.076 0.182 0.015
LATSEMANALYSIS F 0.031 -0.031 0.030 -0.045 0.000 0.000 0.045 0.031 0.030 0.030
S 0.107 0.052 0.068 0.068 0.090 0.036 0.045 0.107 0.001 0.030
TXTEASA F 0.046 -0.031 0.000 0.000 -0.061 0.075 0.015 0.000 -0.046 0.030
S 0.107 0.052 0.038 0.113 0.029 0.111 0.015 0.076 -0.015 0.030
READ F 0.076 -0.061 0.030 -0.030 -0.015 -0.031 0.030 -0.030 0.060 0.000
S 0.137 -0.069 0.053 0.083 0.075 0.005 0.030 0.107 -0.015 0.000
Similarly, GB increased by almost 11% on average,
with the highest improvement of 12.8% attributed
to the removal of SYNTPATTERNDENS. RF also
showed notable improvements, with a high increase
of 18.2% when the SITMODEL cluster was removed.
CTAP
Next, Table 9 presents the CA values for the same two
scenarios with CTAP features. Within the F scenario
analysis, significant decreases in CA scores were ob-
served when the holdout strategy included the Lex-
ical Richness (LEXRICH), Lexical Variation (LEX-
VAR), Number of Part-of-speech (NUMPOS), and
Referential Cohesion (REFCOH) clusters. LEXRICH
and LEXVAR focus on lexical patterns, NUMPOS in-
cludes adverb lemma types and existential there to-
kens, and REFCOH encompasses local lexical over-
lap and noun overlap, all of which fall under syntactic
patterns.
The most notable findings were with the RF
model, which showed a decrease in performance
when all four clusters were removed. Specifically, re-
moving LEXRICH led to the largest drop of nearly
11%, while removing LEXVAR, NUMPOS, and RE-
FCOH caused a 9.1% decrease each. However, the
CN2 model exhibited a remarkable 15.1% increase in
accuracy when LEXRICH was excluded, while other
clusters did not affect classification. The GB model
saw a 6.1% accuracy improvement when LEXVAR
was removed, 1.6% for LEXRICH, 3.1% NUMPOS,
and no impact for REFCOH. This asymmetry in the
performance of the models requires careful interpre-
tation of the results and cannot be directly translated
into a choice of the best-performing feature clusters in
this task. This will be the object of subsequent stud-
ies. Also, it is pertinent to note that this asymmetry
has not been observed in such an expressive way with
the COH-METRIX feature clusters.
For the S scenario, in addition to LEXRICH,
LEXVAR, and NUMPOS, Lexical Density (LEX-
DENS) and Lexical Sophistication (LEXSOPH) clus-
ters were considered for their impact on the ML
model’s performance. LEXDENS includes features
like modals per word frequency, while LEXSOPH
comprises simple word presence and lexical types
from the New General Service List (NGSL). The Ad-
aBoost model saw a significant decrease of nearly
13% in accuracy when NUMPOS was excluded, and
CN2 exhibited a uniform decrease of nearly 9%
across several clusters. However, for the RF model,
removing LEXSOPH and NUMPOS clusters resulted
in a comparatively modest average decrease in accu-
racy of nearly 7%
DES
The one-out cluster removal strategy was applied to
the DES features as a last step in this experiment. Ta-
ble 10 presents the changes in CA values for the same
two scenarios, compared to the baseline. Within the F
scenario analysis, significant decreases in CA scores
occurred when the holdout strategy included Ortho-
graphic (ORT) and Grammatical (GRAMM) patterns,
with ORT impacting multiple models. The features
within the DES clusters have been previously intro-
duced in Table 4.
The most notable findings involved a decrease in
CA ranging from 15.2% for GB, 12.1% for kNN, to
almost 11% for NN when ORT was removed. Con-
Leveraging NLP and Machine Learning for English (L1) Writing Assessment in Developmental Education
135

Table 9: Experiment 3: Changes in Classification Accuracy (CA) for full (F) vs. split (S) scenarios using CTAP features with
one-out cluster removal. Baseline: 0.727 (F) and 0.640 (S).
CTAP
Models
Holdout Clusters CA AdaBoost CN2 DT GB kNN LR NB NN RF SVM
DESC F 0.030 0.000 0.000 0.076 0.000 -0.046 -0.015 -0.015 -0.015 0.000
S -0.040 0.008 -0.016 0.000 -0.008 -0.024 0.016 0.000 0.040 -0.008
LEXDENS F 0.000 0.121 0.046 0.016 0.000 0.000 0.000 0.015 -0.075 0.000
S -0.080 -0.088 0.024 0.008 0.000 0.000 0.000 -0.056 0.056 0.000
LEXRICH F 0.015 0.151 3.000 0.016 0.000 0.000 0.000 0.015 -0.106 -0.030
S -0.032 -0.088 0.048 0.040 0.000 -0.008 0.024 0.024 -0.016 0.048
LEXSOPH F 0.000 0.106 0.000 0.016 0.046 -0.076 0.000 0.061 -0.015 -0.030
S -0.088 -0.088 0.016 0.024 -0.032 -0.024 0.000 0.016 0.064 0.008
LEXVAR F -0.030 0.000 0.000 0.061 0.000 0.000 0.000 0.046 -0.091 0.000
S -0.024 -0.088 0.016 0.032 0.000 0.000 0.008 0.008 0.040 -0.016
SYNTCOMPLX F -0.015 0.000 -0.061 0.000 0.000 0.060 0.015 0.046 -0.060 0.000
S -0.040 0.040 0.008 -0.008 0.008 -0.040 -0.024 -0.024 0.016 0.040
NUMSYNTCONST F 0.000 0.000 -0.015 -0.015 0.000 0.015 0.000 0.046 -0.030 0.000
S -0.024 -0.072 0.032 -0.032 0.000 -0.008 0.024 -0.032 0.032 -0.024
NUMPOS F 0.046 0.000 -0.015 0.031 0.000 -0.031 -0.015 0.030 -0.091 -0.015
S -0.128 -0.088 -0.024 0.000 0.000 0.000 0.024 0.008 0.072 0.016
POSDENS F 0.030 0.000 0.000 0.076 0.000 0.000 0.000 0.000 0.000 0.000
S -0.032 -0.072 0.008 0.008 0.000 0.000 0.016 -0.040 0.056 0.040
REFCOH F -0.015 0.000 0.000 0.000 0.000 0.000 0.000 0.046 -0.091 0.000
S -0.040 -0.072 0.032 0.032 0.000 0.000 0.000 0.008 0.056 -0.016
Table 10: Experiment 3: Changes in Classification Accuracy (CA) for full (F) vs. split (S) scenarios using DES features with
one-out cluster removal. Baseline: 0.727 (F) and 0.640 (S).
DES
Model
Holdout Clusters CA AdaBoost CN2 DT GB kNN LR NB NN RF SVM
ORT F -0.031 -0.046 -0.045 -0.152 -0.121 0.000 -0.076 -0.106 -0.060 0.000
S -0.032 -0.008 -0.048 -0.024 -0.032 -0.008 -0.016 -0.096 -0.064 -0.008
GRAMM F 0.121 -0.122 0.015 0.151 0.000 0.000 0.091 0.030 0.152 0.030
S -0.016 -0.064 -0.008 -0.008 -0.056 0.000 -0.048 -0.040 -0.064 0.000
LEXSEM F 0.075 -0.076 -0.015 0.060 -0.031 0.000 -0.046 0.000 0.015 0.015
S -0.144 -0.080 -0.136 -0.112 -0.008 0.000 -0.016 -0.104 -0.112 -0.088
DISC F 0.075 0.015 -0.015 -0.031 -0.076 0.000 0.000 -0.030 0.106 -0.046
S 0.040 -0.016 -0.024 0.000 -0.096 0.000 -0.016 -0.064 -0.064 -0.048
versely, removing GRAMM only affected the CN2
model, decreasing its performance by 12.2%, while
AdaBoost, GB, NB, NN, and RF improved their ac-
curacy by almost 11% on average. Both ORT and
GRAMM features are indicative of formal correction,
making them particularly relevant to the classification
task, especially in the F scenario.
For the S scenario, LEXSEM had the highest
impact on CA scores. Five models, including Ad-
aBoost, DT, GB, RF, and NN, experienced a perfor-
mance deterioration ranging from 10.4% to 14.4%
when LEXSEM was removed. As LEXSEM relates
to the lexicon used, it has a significant impact on this
task’s scenario and is less affected by text length.
Experiment 4
The final experiment combined features from three
sources: COH-METRIX, CTAP, and DES. It then
used the Information Gain ranking method to pinpoint
the most discriminative features for both full (F) and
split (S) scenarios, before evaluating the performance
of ML models. As models were tested, features were
added in packs of 10 at a time, prioritized by their In-
formation Gain scores, until reaching asymptotic re-
sults. The same suite of ML algorithms employed in
prior experiments was used. The higher-ranking se-
lected features (30) and their corresponding Informa-
tion Gain scores are delineated in Table 11.
Within the highest-ranked features, most come
from CTAP (70%), followed by COH-METRIX
(23%). On a smaller scale (7%), the presence of two
DES features was noted (Verb Disagreement, Infor-
mation Gain: 0.075; Multiword Expressions (MWE):
Information Gain: 0.060) in the 7th and 14th place.
The Verb Disagreement is a syntactic feature that is
arguably difficult to obtain automatically, while the
MWE has seldom been mentioned in the literature
concerning readability and/or proficiency estimation
studies. Information Gain scores within these 30 fea-
tures ranged from 0.120 to 0.049. Two other DES
CSEDU 2024 - 16th International Conference on Computer Supported Education
136

Table 11: Experiment 4: Combined top-ranked 30 features from COH-METRIX, CTAP, and DES, ranked by Information
Gain scores.
Rank Feature Description Info. gain
1 CTAP POS Density Feature: Particle 0.120
2 CTAP Lexical Richness: Sophisticated Noun Type Ratio (NGSL) 0.114
3 CTAP Syntactic Complexity Feature: Prepositional Phrases per Sentence 0.105
4 CTAP Lexical Richness: Sophisticated Noun Ratio (NGSL) 0.087
5 CTAP Syntactic Complexity Feature: Complex Prepositional Phrases per Sentence 0.082
6 COH-METRIX CELEX word frequency for content words,
¯
X 0.075
7 DES Verb Disagreement 0.075
8 CTAP Lexical Sophistication: Sophisticated noun tokens (NGSL) 0.071
9 CTAP Number of POS Feature: Singular or mass noun Types 0.066
10 CTAP Number of POS Feature: Particle Tokens 0.066
11 COH-METRIX Hypernymy for nouns,
¯
X 0.064
12 CTAP Mean Sentence Length in Letters 0.062
13 CTAP Mean Sentence Length in Syllables 0.060
14 DES Multiword Expressions 0.060
15 CTAP Syntactic Complexity Feature: Mean Length of Complex T-unit 0.057
16 CTAP POS Density Feature: Existential There 0.057
17 CTAP Number of POS Feature: Possessive ending Tokens 0.054
18 COH-METRIX Text Easability PC Narrativity, percentile 0.054
19 CTAP POS Density Feature: Possessive Ending 0.053
20 COH-METRIX Sentence length, number of words, σ 0.053
21 CTAP POS Density Feature: Modal Verb 0.052
22 COH-METRIX Stem overlap, all sentences, binary,
¯
X 0.051
23 CTAP Syntactic Complexity Feature: Complex T-unit per Sentence 0.051
24 CTAP Lexical Richness: Easy Lexical Type Ratio (NGSL) 0.051
25 COH-METRIX Sentence length, number of words,
¯
X 0.051
26 COH-METRIX Ratio of intentional particles to intentional verbs 0.051
27 CTAP Number of POS Feature: Existential there Tokens 0.050
28 CTAP Syntactic Complexity Feature: Sentence Complexity Ratio 0.050
29 CTAP Lexical Sophistication: Easy noun types (NGSL) 0.050
30 CTAP Number of Syntactic Constituents: Verb Phrase 0.049
features ranked 42nd (Slang) and 46th (Mischosen
Preposition), both from the lexical and semantic pat-
tern clusters.
Table 12 illustrates the impact of this feature se-
lection on the predictive accuracy of the employed
ML algorithms. CA scores are highlighted in bold to
denote the highest scores achieved with varying num-
bers of features (Ft) - 10Ft to 100Ft. Additionally,
scores that exceed the benchmark CA of 0.727, estab-
lished in Experiment 1, are italicized for each model
and feature set. Figure 2 depicts the outcomes of Ex-
periment 4 for a more in-depth evaluation of the re-
sults obtained here.
Several algorithms, namely the CN2, DT, GB, LR,
and SVM, underperformed relative to the baseline.
Notably, the CN2 algorithm consistently registered a
CA of 0.561, showing no improvement with the in-
crease in feature count, thus indicating it is not suit-
able for the complex DevEd classification task de-
vised for this study.
Conversely, AdaBoost looked like a promising
model by exceeding the baseline CA with 70 Ft; how-
ever, results in CA tend to decrease upon adding fur-
ther features. A similar trend was observed with the
kNN, performing barely over the baseline with 80 Ft
but quickly decreasing its performance with the addi-
tion of more features. NN achieved a notable CA of
0.758 with both 60 and 70 Ft, yet it showed no further
improvements beyond this point.
The RF showed to be a fast learning model and a
promising one for this type of classification task. The
model performed consistently when both 30 and 40
features were added, exhibiting a CA score of 0.742
in both instances. Beyond this point, the model’s per-
formance deteriorated considerably.
Among the algorithms, NB stood out as the fastest
learning model and the one that consistently per-
formed the best throughout the experiment. With 30
Ft, the model achieved a CA of 0.773 —an almost
5% enhancement over the baseline. Its performance
reached an asymptotic line at a CA of 0.788 with 50
Ft, marking a notable 9.1% improvement from the
baseline. The model continued performing above the
baseline as more features were added, reaching a peak
CA score of 0.818 at 60 Ft. As more features were
added, the model performed consistently within a CA
range of 0.773 and 0.788.
When the experiment was conducted within the S
scenario, only one model, the NN, performed above
the baseline (0.640) with a CA of 0.656 (with 10Ft),
which is only a 1.6% improvement. As more features
were added, scores deteriorated substantially, with
accuracy scores ranging between 0.432 and 0.480.
Therefore, these scores were discarded.
Leveraging NLP and Machine Learning for English (L1) Writing Assessment in Developmental Education
137
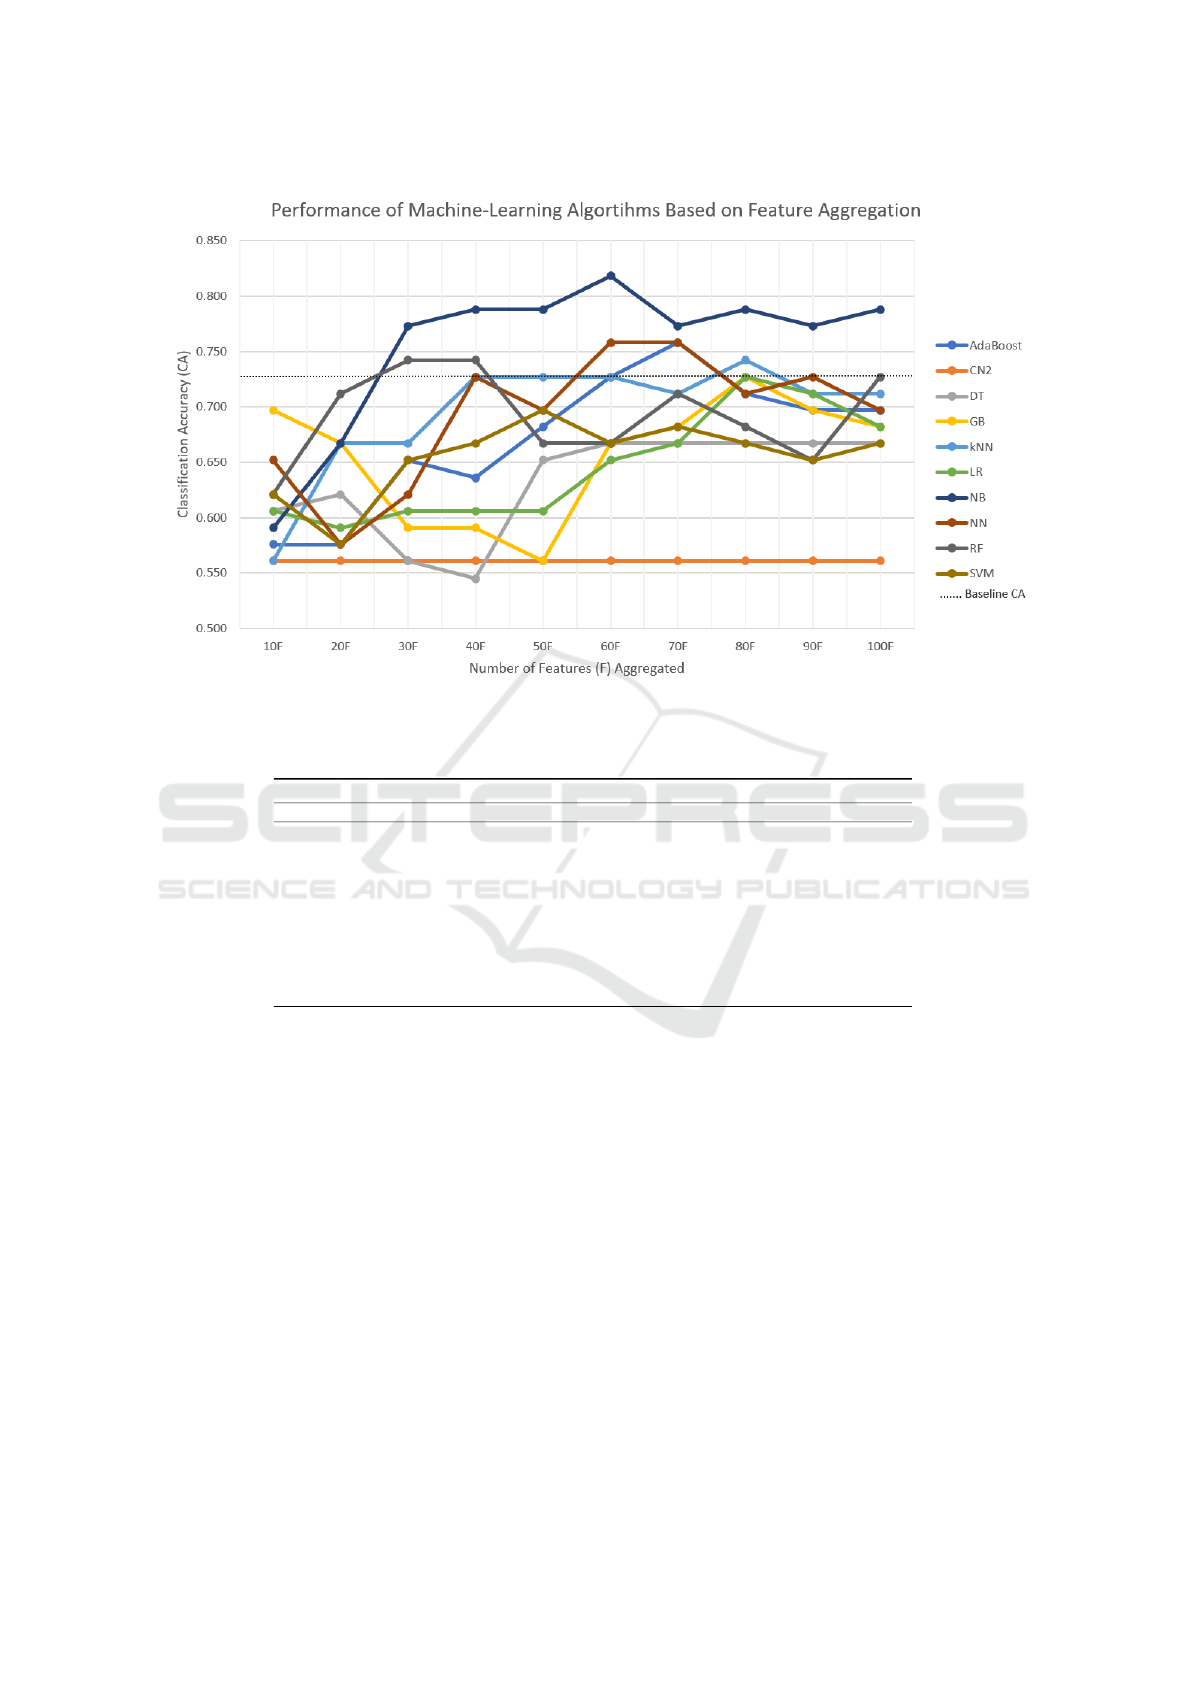
Figure 2: Experiment 4: Machine-learning algorithms performance.
Table 12: Experiment 4: Classification Accuracy (CA) for full (F) scenario using a combination of feature sets (Ft), in packs
of 10, based on Information Gain.
Classification Accuracy (CA) Scores
Model 10Ft 20Ft 30Ft 40Ft 50Ft 60Ft 70Ft 80Ft 90Ft 100Ft
AdaBoost 0.576 0.576 0.652 0.636 0.682 0.727 0.758 0.712 0.697 0.697
CN2 0.561 0.561 0.561 0.561 0.561 0.561 0.561 0.561 0.561 0.561
DT 0.606 0.621 0.561 0.545 0.652 0.667 0.667 0.667 0.667 0.667
GB 0.697 0.667 0.591 0.591 0.561 0.667 0.682 0.727 0.697 0.682
kNN 0.561 0.667 0.667 0.727 0.727 0.727 0.712 0.742 0.712 0.712
LR 0.606 0.591 0.606 0.606 0.606 0.652 0.667 0.727 0.712 0.682
NB 0.591 0.667 0.773 0.788 0.788 0.818 0.773 0.788 0.773 0.788
NN 0.652 0.576 0.621 0.727 0.697 0.758 0.758 0.712 0.727 0.697
RF 0.621 0.712 0.742 0.742 0.667 0.667 0.712 0.682 0.652 0.727
SVM 0.621 0.576 0.652 0.667 0.697 0.667 0.682 0.667 0.652 0.667
5 CONCLUSIONS AND FUTURE
WORK
This study aimed to address two primary objectives:
(i) the refinement of linguistic feature identification
crucial to DevEd placement decisions, and (ii) the im-
provement of first language (L1) writing proficiency
assessment within DevEd contexts.
A total of 436 linguistic features were extracted
from COH-METRIX and CTAP and supplemented
with 21 DES features systematically vetted and tested
through a rigorous quality assurance process. A
total of 4 supervised ML experiments were con-
ducted within two scenarios (F and S essays) to deter-
mine the best linguistic features for the task and the
best-performing ML algorithm using ORANGE Text
Mining platform. Due to the availability of compara-
ble data, a baseline (0.727, F samples scenario) was
set. In general, full samples tend to produce higher
accuracy results than when the samples are split.
Improvements in the models’ performance were
noted. A notable increase in CA of nearly 14% is ob-
served for the NB and GB models on the full scenario
in Experiment 2, employing only the top 11 features
identified through Information Gain from the COH-
METRIX and CTAP feature sets. When the holdout
cluster strategy was applied in Experiment 3, accu-
racy performance varied across learning models, with
notable decreases (meaning that removing the clus-
ters hindered the classification task) observed with the
kNN, LR, and CN2 algorithms. Clusters were dis-
tributed among lexical, syntactic, and discursive pat-
CSEDU 2024 - 16th International Conference on Computer Supported Education
138

terns, which seems to correlate with some of the pat-
terns reported by the current literature.
The NB evidenced an impressive increase of 9.1%
(from the baseline), noted in Experiment 4, when
a combination of 60 features from COH-METRIX,
CTAP, and DES were used. This ML algorithm,
known for its simplicity and adaptability to classifi-
cation tasks, appeared as a fast learner with a combi-
nation of 30 features (21 from CTAP, 7 from COH-
METRIX, and 2 DES), yielding a CA of 0.773, and
the one that consistently performed. The best perfor-
mance of this model, with 0.818 in its CA, however,
was attained when 60 features were added. While the
best-performing features were from CTAP and COH-
METRIX, novel features devised explicitly for DevEd
purposes, DES, ranked within the top 15.
The limited size of the corpus utilized in this study
is recognized. The next phase of this study includes
the expansion of the corpus to a more sufficiently
robust size, using text samples collected during the
2023-2024 academic year. This expansion will in-
volve the integration of features identified as crucial
for enhancing the accuracy of our ML-based classifi-
cation algorithms. The more accurate the ML-based
estimations of classification, the more accurate the
placement of students in a DevEd level that closely
matches their current writing proficiency levels.
Additionally, large foundational models, specif-
ically those built on Generative Pre-trained Trans-
former (GPT) technology, will be explored to gen-
erate sample texts that align with college-level writ-
ing standards and thus test the generalization power
on this artificial data of the features and models dis-
cussed in this study.
ACKNOWLEDGMENTS
This work was supported by Portuguese national
funds through FCT (Reference: UIDB/50021/2020,
DOI: 10.54499/UIDB/50021/2020) and by the
European Commission (Project: iRead4Skills,
Grant number: 1010094837, Topic: HORIZON-
CL2-2022-TRANSFORMATIONS-01-07, DOI:
10.3030/101094837).
We also extend our profound gratitude to the ded-
icated annotators who participated in this task and the
IT team whose expertise made the systematic analysis
of the linguistic features presented in this paper possi-
ble. Their meticulous work and innovative approach
have been instrumental in advancing our research.
REFERENCES
Akef, S., Mendes, A., Meurers, D., and Rebuschat, P.
(2023). Linguistic complexity features for auto-
matic Portuguese readability assessment. In XXXIX
Encontro Nacional da Associac¸
˜
ao Portuguesa de
Lingu
´
ıstica, Covilh
˜
a, Portugal, October 26–28, 2023,
Proceedings 14, pages 103–109. Associac¸
˜
ao Por-
tuguesa de Lingu
´
ıstica.
Beaulac, C. and Rosenthal, J. S. (2019). Predicting univer-
sity students’ academic success and major using ran-
dom forests. Research in Higher Education, 60:1048–
1064.
Bujang, S. D. A., Selamat, A., Ibrahim, R., Krejcar, O.,
Herrera-Viedma, E., Fujita, H., and Ghani, N. A. M.
(2021). Multiclass prediction model for student grade
prediction using machine learning. IEEE Access,
9:95608–95621.
Chawla, N. V., Bowyer, K. W., Hall, L. O., and Kegelmeyer,
W. P. (2002). Smote: synthetic minority over-
sampling technique. Journal of artificial intelligence
research, 16:321–357.
Chen, X. and Meurers, D. (2016). CTAP: A Web-Based
Tool Supporting Automatic Complexity Analysis. In
Proceedings of the Workshop on Computational Lin-
guistics for Linguistic Complexity (CL4LC), pages
113–119, Osaka, Japan. The COLING 2016 Organiz-
ing Committee.
Cormier, M. and Bickerstaff, S. (2019). Research on De-
velopmental Education Instruction for Adult Literacy
Learners. The Wiley Handbook of Adult Literacy,
pages 541–561.
Crossley, S. A. (2020). Linguistic features in writing quality
and development: An overview. Journal of Writing
Research, 11(3):415–443.
Crossley, S. A., Russell, D. R., Kyle, K., and R
¨
omer, U.
(2017). Applying natural language processing tools to
a student academic writing corpus: How large are dis-
ciplinary differences across science and engineering
fields? Journal of Writing Analytics, pages 48–81.
Da Corte, M. and Baptista, J. (2022). A phraseology ap-
proach in developmental education placement. In Pro-
ceedings of Computational and Corpus-based Phrase-
ology, EUROPHRAS 2022, Malaga, Spain, pages 79–
86.
Da Corte, M. and Baptista, J. (2024a). Charting the lin-
guistic landscape of developing writers: an anno-
tation scheme for enhancing native language profi-
ciency. In Proceedings of the 2024 joint International
Conference on Computational Linguistics, Language
Resources and Evaluation – LREC-COLING, 20-25
May, 2024, Turin, Italy, page to appear.
Da Corte, M. and Baptista, J. (2024b). Enhancing writ-
ing proficiency classification in developmental edu-
cation: the quest for accuracy. In Proceedings of
the 2024 joint International Conference on Computa-
tional Linguistics, Language Resources and Evalua-
tion - LREC-COLING, 20-25 May, 2024, Turin, Italy,
page to appear.
Da Corte, M. and Baptista, J. (2024c). Linguistic fea-
tures analysis in a developmental education context:
Leveraging NLP and Machine Learning for English (L1) Writing Assessment in Developmental Education
139

A comparative study of full and split sample text units.
GitLab repository.
Dem
ˇ
sar, J., Curk, T., Erjavec, A.,
ˇ
Crt Gorup, Ho
ˇ
cevar, T.,
Milutinovi
ˇ
c, M., Mo
ˇ
zina, M., Polajnar, M., Toplak,
M., Stari
ˇ
c, A.,
ˇ
Stajdohar, M., Umek, L.,
ˇ
Zagar, L.,
ˇ
Zbontar, J.,
ˇ
Zitnik, M., and Zupan, B. (2013). Orange:
Data Mining Toolbox in Python. Journal of Machine
Learning Research, 14:2349–2353.
Filighera, A., Steuer, T., and Rensing, C. (2019). Automatic
text difficulty estimation using embeddings and neu-
ral networks. In Transforming Learning with Mean-
ingful Technologies: 14th European Conference on
Technology Enhanced Learning, EC-TEL 2019, Delft,
The Netherlands, September 16–19, 2019, Proceed-
ings 14, pages 335–348. Springer.
Goudas, A. M. (2020). Measure twice, place once: Under-
standing and applying data on multiple measures for
college placement. http://communitycollegedata.com
/wp-content/uploads/2020/03/2020MultipleMeasure
sNOSSPreconfWksp.pdf.
Hassel, H. and Giordano, J. B. (2015). The blurry borders
of college writing: Remediation and the assessment of
student readiness. College English, 78(1):56–80.
Huang, Z. (2023). An intelligent scoring system for english
writing based on artificial intelligence and machine
learning. International Journal of System Assurance
Engineering and Management, pages 1–8.
Kafka, T. (2018). Student assessment. In Flippo, R. F. and
Bean, T. W., editors, Handbook of College Reading
and Study Strategy Research, pages 326–339. Rout-
ledge, 3 edition.
King, J. B., McIntosh, A., Bell-Ellwanger, J., Schak, O.,
Metzger, I., Bass, J., McCann, C., and English, J.
(2017). Developmental Education: Challenges and
Strategies for Reform. US Department of Education,
Office of Planning, Evaluation and Policy Develop-
ment.
Kochmar, E., Gooding, S., and Shardlow, M. (2020). De-
tecting multiword expression type helps lexical com-
plexity assessment. arXiv preprint arXiv:2005.05692.
Laporte, E. (2018). Choosing features for classifying mul-
tiword expressions. In Sailer, M. and Markantonatou,
S., editors, Multiword expressions: In-sights from a
multi-lingual perspective, pages 143–186. Language
Science Press, Berlin.
Leal, S. E., Duran, M. S., Scarton, C. E., Hartmann, N. S.,
and Alu
´
ısio, S. M. (2023). Nilc-metrix: assessing the
complexity of written and spoken language in brazil-
ian portuguese. Language Resources and Evaluation,
pages 1–38.
McNamara, D. S., Ozuru, Y., Graesser, A. C., and Louw-
erse, M. (2006). Validating CoH-Metrix. In Proceed-
ings of the 28th annual Conference of the Cognitive
Science Society, pages 573–578.
Nazzal, J. S., Olson, C. B., and Chung, H. Q. (2020). Dif-
ferences in Academic Writing across Four Levels of
Community College Composition Courses. Teaching
English in the Two Year College, 47(3):263–296.
Okinina, N., Frey, J.-C., and Weiss, Z. (2020). Ctap for ital-
ian: Integrating components for the analysis of italian
into a multilingual linguistic complexity analysis tool.
In Proceedings of the 12th Conference on Language
Resources and Evaluation (LREC 2020, pages 7123–
7131.
Pal, A. K. and Pal, S. (2013). Classification model of
prediction for placement of students. International
Journal of Modern Education and Computer Science,
5(11):49.
Pasquer, C., Savary, A., Ramisch, C., and Antoine, J.-Y.
(2020). Verbal multiword expression identification:
Do we need a sledgehammer to crack a nut? In
Proceedings of the 28th International Conference on
Computational Linguistics, pages 3333–3345.
Qian, L., Zhao, Y., and Cheng, Y. (2020). Evaluating
China’s automated essay scoring system iWrite. Jour-
nal of Educational Computing Research, 58(4):771–
790.
Santos, R., Rodrigues, J., Branco, A., and Vaz, R. (2021).
Neural text categorization with transformers for learn-
ing portuguese as a second language. In Progress in
Artificial Intelligence: 20th EPIA Conference on Arti-
ficial Intelligence, EPIA 2021, Virtual Event, Septem-
ber 7–9, 2021, Proceedings 20, pages 715–726.
Springer.
Schober, P., Boer, C., and Schwarte, L. A. (2018). Corre-
lation coefficients: appropriate use and interpretation.
Anesthesia & analgesia, 126(5):1763–1768.
The College Board (2022). ACCUPLACER Program Man-
ual. (online).
Wilkens, R., Alfter, D., Wang, X., Pintard, A., Tack, A.,
Yancey, K. P., and Franc¸ois, T. (2022). Fabra: French
aggregator-based readability assessment toolkit. In
Proceedings of the Thirteenth Language Resources
and Evaluation Conference, pages 1217–1233.
Zachry Rutschow, E., Edgecombe, N., and Bickerstaff, S.
(2021). A Brief History of Developmental Education
Reform.
CSEDU 2024 - 16th International Conference on Computer Supported Education
140
