
Datasets on Mobile App Metadata and Interface Components to Support
Data-Driven App Design
Jonathan Cesar Kuspil
1 a
, Jo
˜
ao Vitor Souza Ribeiro
2 b
, Gislaine Camila Lapasini Leal
1 c
,
Guilherme Corredato Guerino
1,2 d
and Renato Balancieri
1,2 e
1
State University of Maring
´
a (UEM), Maring
´
a, Brazil
2
State University of Paran
´
a (UNESPAR), Apucarana, Brazil
Keywords:
Mobile Application, Graphical User Interface, Metadata Datasets, Design Mining, App Datasets.
Abstract:
The global mobile device market currently encompasses 6.5 billion users. Therefore, standing out in the
competitive scenario of application stores such as the Google Play Store (GPlay) requires, among several
factors, great concern with the User Interface (UI) of the apps. Several datasets explore UI characteristics
or the metadata present in GPlay, which developers and users write. However, few studies relate these data,
limiting themselves to specific aspects. This paper presents the construction, structure, and characteristics of
two Android app datasets: the Automated Insights Dataset (AID) and the User Interface Depth Dataset (UID).
AID compiles 48 different metadata from the 200 most downloaded free apps in each GPlay category, totaling
6400 apps, while UID goes deeper into identifying 7540 components and capturing 1948 screenshots of 400
high-quality apps from AID. Our work highlights clear selection criteria and a comprehensive set of data,
allowing metadata to be related to UI characteristics, serving as a basis for developing predictive models and
understanding the current complex scenario of mobile apps, helping researchers, designers, and developers.
1 INTRODUCTION
Boasting more than 6.5 billion users globally, mobile
devices are now indispensable for communication and
technological interaction. The Google Play Store
(GPlay)
1
, the predominant app marketplace, features
2.6 million apps as of 2023. Concurrently, Android,
the operating system associated with this app store, is
installed on 70% of smartphones (Statista, 2023).
In such a competitive landscape, differentiating
requires a focus on the quality of the User Interface
(UI), which significantly influences the User Experi-
ence (UX) (Nielsen and Budiu, 2015). Accessing per-
tinent examples can elucidate market trends and best
practices, thereby assisting designers and developers
in refining their applications and enhancing user en-
gagement (Deka et al., 2017).
a
https://orcid.org/0009-0002-7025-2011
b
https://orcid.org/0009-0001-3258-2602
c
https://orcid.org/0000-0001-8599-0776
d
https://orcid.org/0000-0002-4979-5831
e
https://orcid.org/0000-0002-8532-2011
1
https://play.google.com/
Some works have developed datasets with thou-
sands of UIs; however, few works create links be-
tween the graphic and textual elements presented
in the interfaces, identifying, for example, interface
components, essential items in the construction and
understanding of the UX. The applicability of this
knowledge is diverse and can serve as training data for
models capable of generalizing knowledge, detecting
apps similarity or generating interfaces from screen-
shots (Liu et al., 2018; da Cruz Alves et al., 2022).
This paper aims to demonstrate the construction
process, structure, and characteristics of two Android
app datasets: the Automated Insights Dataset (AID)
and the User Interface Depth Dataset (UID). AID
brings together metadata of the 200 most downloaded
free apps from each of GPlay’s 32 categories, totaling
6400 apps, with information beyond that presented by
app stores. The UID brings a high-quality sampling of
AID and delves into the identification of 7540 compo-
nents separated into 50 types and the capture of 1948
screenshots of the interface of 400 apps. We used
Google Material Design (GMD) components to create
the set of standard UI components, as it is a relevant
and popular design language used in the Android sys-
Kuspil, J., Ribeiro, J., Leal, G., Guerino, G. and Balancieri, R.
Datasets on Mobile App Metadata and Interface Components to Support Data-Driven App Design.
DOI: 10.5220/0012740600003690
Paper published under CC license (CC BY-NC-ND 4.0)
In Proceedings of the 26th International Conference on Enterprise Information Systems (ICEIS 2024) - Volume 1, pages 425-432
ISBN: 978-989-758-692-7; ISSN: 2184-4992
Proceedings Copyright © 2024 by SCITEPRESS – Science and Technology Publications, Lda.
425
tem and also some components from Android Studio
2
(AS), a widely-used Android development platform.
The paper is organized as follows: Section
2 presents work that developed or used mobile
app datasets; Section 3 addresses the methodology
adopted; Section 4 details the AID and UID datasets;
Section 5 discusses limitations and threats to validity;
and Section 6 highlights the results, contributions, and
practical applications.
2 RELATED WORK
2.1 Mobile App Metadata Datasets
App stores present valuable app data, such as prod-
uct descriptions and user reviews, that are fundamen-
tally strategic for companies and developers. How-
ever, challenges such as GPlay’s Anti-web scraping
mechanisms impose barriers to collecting and analyz-
ing this data.
In the past, (Prakash and Koshy, 2021) mined
metadata from more than 2.3 million apps and games
available on GPlay in 2021 and (Kabir and Are-
fin, 2019), used an ”app crawler” to identify key-
words present in GPlay app reviews. However, App-
brain
3
stands out as a comprehensive, updated, and
auditable dynamic data repository of GPlay apps, of-
fering insights beyond what is available on the app
store (Harty and M
¨
uller, 2019; Crussell et al., 2014).
This repository maintains information even on apps
that are no longer available, offering historical data
on the evolution of apps, being chosen, therefore, as a
viable choice to overcome the challenges of GPlay.
2.2 Mobile UI Datasets
Large-scale mobile UI data repositories are essen-
tial for several applications, especially for data-driven
model development. The Rico
4
dataset contains vi-
sual, textual, structural, and interactive design prop-
erties of 66 thousand screenshots from 9.7 thousand
free apps (Deka et al., 2017). Furthermore, it served
as a basis for other works such as (Liu et al., 2018;
Wang et al., 2021) that map the components of a
small subset of these screenshots, creating component
identification models. In general, the goal pursued in
component mapping is linked to the development of
tools to assist the developer in searching for similar
UIs to recommend components (Bunian et al., 2021;
2
https://developer.android .com/studio
3
https://www.appbrain.com/
4
http://www.interactionmining.org/
da Cruz Alves et al., 2022). Still, the few works that
relate UIs to metadata have a limited mapping of com-
ponents (Li et al., 2014).
In general, the UIs of popular Android apps are
of better quality compared to other operating systems
(Kortum and Sorber, 2015). Furthermore, works such
as (Liu et al., 2018), which classify and categorize
UI components using GMD as a basis, which aligned
with the popularity of the Android language and sys-
tem, were also chosen as the basis for our work.
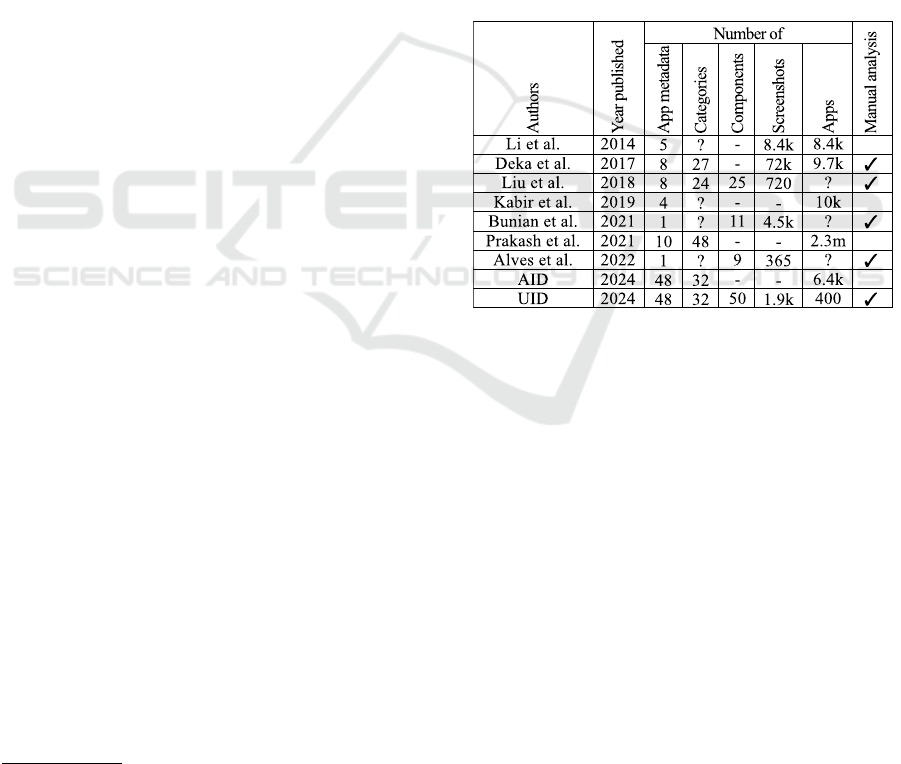
Although the data presented in Table 1 show the
magnitude of popular datasets linked to apps, to our
best knowledge, no work relates the components of
the UIs with the metadata, even those capable of iden-
tifying this link. Furthermore, there was no descrip-
tion of the criteria used to select apps in any datasets.
Table 1: Comparing existing app database (”?” the informa-
tion was not addressed and ”-” when not applicable).
3 METHODOLOGY
Based on other studies, this section describes the pro-
cess of building both datasets (de Souza Lima et al.,
2022; Liu et al., 2018). The subsection 3.1 dis-
cusses determining the sample population size and in-
clusion/exclusion criteria and introduces the datasets.
The subsection 3.2 details AID and UID collection.
3.1 Requirements Analysis
3.1.1 Sample
We used GPlay as a basis to calculate the sample.
The size of this sample (n) was calculated using the
formula for finite populations (Fonseca and Martins,
2016) (Eq.1), where Z is the abscissa of the standard
normal distribution (fixed in the literature at 1.96); σ
is the population standard deviation (found at a value
of 0.5535); d denotes the sampling error (0.054243);
ICEIS 2024 - 26th International Conference on Enterprise Information Systems
426
and, N is the size of the total population of GPlay
apps (2.6 million). Consequently, our study includes
400 apps for manual analysis, aligning with findings
from other research (Liu et al., 2018; de Souza Lima
et al., 2022).
n =
Z
2
· σ
2
· N
d
2
(N − 1) + Z
2
· σ
2
(1)
3.1.2 Inclusion and Exclusion Criteria
When designing the inclusion and exclusion criteria
for the datasets, we aimed to guarantee relevant, up-
dated, representative, replicability and auditable data.
Initially, we identify and extract the metadata from the
200 most downloaded free apps from each of GPlay’s
32 categories. This number of 200 apps is considered
the total number of downloads and coincides with the
size of the ranking of each category on AppBrain, and
the fact that they are free is linked to the greater pos-
sibility of analyzing the app, therefore justifying the
choices (Deka et al., 2017).
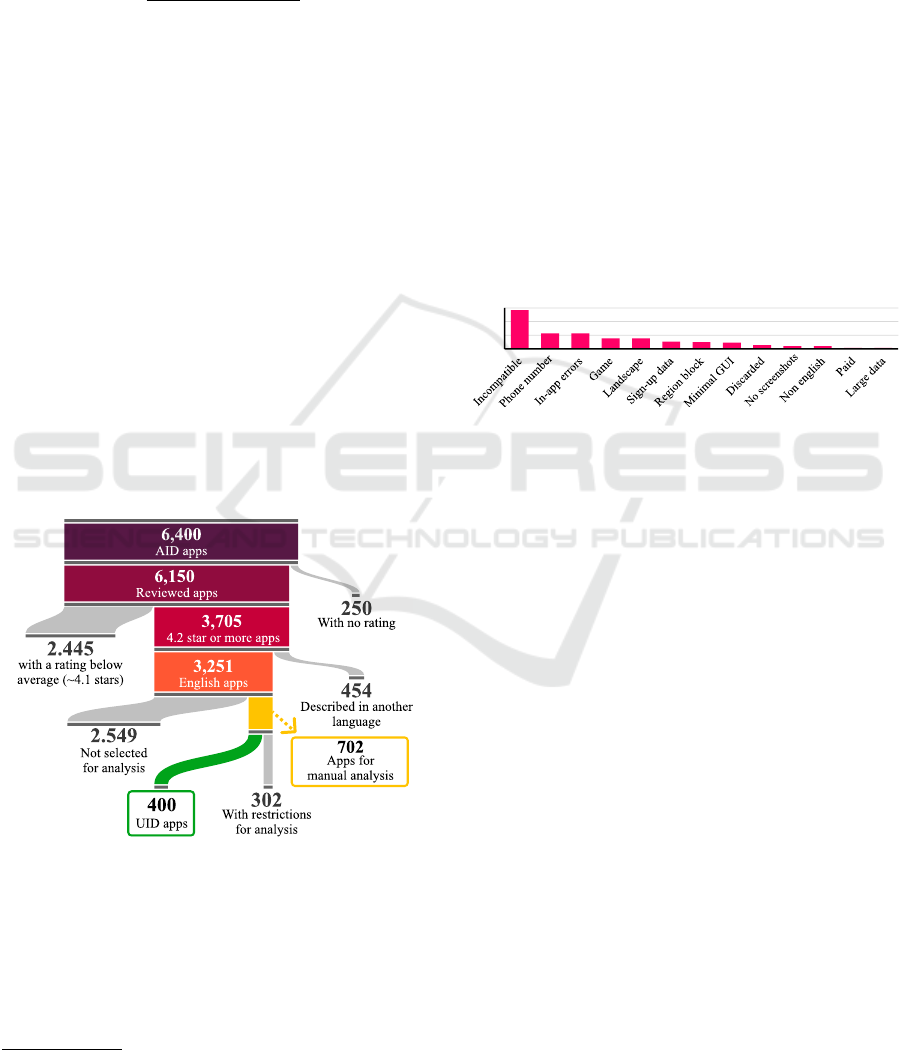
This initial dataset, which contained the descrip-
tion and rating of 6400 apps, was the first version of
the AID and the basis for the next steps of the work,
which involved an iterative process of refining the se-
lection shown in figure 1. We removed apps with no
reviews and then calculated the average rating of 6150
apps, excluding apps ≤ 4.1 stars, below average.
Figure 1: UID app selection journey from AID.
During the analysis of app descriptions, observa-
tions from comments and screenshots indicated that
apps lacking an English description typically do not
offer an interface in English either. Consequently, we
utilized the Language Service API
5
to identify the
language of the apps’ descriptions. Apps with de-
5
https://developers.google.com/apps-script/reference/
language?hl=en
scriptions in languages other than English were ex-
cluded to ensure UI compliance.
Reaching a set of 3251 apps unevenly distributed
across the categories, we created a set of restrictions
aimed at the quality and relevance of the apps ana-
lyzed. Our restrictions excluded apps that are incom-
patible with the device; require a phone number; have
execution errors; are a game; are locked in landscape
mode; require specific data for sign-up; are region re-
stricted; have a minimal UI such as frameworks, API
and launchers; exceeded category distribution; do not
allow screenshots; are paid; has a non-English UI; re-
quires large files.
We primarily selected apps with the highest num-
ber of downloads that met the imposed restrictions,
accounting for the uneven distribution across each
category. As a result, out of the 702 apps analyzed,
400 formed the UID, while 302 were discarded due to
various exclusion criteria, as shown in Figure 2.
85
34 34
23 23
16
15
14
8
6 6
2 2
0
30
60
90
Figure 2: Restrictions encountered in app analysis.
3.1.3 Data Categories
The data present in the UID and AID are presented in
Table 2 and are divided into four categories: GPlay
Metadata are extracted indirectly from the play-
store; AppBrain Metadata complements and/or adds
a layer of information to GPlay metadata; Material
Design components are identifiers of GMD compo-
nents in the UI; Complementary components are
identifiers of interface components beyond those de-
scribed by the GMD. In addition, each date in Table
2 has a number that refers to its type:
1
is discrete
numeric;
2
is binary;
3
is nominal categorical;
4
is or-
dinal categorical;
5
is a text.
The captured components of each app are solely
linked to the app’s main functions and screens, ex-
cluding components that appear in, for example, con-
figuration screens, login, tutorials, external elements,
and ads. This choice aims to streamline the analysis
time, as it is impossible to analyze each app deeply.
3.2 Data Management
3.2.1 AID Collection
Carried out by one researcher, the initial 6400 app’s
data were extracted on November 3, 2023, by a de-
Datasets on Mobile App Metadata and Interface Components to Support Data-Driven App Design
427
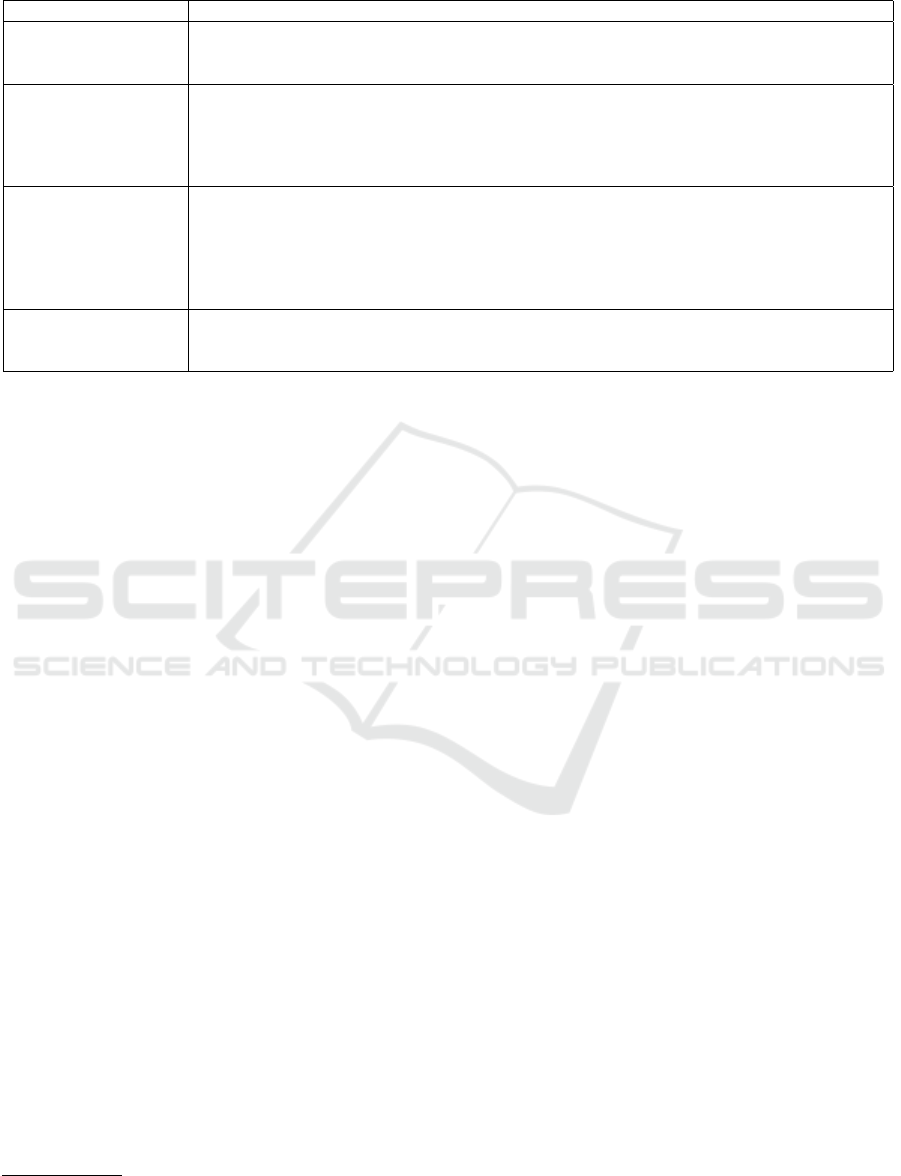
Table 2: Categories and data collected.
Category Data collected
GPlay Metadata: is
present in the AID and
UID
GPlay Link
5
, Name
5
, Package
5
, Developer
5
, Category
3
, Total Downloads
1
, Description
5
, Pur-
chase Cost
1
, Cost of In-App Purchases
5
, Current App Version
4
, APK size
4
, Minimal Android
Version
4
, Maturity
4
, Suitable for
4
, User Rating
1
and Number of Ratings
1
AppBrain Metadata:
is present in the AID
and UID
AppBrain App Link
5
, Most Downloaded Position in Category
1
, 10 Ranks by Country
5
, Cur-
rent Global Rank
4
, Recent Downloads
1
, Short Description
5
, Description Language
3
, Library
Count
1
, Positive and Negative Reviews Examples
5
, Development Tools and Libraries
5
, Con-
tains Ad
2
, Ad Libraries
5
, Social Libraries
5
, 12 Categories of Permissions
5
, Release day
5
, Instal-
lations milestones
5
, Updates
5
, Unpublished day
5
, Category change
5
and Price over the time
5
Material Design
com-ponents: is
present in the UID
Snackbar
2
, Tool tip
2
, Badge
2
, Circular progress indicator
2
, Linear progress indicator
2
, Dialog
2
,
Full-screen dialog
2
, Date picker
2
, Dial time picker
2
, Digital time picker
2
, Side sheet
2
, Bot-
tom sheet
2
, Radio button
2
, Switch
2
, Checkbox
2
, Slider
2
, Menu
2
, Navigation rail
2
, Navigation
drawer
2
, Navigation bar
2
, Primary tab
2
, Secondary tab
2
, Segmented buttons
2
, Chips
2
, Top app
bar
2
, Extended FAB
2
, Floating action button
2
, Bottom app bar
2
, Search
2
, Carousel
2
, List
2
,
Divider
2
, Common button
2
, Text field
2
, Icon button
2
.
Complementary
com-ponents: is
present in the UID
Pre-loading indicator
2
, Sound effects
2
, Background music
2
, Web component
2
, Map view
2
,
Videos
2
, Account required
2
, Social interaction
2
, Default night mode
2
, Landscape mode
2
, Text
view
2
, Card list
2
, Grid layout
2
, Images
2
, Characteristic color
3
Collected date
5
, Screenshots.
veloped web crawler using Selenium
6
. On Novem-
ber 26, 2023, the remaining data was extracted by en-
hancing the web crawler. Finally, the raw data was
transformed into the AID metadata.
3.2.2 UID Collection
Two researchers carried out the UID collection, which
was divided into four stages, which will be explained
below. The researchers had previously passed blind-
ness tests.
Setting Parameters: To maintain consistency
and replicability, we decide to emulate using BlueS-
tacks
7
an Android 11 device, with 4 CPU Cores and 8
GB of RAM, using the x86 and ARM architectures in
32 and 64 bits for greater compatibility. We also cre-
ated emails and a set of fictitious data to fill out forms.
We emulated New York, USA, as a geographic loca-
tion.
Pilot Test: Composed of a subset of 33 apps from
multiple categories and some complementary compo-
nents, the test evaluated the feasibility of collecting
and usefulness of the data and selected techniques.
We identified and addressed crucial issues, refining
both the UID and our collection strategy and devel-
oping a collection support tool that stores data before
consolidation.
Data Collection: Following a pre-designed script,
we started each collection section by installing around
seven apps. We analyzed the apps, discarding those
with restrictions, taking an average of 15 minutes
for each app collected, with a maximum duration
of 2 hours, to minimize errors linked to fatigue
(de Souza Lima et al., 2022). The components were
6
https://www.selenium.dev/
7
https://www.bluestacks.com/
marked in the tool, and at the end of each section, the
data and screenshots were individually analyzed and
sent to an online repository. The definitive UID data
collection began on November 12, 2023, and ended
on February 5, 2024.
Dataset Management and Analysis: The UID
management process did not present challenges, as
the collection organization guaranteed the correct
structuring of the dataset. The dataset analyses were
carried out in Excel.
4 DATASETS
This section provides qualitative information, graphs,
applicability, and observations pertinent to each
database, with each aspect discussed in a sepa-
rate subsection. The dataset files are accessible
at https://doi.org/10.5281/zenodo.10676845 compris-
ing spreadsheets named ”Automated Insights Dataset
(AID).xlsx” and ”User Interface Depth Dataset
(UID).xlsx”. In addition to these files, the repository
has a folder with screenshots of the UID apps divided
by the ID of each app; a folder with a spreadsheet
and screenshots of discarded apps; the source code of
the web crawlers and tools developed; a folder that
contains graphical representations of the UID compo-
nents and textual representations of each component
present in the UID and AID, allowing a better under-
standing of the criteria used.
4.1 Exploration of AID Characteristics
The AID dataset comprises insights from the top 200
most downloaded free apps across 32 GPlay cate-
gories, totaling 6400 apps. It stands out from other
ICEIS 2024 - 26th International Conference on Enterprise Information Systems
428
17
94
8
1535
2489
808
658
438
140
38
25
15
6
0
600
1200
1800
2400
1 2 3 4 5 6 7 8 9 10 11 12 13
248
37
239
1506
4349
21
0
10
00
20
00
30
00
4
000
5
000
N/A 1 2 3 4 5
167
159
126
123
99
53
45
39
34
33
22
121
0
50
100
150
200
5,8
3,0
1,7
9,9
14,0
1,1
38,0
2,9
17,0
44,5
0,4
30,5
7,7
16,0
2,1
0,5
15,0
9,0
2,8
43,0
6,1
1,6
21,5
52,0
44,0
35,0
29,5
5,7
12,0
32,0
5,4
0
10
20
30
40
50
60
200
snoillim ni sdaolnwod naideM
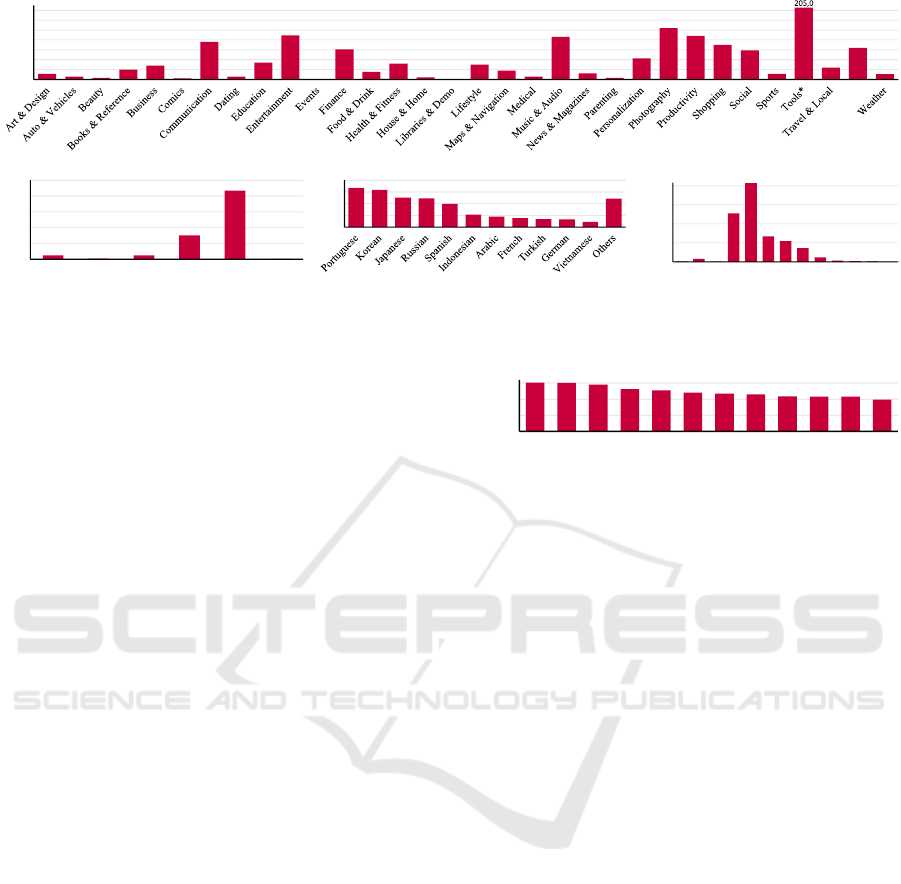
(a) Median of total downloads in millions per category
(b) Average rating (rounded) by
number of apps
(d) Android version
required by number of apps
(c) Description language by number of
apps (no english)
▲
Video Players & Editors
Figure 3: Set of relevant data present in the AID.
datasets by offering 48 metadata categories, as illus-
trated in Table 2. This section will explore pivotal
metadata from AID and noteworthy discoveries from
dataset analysis.
Total of Downloads: as observed in Figure 3a,
we noted that ”Tools” stands out as the category with
the highest median value, in absolute numbers, the
combined total downloads of the apps in the category,
”Tools” category remains in the spotlight, with 190
billion downloads. We believe this occurs because
this category comprises frameworks and libraries na-
tively present on Android devices. The graph also dis-
plays the categories considered, matching those in the
UID dataset.
App Rating: as illustrated in Figure 3b, most ap-
plications possess high ratings. Despite this, among
the considered popular apps, 248 are unrated. Addi-
tionally, the AID dataset includes significant metadata
such as ”Positive Reviews Examples” and ”Negative
Reviews Examples”, featuring selected examples of 1
and 5-star reviews from GPlay.
App Description: GPlay limits it to up to 4000
characters. Furthermore, with the process described
in section 3.1.2, we identified that 5379 (84%) are de-
scribed in English, and Figure 3c presents the other
apps described in another language. In AID, there
is also a ”Short Description” generated by AppBrain,
which more succinctly describes each app.
Required Android Version: as observed in Fig-
ure 3d, which disregards subversions, most apps aim
at intermediate Android versions.
Permissions: are divided into 11 metadata rep-
resenting categories close to those in the Play Store
and one extra. Figure 4, which shows the most
requested permissions, highlights the inconsistency
where ”full network access” permission is requested
by 6049 (95%) apps, although ”receive data from the
internet” is only required by 4584 (72%) apps.
6049
6019
5810
5239
5081
4795
4667
4584
4328
4316
4302
3946
2000
4000
6000
full network access
view network connecti.
prevent phone...sleeping
...foreground_service
...install_referrer_service
...gms.permission.AD_ID
test...protected storage
receive data from Intern.
modify....USB storage
view Wi-Fi connections
...post_notifications
run at startup
Figure 4: 10 most observed permissions required per app.
Technologies: divided into ”Social”, ”Ad” or
”Development tool” metadata, this metadata comes
from AppBrain’s in-depth analysis of each app and
allows an understanding of the development practices
used, which can be applied to new apps (Crussell
et al., 2014; Harty and M
¨
uller, 2019).
Changelog-Derived: is metadata derived from a
limited historical record of the app; it is divided into
”Release day”, ”Installations milestones”, ”Updates”,
”Unpublished day”, and ”Price over the time”.
Ranking: is divided into three metadata: (i)
”Most Downloaded Position in Category”, which is a
discrete numeric and measures the app’s global pop-
ularity among free apps; (ii) ”GPlay Current Global
Rank”, which is categorical ordinal and formulated by
GPlay; and (iii) ”Rank Country Category List”, which
is textual and presents ten main GPlay Ranking spe-
cific to countries, categories, and costs.
4.2 Exploration of UID Characteristics
Covering 100 different data points, 48 coming from
AID, and 49 binary identification of the presence of
components in the UI of 400 apps, the UID maps
trends among GPlay’s most popular software. The
graph 5a presents the proportional distribution of apps
depending on the category, as informed in the subsec-
tion 3.1.2. While the ”Tools” category has the highest
number of downloads in the AID dataset, it is less
prevalent in the UID dataset.
Datasets on Mobile App Metadata and Interface Components to Support Data-Driven App Design
429
399
394
391
358
313
304
270
268
257
251
0
15
0
30
0
45
0
15
8
9
15
13
6
14
8
15
12
8
11
10
16
7
10
14
12
10
18
9
12
17
18
16
12
13
12 12
16 16 16
0
5
10
15
20
(b) 10 most found components
by number of apps
48
45
42
29
21
20
9
7
5 5
0
20
40
60
(c) 10 least found components
by number of apps
38
29
19
51
156
17
16
74
0
40
80
120
160
200
(a) Proportional distribution of apps by GPlay category
(d) Frequency of characteristic
colors in apps
Figure 5: Set of relevant data present in the UID.
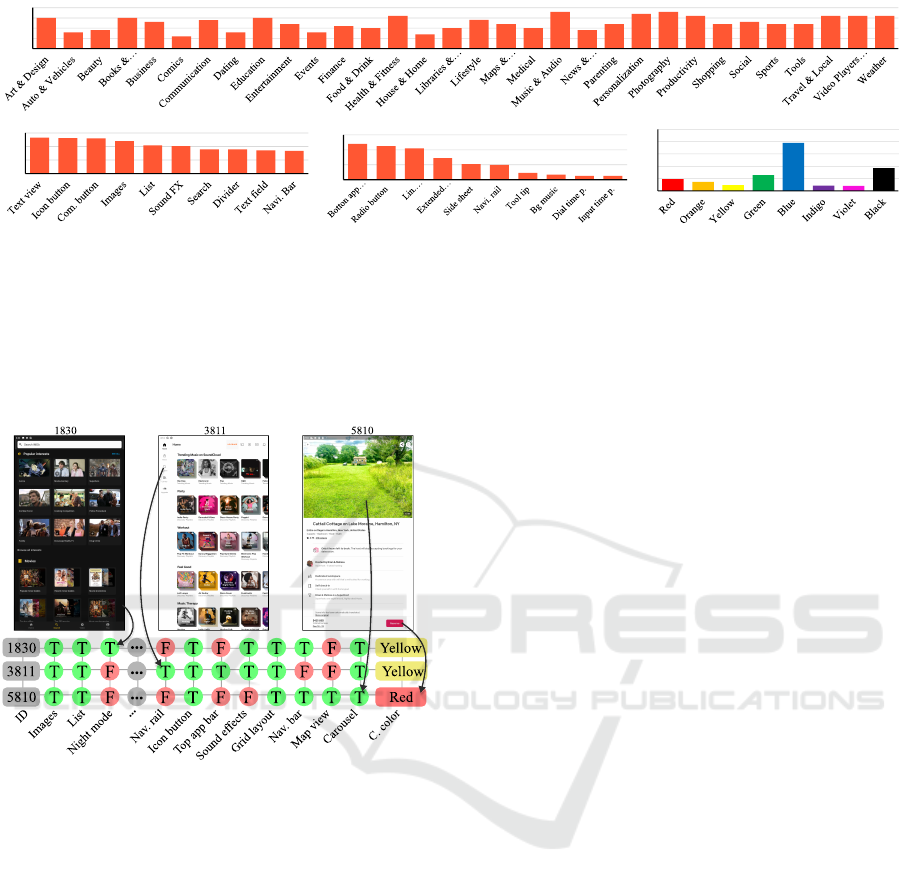
Figure 6 presents a dataset sample in which com-
ponents indicated as existing may not be visible in the
screenshots, highlighting the importance of analyzing
apps, not just a single screenshot.
Figure 6: UID sampling for IMDB (1830), Soundcloud
(3811) and Airbnb (5810) where F indicates that the com-
ponent is not identified and T indicates that it is.
Figure 5b illustrates the prevalence of basic com-
ponents among the 400 apps in the database. On the
other hand, the graphic of Figure5c highlights that the
components least found are those linked to more spe-
cific applications.
For a better understanding, we divided the com-
ponents into five categories. These categories were
created according to our observations during collec-
tion and mixed elements from the exclusive UID cat-
egories explained in Subsection 3.1.3. Below, each
category will be better explained.
Structural Components: are vital for app UIs
and include Text view, Common button, Icon button,
Images, Floating action button (FAB), Extended FAB,
Top app bar, Bottom app bar, Carousel, Grid layout,
Card list, List, and Divider. These elements, present
in all apps, are crucial for functionality and UX. Grid
Layout, the most specific, is predominantly associated
with entertainment apps like music and video.
Navigational Components: direct users to dif-
ferent windows and include Navigation rail, Naviga-
tion drawer, Navigation bar, Menu, Primary tab, Sec-
ondary tab, Search, Segmented buttons, and Chips.
These components, present in 388 apps, are typically
used independently, except for Search. The navi-
gation bar, for instance, appears in 251 apps but is
only paired with the Navigation rail in one. Addi-
tionally, Chips and Segmented buttons, intended for
filtering according to GMD, often function as naviga-
tion aids. Similarly, the ”Hamburger button” and ”3
vertical dots” sometimes open new windows instead
of the Navigation drawer or Menu, respectively.
Input Components: mainly found in app-specific
configuration menus, comprise Full-screen dialog,
Date picker, Dial time picker, Digital time picker,
Text field, Side sheet, Bottom sheet, Radio button,
Switch, Checkbox, and Slider. These components,
given the collection criteria used, are uncommon, ex-
cept for the Text field, found in 367 apps.
Informative Components: Informative compo-
nents serve to inform users about processes and op-
erations crucial for app usability and include: Circu-
lar progress indicator, Linear progress indicator, Pre-
loading indicator, Badge, Snackbar, Tool tip, Dialog,
and Sound effects. These components, present in 389
apps, are generally associated with specific actions or
operations and are uncommon, given the analysis cri-
teria. Progress indicators, such as the first three in
this category, rarely coexist. The Pre-loading indi-
cator often indicated content that differed from what
was loaded, which was confusing.
Other Components: contrast with the tangibility
and heterogeneity of other categories, being more ab-
stract but equally important in UX. Some of the more
abstract components are Account required, which
identifies the need for user authentication for use; So-
cial interaction, which identifies apps in which users
can interact with each other; Web component, which
identifies apps that present elements running outside
ICEIS 2024 - 26th International Conference on Enterprise Information Systems
430

the app’s internal environment (such as browsers);
Landscape mode identifies apps that non-mandatorily
shape their components to display in this format; De-
fault night mode identifies apps that predominantly
have darker backgrounds and/or text colors; Charac-
teristic color refers to a consistent color independent
of the displayed content that characterizes an app’s
UI and is mainly seen in Navigational components,
icons, badges, and primary tabs. Figure 5d shows
which colors were collected and the frequency among
the apps. For example, the app ’5810’ in Figure 6
showcases red as its characteristic color despite green
being the predominant color of the screenshot. In
addition to those previously mentioned, the ”Other
components” category, present in 353 apps (except
color), also includes Background music, Map view,
and Videos.
Screenshots: are focused on capturing numerous
components per app in portrait mode. On average,
each app has five screenshots, with a resolution of
1080x1920 pixels, 240 DPI, and an average size of
486 kilobytes. Despite emulating a GPS location,
many Ad providers tailored recommendations based
on our IP address, leading to uncensored ads in our
native language in the screenshots.
5 THREATS TO VALIDITY
While the tools, management techniques, principles,
and methodology employed in this study directly and
indirectly bolster data reliability, it is crucial to ac-
knowledge potential threats and limitations:
Internal Validity: The absence of a reevalua-
tion process for previously analyzed interfaces, cou-
pled with potential fatigue, heightens the risk of hu-
man errors. Although there were ranking changes for
some apps and category alterations for ten apps be-
tween the initial and definitive collection phases of the
AID, we preserved the initially identified categories
and rankings. None of the apps that underwent cat-
egory changes were included in the UID. Moreover,
the metadata for the UID was extracted up to 50 days
before the UI analysis. Given the dynamic nature of
GPlay, such modifications threaten the study’s valid-
ity.
Construct Validity: It is essential to highlight
that the 400 UID apps follow the proportions of cate-
gories and restrictions according to the reduced sam-
ple of 3251 free AID apps, considering the qual-
ity criteria defined in Subsection 3.1.2, therefore not
representing the actual distribution of GPlay apps.
Furthermore, considering the interface variations, the
scales adopted may bring nonconformities compared
to some devices on the market, as the smartphone
screen has a standardized resolution and proportion.
Moreover, advertisements influenced by the regional
and temporal context of the research may lead to
replication variations.
External Validity: As an indirect source of in-
formation, AppBrain, which does not publicly pro-
vide the tools used to collect data from the app,
may present non-conformities. For collecting the
UID, we could perceive the consistency of data, even
with restrictions on the information made available by
GPlay. Still, we cannot generalize this consistency
to AID since we do not access the GPlay pages of
apps outside the UID. Furthermore, developers may
misdescribe their apps, as we found apps requiring a
newer version of Android, even though GPlay guaran-
tees support for the version used in the emulator. Rat-
ings, employed as a quality metric, may not necessar-
ily reflect an objective assessment of an app’s intrinsic
quality, as they can be influenced by factors such as
changes in billing practices or app architecture. Ad-
ditionally, although our data extraction method can
be applied to any app stores, our empirical results
are specific to the free apps from GPlay. More work
would be needed to ascertain whether these findings
extend to other periods, app stores, or paid apps.
6 CONCLUSIONS
Our study focuses on providing a comprehensive col-
lection of information from mobile Android apps. It
presents two massive datasets, the AID and UID, tar-
geting both app developers and researchers. This
work distinguishes itself in the literature by detail-
ing the process of selecting and collecting apps, in-
creasing transparency, and valuing the replicability
and continuity of the study.
The data collected is an innovation in mobile de-
vices and design that analyzes the main functions of
applications and the characteristic colors used in apps,
going beyond a single screenshot. Furthermore, the
amount of metadata collected presents an improve-
ment, as, to the best of our knowledge, this is the work
with the largest amount of different metadata col-
lected to date. Analyzing this metadata alone presents
great compression potential for popular GPlay apps.
Additionally, the union of this metadata with the com-
ponent data identified in the interfaces in the UID,
which expands a widely used design pattern, charac-
terizes an evolution of knowledge regarding the struc-
ture of the multiple screens of each app and its rela-
tionship with the information recorded by the devel-
opers and users in app stores.
Datasets on Mobile App Metadata and Interface Components to Support Data-Driven App Design
431

Although our main focus in the work was the pre-
sentation of the datasets, future research could ex-
plore their insights and applications. In the AID anal-
ysis, we noticed many government apps indicating the
inclination toward modernization and digitalization of
government services. Despite this, few of these apps
were analyzed to create the UID, indicating a possible
lower concern about the usability of these apps. On
the other hand, during the UID collection, we noticed
the constant presence of Indian apps, indicating the
quality and popularity of the services provided by sev-
eral companies in India. Another point also noted dur-
ing the collection was the dependence and indepen-
dence of components that generally follow a pattern,
different from the mistaken implementation by some
apps, of different components and icons with func-
tions different from those traditionally described, not
necessarily being linked to the context of regional use
of apps. In future analyses, machine learning tech-
niques can be employed to analyze the relationships
between app metadata and UI components, paving the
way for automated app design and optimization.
It is possible to expand the datasets further, espe-
cially the UID. Quantitatively, we can cover an even
more significant number of apps, delving into specific
categories or applications, balancing or maintaining
category proportions, and increasing data reliability.
Additionally, we can extract more data or identify
new ones from the available data, using techniques
and tools to, for example, map components or clas-
sify the aesthetics of a screenshot (Liu et al., 2018;
de Souza Lima et al., 2022).
ACKNOWLEDGEMENTS
This study was financed in part by the Coordenac¸
˜
ao
de Aperfeic¸oamento de Pessoal de N
´
ıvel Superior
- Brasil (CAPES) - Finance Code 001, and sup-
ported by the Conselho Nacional de Desenvolvimento
Cient
´
ıfico e Tecnol
´
ogico (CNPq).
REFERENCES
Bunian, S., Li, K., Jemmali, C., Harteveld, C., Fu, Y., and
Seif El-Nasr, M. S. (2021). Vins: Visual search for
mobile user interface design. In Proceedings of the
2021 CHI Conference on Human Factors in Comput-
ing Systems, CHI ’21, New York, NY, USA. ACM.
Crussell, J., Stevens, R., and Chen, H. (2014). Madfraud:
investigating ad fraud in android applications. In Pro-
ceedings of the 12th Annual International Conference
on Mobile Systems, Applications, and Services, Mo-
biSys ’14, page 123–134, New York, NY, USA. ACM.
da Cruz Alves, N., Kreuch, L., and von Wangenheim, C. G.
(2022). Analyzing structural similarity of user inter-
face layouts of android apps using deep learning. In
Proceedings of the 21st Brazilian Symposium on Hu-
man Factors in Computing Systems, IHC ’22. ACM.
de Souza Lima, A. L., Martins, O. P. H. R., von Wangen-
heim, C. G., von Wangenheim, A., Borgatto, A. F.,
and Hauck, J. C. R. (2022). Automated assessment of
visual aesthetics of android user interfaces with deep
learning. In Proceedings of the 21st Brazilian Sympo-
sium on Human Factors in Computing Systems, IHC
’22, New York, NY, USA. ACM.
Deka, B., Huang, Z., Franzen, C., Hibschman, J., Afergan,
D., Li, Y., Nichols, J., and Kumar, R. (2017). Rico:
A mobile app dataset for building data-driven design
applications. In Proceedings of the 30th Annual ACM
Symposium on User Interface Software and Technol-
ogy, UIST ’17. ACM.
Fonseca, J. S. d. and Martins, G. A. (2016). Curso de esta-
tistica. Atlas, 6nd edition.
Harty, J. and M
¨
uller, M. (2019). Better android apps us-
ing android vitals. In Proceedings of the 3rd ACM
SIGSOFT International Workshop on App Market An-
alytics, ESEC/FSE ’19. ACM.
Kabir, M. S. and Arefin, M. S. (2019). Google play store
data mining and analysis. vol, 12:1–5.
Kortum, P. and Sorber, M. (2015). Measuring the usabil-
ity of mobile applications for phones and tablets. In-
ternational Journal of Human-Computer Interaction,
31(8):518–529.
Li, K., Xu, Z., and Chen, X. (2014). A platform for search-
ing ui component of android application. In 2014 5th
International Conference on Digital Home. IEEE.
Liu, T. F., Craft, M., Situ, J., Yumer, E., Mech, R., and Ku-
mar, R. (2018). Learning design semantics for mobile
apps. In Proceedings of the 31st Annual ACM Sym-
posium on User Interface Software and Technology,
UIST ’18, page 569–579, New York, NY, USA. ACM.
Nielsen, J. and Budiu, R. (2015). User experience for mo-
bile applications and websites. Design Guidelines,
506.
Prakash, G. and Koshy, J. (2021). Google play store
apps. https://www.kaggle.com/datasets/gauthamp10/
google-playstore-apps/data.
Statista (2023). Global smartphone penetration rate as share
of population from 2016 to 2021. [Accessed 22-Jan-
2024].
Wang, B., Li, G., Zhou, X., Chen, Z., Grossman, T., and
Li, Y. (2021). Screen2words: Automatic mobile ui
summarization with multimodal learning. In The 34th
Annual ACM Symposium on User Interface Software
and Technology, UIST ’21. ACM.
ICEIS 2024 - 26th International Conference on Enterprise Information Systems
432
