
A Distributed Processing Architecture for Disease Spread Analysis in the
PDSA-RS Platform
Denilson S. Ebling
1 a
, Felipe Machado
1 b
, Glenio Descovi
1 c
, Nicolas Cardenas
2 d
,
Gustavo Machado
2 e
, Vinicius Maran
1 f
and Alencar Machado
1 g
1
Laboratory of Ubiquitous, Mobile and Applied Computing (LUMAC), Federal University of Santa Maria,
Roraima Av. 1000, Santa Maria, Brazil
2
Department of Population Health and Pathobiology, College of Veterinary Medicine, North Carolina State University,
Raleigh, U.S.A.
Keywords:
Intelligent Systems, Decision-Support Systems, Diseases Control, Outreabk Control.
Abstract:
In today’s world, machine learning systems have permeated various domains, from object detection to disease
spread prediction, playing pivotal roles in decision-making processes. Amid the COVID-19 pandemic, the
utilization of machine learning methods like artificial neural networks and LSTM networks has significantly
enhanced forecasting accuracy for disease outbreaks. This paper delves into the development of an intelligent
system proposed by Cardenas et al. (2022a), focusing on simulating disease spread in animals and facilitating
control measures through a stochastic model. Leveraging Docker containers for deployment, this system offers
valuable insights for public health interventions, enabling swift responses to disease outbreaks. The primary
objective of this work is to provide veterinarians with a user-friendly tool that integrates a stochastic model
through an intuitive interface, aiding in critical decision-making processes in a scalable manner. The paper
outlines the background of the stochastic model, introduces the proposed system for integrating and addressing
the identified problem, presents an evaluation scenario to validate the system’s efficacy, and concludes with
insights drawn from this research endeavor.
1 INTRODUCTION
Machine learning systems had become increasingly
present in today’s world in all kinds of domains, rang-
ing from object detection, prediction of weather, play-
ing games like chess or go (Silver et al., 2017b,a;
Mnih et al., 2013) prediction of a disease spread pat-
tern or even to self-driven cars. As stated by Adadi
and Berrada (2018), AI has already become ubiqui-
tous, and we have become accustomed to AI making
decisions for us in our daily life, from product and
movie recommendations on Netflix and Amazon to
friend suggestions on Facebook and tailored adver-
tisements on Google search result pages.
a
https://orcid.org/0000-0002-3094-5991
b
https://orcid.org/0009-0005-8179-1987
c
https://orcid.org/0000-0002-0940-9641
d
https://orcid.org/0000-0001-7884-2353
e
https://orcid.org/0000-0001-7552-6144
f
https://orcid.org/0000-0003-1916-8893
g
https://orcid.org/0000-0002-6334-0120
Disease spread prediction systems have gained
significant attention in recent years, particularly in
the context of the COVID-19 pandemic, as they of-
fer valuable insights for controlling the spread of in-
fectious diseases and allocating resources for research
and development. Machine learning methods, such as
artificial neural networks and long short-term mem-
ory (LSTM) networks, have been increasingly em-
ployed in time series forecasting and predicting the
number of daily cases, deaths, and recovered cases
of diseases like COVID-19. These models can help
public health professionals and policymakers make
informed decisions based on the analysis and predic-
tions provided by the models, ultimately contributing
to the effective control of disease outbreaks.
The implementation of intelligent systems plays a
pivotal role in the control and prevention of animal
diseases, significantly impacting public health. This
encompasses a range of strategic interventions, in-
cluding animal vaccination, vector control, stringent
hygiene protocols, and disease surveillance in ani-
Ebling, D., Machado, F., Descovi, G., Cardenas, N., Machado, G., Maran, V. and Machado, A.
A Distributed Processing Architecture for Disease Spread Analysis in the PDSA-RS Platform.
DOI: 10.5220/0012742700003690
Paper published under CC license (CC BY-NC-ND 4.0)
In Proceedings of the 26th International Conference on Enterprise Information Systems (ICEIS 2024) - Volume 2, pages 313-320
ISBN: 978-989-758-692-7; ISSN: 2184-4992
Proceedings Copyright © 2024 by SCITEPRESS – Science and Technology Publications, Lda.
313

mals. The globalization and extensive trade in ani-
mals and their products have heightened the global
spread of zoonotic diseases, underscoring the urgent
need for robust prevention and control strategies to
avert potential epidemics. Moreover, the operational
dynamics within farms introduce inherent risks for
disease transmission. Factors such as the segrega-
tion of animal groups, human and vehicular traffic
patterns, as well as the spatial layout of farms, can
significantly influence the potential transmission of
diseases. For instance, the proximity of animal lots
can facilitate disease spread, while effective isolation
measures can help contain outbreaks. Human and ve-
hicular movement on farms can introduce pathogens,
emphasizing the importance of biosecurity measures.
Additionally, the spatial organization of farms can im-
pact pathogen dissemination, highlighting the need
for tailored control measures to mitigate disease trans-
mission risks effectively (Galvis et al., 2022).
In this area, Cardenas et al. (2021) proposed an
intelligent system that uses real data to simulate the
spread of diseases in animals (e.g., cattle, swine, and
small ruminants) and allows researchers to test differ-
ent actions to control these diseases. When the anal-
ysis is complete, the system makes the model avail-
able on a user interface for further action. This sys-
tem addresses the challenges of controlling the spread
of infectious diseases and provides valuable insights
for public health interventions. The use of Docker
containers for packaging the machine learning models
allows for easy deployment and scalability, enabling
rapid response and widespread intervention in situa-
tions where rapid deployment is necessary, such as
disease outbreaks. The development of disease spread
prediction systems using machine learning methods
offers a promising approach for controlling the spread
of infectious diseases and allocating resources for re-
search and development. By understanding the archi-
tecture of deployment of machine learning models in
this context, we can better control the spread of dis-
eases and mitigate their impact on society.
With that in mind, the objective of this work is
to build a tool to help veterinaries uses a stochas-
tic model thought a friendly interface that helps them
in critical decision-making situations and works on a
scalable way.
The disease control system serves as a valuable
tool; however, its current design caters primarily to
users with programming expertise who can navigate
the installation of dependencies and interact with it
through a programming interface. This is evident in
its distribution as a downloadable library, which ne-
cessitates a certain level of technical proficiency. Fur-
thermore, the system’s analysis demands substantial
computational resources, with tests indicating a re-
quirement of over 4GB of RAM for a single analysis
to run effectively. This high technical barrier poses a
significant challenge for widespread adoption, partic-
ularly among veterinary professionals who may lack
programming skills. Accessing and utilizing the sys-
tem not only demands knowledge of livestock dis-
eases and epidemiology but also proficiency in the
system’s programming language. Addressing this is-
sue was the primary impetus behind this research en-
deavor: to enhance accessibility for epidemiologists
by enabling them to input their data efficiently into
the existing tool developed by Descovi et al. (2021).
The present paper is structured as follows. Section
2, presents the background, giving a brief introduction
about the stochastic model developed by Cardenas
et al. (2021) that models the disease spread and con-
trol system, and presents the problem that this work
will pursue. Section 3 describes the proposed sys-
tem to integrate the model and provide a solution to
the problem described. Section 4 describes our eval-
uation, a evaluation scenario to validate the system.
Section 5 outlines the conclusions of this work.
2 BACKGROUND AND
MOTIVATION
This section provides an overview of the Disease
Spread and Control System utilized in this study,
highlighting the existing challenges that will be ad-
dressed within this research.
2.1 Disease Spread and Control System
(Cardenas et al., 2022a, 2021, 2022b) introduced a
model designed to demonstrate the potential for the
spread of infectious animals within livestock popula-
tions, considering transmission via animal movement.
This model incorporates simulations of various con-
trol actions, such as preventing farm entry or exit of
infected animals (e.g., culling, isolation of animals),
enhancing hygienic practices, or implementing vacci-
nation programs.
This system offers an opportunity for users to
forecast the impact of infectious outbreaks and de-
velop proactive strategies to mitigate risks. By lever-
aging computational modeling, the system provides
insights into the dynamics of disease propagation un-
der diverse scenarios, enabling stakeholders to make
informed decisions regarding prevention, interven-
tion, and response efforts. The core functionality of
the system lies in simulating the spread of infectious
agents among livestock populations while accounting
ICEIS 2024 - 26th International Conference on Enterprise Information Systems
314
for factors like animal movement patterns, biosecurity
measures, and environmental conditions. Users can
input real-world data related to animal demographics,
geographic locations, and historical disease occur-
rences, allowing them to generate customized models
tailored to specific regional needs.
Once a model is created, users can explore various
what if scenarios by testing alternative control action
plans against the simulated outcomes. For instance,
they might examine the consequences of imposing
quarantine zones around affected farms, assessing the
efficacy of targeted vaccination campaigns, or analyz-
ing the cost-benefit tradeoffs associated with differ-
ent control options. By providing a comprehensive
decision support framework, the system empowers
policymakers, veterinary practitioners, and producers
alike to anticipate and respond effectively to emerg-
ing threats posed by infectious diseases in livestock
populations. This work focuses on using this model
to provide a tool for veterinaries to take actions and
explore scenarios, helping them in critical decision-
making situations.
2.2 Animal Movement Representation
The system uses Social Network Analysis (SNA)
methods to characterize animal trade patterns, and the
between-farm total of animals moved is represented
in the system as a directed graph, where each farm
is represented as a node, and the movements among
farms are represented as edges. Each edge connects
a specific node origin to a specific node destination,
also maintaining the type and number of animals be-
ing moved. An example of graph movement repre-
sentation is shown in Figure 1.
Figure 1: Between-farm animal movement graph.
The system maintains an event dataset with data
on the origin, destination, type, and number of ani-
mals, which is used to construct the movement graph.
The between-farm movements among farms of dif-
ferent species, therefore considering a real multi-host
contact network of movement data collected.
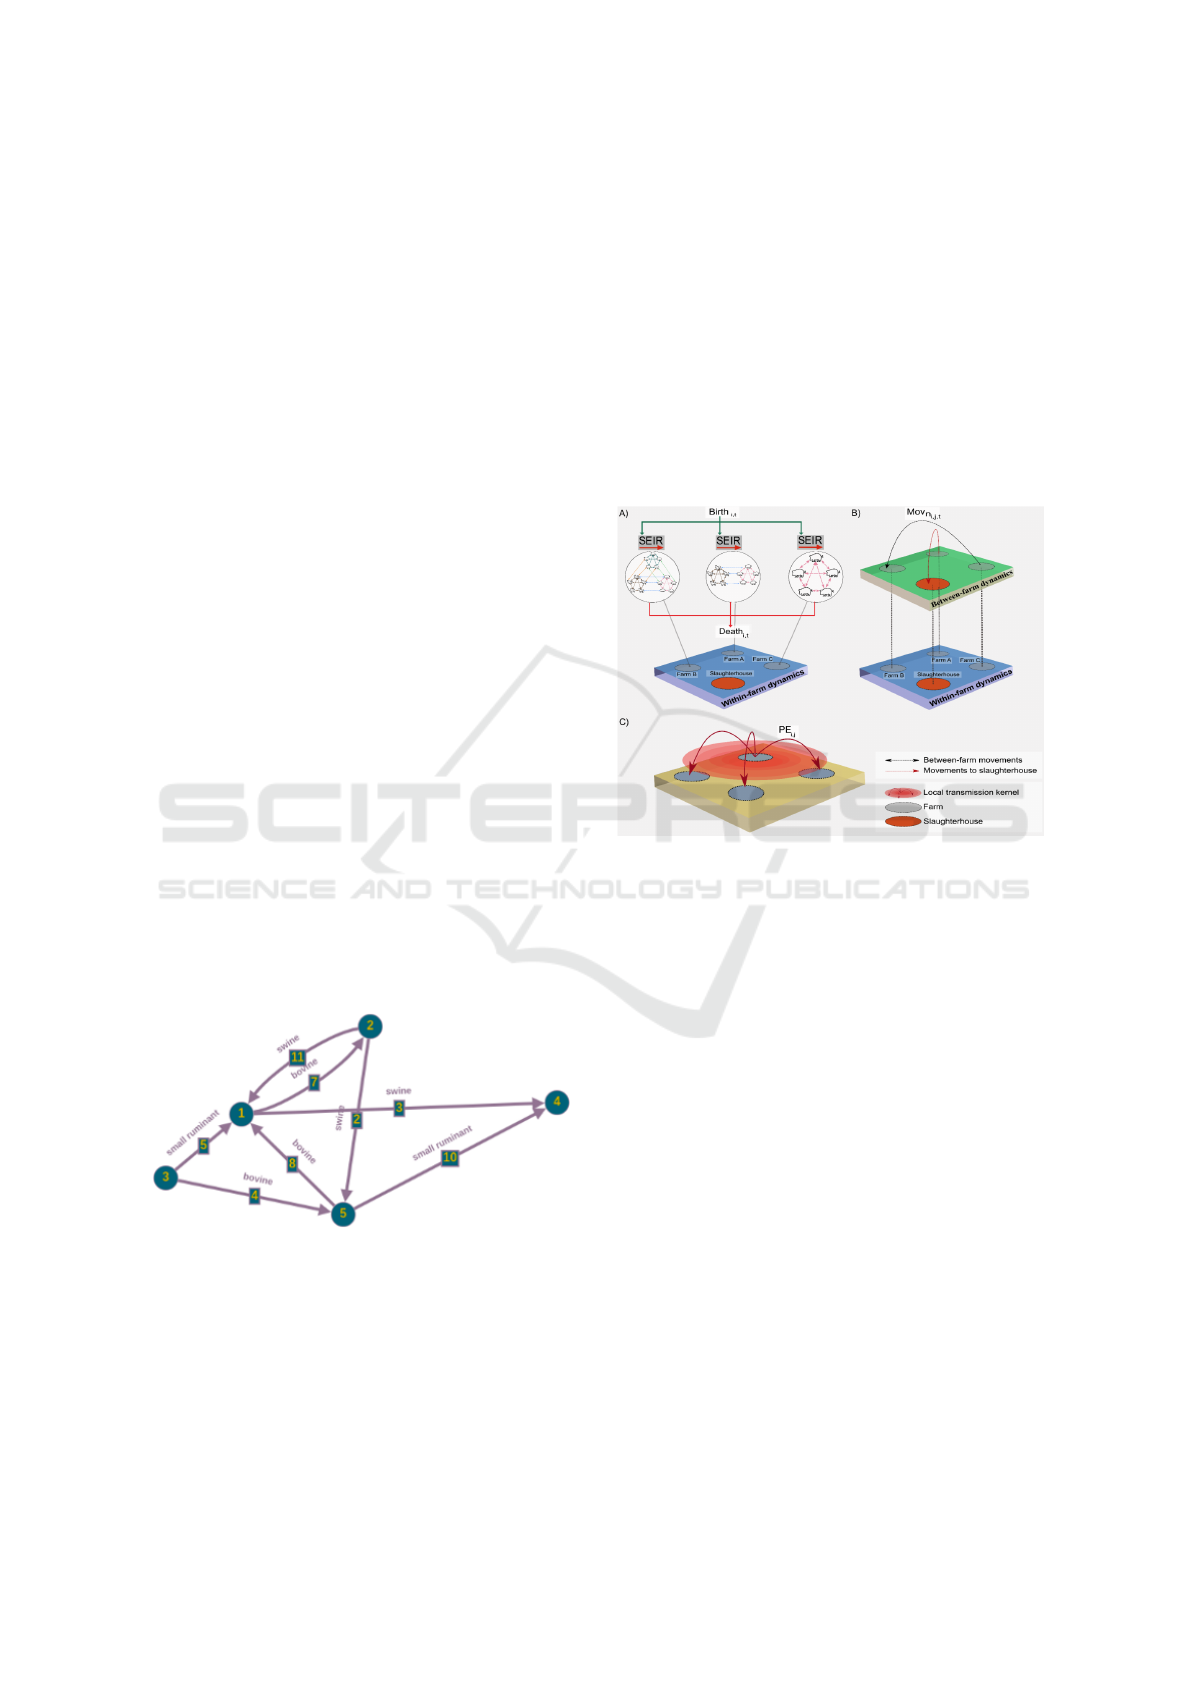
2.3 Disease Spread Dynamics
The system applies a stochastic simulation algorithm
(SSA) to simulate the disease spreading, as well as,
vital dynamics (birth and deaths) of animals inside
each farm. The system incorporates within farm and
between farm dynamics through a susceptible infec-
tious model using the temporal animal movement data
explicitly with a higher effective contact rate to en-
sure an efficient disease transmission over the simula-
tions. Figure 2 illustrates the transition of states dur-
ing within-farm and between-farm dynamics on the
model.
Figure 2: Disease spreading simulation (Cardenas et al.,
2022a).
2.4 Control Action Zones
After an initial covert proliferation wherein animals
on select farms contracted the disease, expedient con-
trol and confinement of the pathogen are paramount
for eliminating the infection and fostering recupera-
tion. Measures such as quarantining and regulating
animal movements serve to shield animal health, im-
peding the transmission of illness to uncontaminated
populaces (Roth, 2007). These actions are executed
within designated control regions, whose boundaries
are determined via user parameters. However, despite
the effectiveness of these measures, there remains a
pressing need to streamline and simplify the applica-
tion process for veterinary practitioners. Currently,
the implementation of these controls requires special-
ized knowledge and technical competency, limiting
the reach and utility of these measures among the
broader veterinary community. To bridge this gap,
this research aims to develop a user-friendly platform
that seamlessly integrates the Disease Spread and
Control System, allowing veterinary professionals to
effortlessly apply these protective measures with min-
A Distributed Processing Architecture for Disease Spread Analysis in the PDSA-RS Platform
315

imal technical expertise required.
2.5 Vaccination
Within the system, the vaccination process is simu-
lated throughout the course of disease spread. Upon
vaccination, animals transition from the Susceptible-
Exposed-Infectious-Recovered (SEIR) compartments
to a distinct Vaccinated (V) compartment. This segre-
gation allows us to precisely track the impact of vac-
cination on disease spread within the population.
The transition of animals into the V compartment
is influenced by two key factors: the efficacy of the
vaccine and a user-defined daily conversion rate for
control actions. The efficacy of the vaccine deter-
mines its ability to confer immunity, affecting the pro-
portion of vaccinated animals protected from infec-
tion. Meanwhile, the daily conversion rate dictates the
pace at which susceptible individuals are vaccinated,
thus influencing the rate of accumulation within the V
compartment over time
3 RELATED WORKS
In this section, we present a brief overview of two
related works that have similar goals to our research,
but it end fail to provide a suitable solution for our use
case.
The Australian Animal Disease Spread
Model (Bradhurst et al., 2015), AADIS, is a de-
cision support tool that assists in the formulation
of policies and response strategies for emergency
animal diseases. The model integrates mathematical,
agent-based, network, and cellular automata mod-
elling approaches to simulate the incursion, detection,
surveillance, control, and proof-of-freedom of emer-
gency animal diseases. AADIS is designed to provide
valuable insights into the spread and management
of animal diseases, aiding in the development of
effective response strategies.
The Animal Disease Spread Model (Schoenbaum
et al., 2024), (ADSM), is a stochastic, spatially ex-
plicit compartmental model that simulates the spread
of highly contagious animal diseases between herds.
Developed by the USDA-APHIS-VS-CEAH, ADSM
is designed to evaluate different control strategies,
provide recommendations on resource allocation, and
estimate the economic impacts of disease control op-
tions. The model is based on the North American Dis-
ease Spread Model (NAADSM) and has been used to
simulate foot-and-mouth disease (FMD) outbreaks in
the United States, focusing on stamping-out, slaugh-
ter, and vaccination control strategies. ADSM is built
in Django and Python and presented as a web applica-
tion, allowing users to interact with the model through
a user-friendly interface. The model uses multithread-
ing to maximize system utilization and provides de-
tailed outputs and supplemental outputs for further
analysis.
The two works presented in this sections provide
a model for a dieases spread, and a UI for users. The
main problems with both works is that they provide a
application to be run in the machine of the user, be-
ing a desktop focused application, wheere a end-user
not only would need to setup their environment to be
able to run the application, have a good knowledge
of the disease and the model to be able to use the ap-
plication, and also have a good enought machine to
run the simulation. This issues makes the application
not user friendly and insuitable for our use case. With
that problem also comes the fact that the models are
closed source, so we can’t use the code to make our
own changes and provide a application for the user,
making both works not suitable for our use.
4 ARCHITECTURE APPROACH
The proposed solution for analyzing the spread of dis-
ease in a farm scenario is a web system that com-
bines a user interface (UI), an application program-
ming Interface (API), and a Python machine learning
model to provide a comprehensive and user-friendly
platform for tracking and predicting the spread of dis-
eases. The system consists of 3 main components,
a client API that will integrate with the system, the
model’s API which will dispatch, manage and scale
an instance of the model, and the model itself.
The client API will be the system that holds the
data, and want to integrate the model. The client API
has the data about premises, movement and events,
and can use it to query the model’s API to create and
view analysis. Besides having the data to analyze,
the only required implementation on this component,
is that it needs to know how to communicate with a
RESTful(Ehsan et al., 2022) API.
The stochastic model is originally implemented as
a library Cardenas et al. (2021), so the next compo-
nent is a thin wrapper around the model that provides
two important capabilities that allow it to be managed
by the API: A ability to be run as a Docker(Merkel,
2014) container, and a JSON-based based protocol for
communication via STDIO. The ability to be run as
a Docker container is fundamental, where that will
be used to scale the model the instances, and en-
able the API to control its resources, and the JSON-
based based protocol that allows the API to moni-
ICEIS 2024 - 26th International Conference on Enterprise Information Systems
316

tor communicate with it to get real-time data about
the progress of an analysis. The choice of using the
STDIO transport, instead of TCP or other common
transport mechanism was heavily inspired by the Mi-
crosoft’s Language Server Protocol (LSP) implemen-
tations, where the most of the implementations use
the STDIO to communicate with an editor using a
JSON-based based protocol to send information about
a project. With this, we get a RESTful APIs commu-
nicating with JSON protocol and the model commu-
nicating also with a JSON protocol but via STDIO
with the Model’s API, this is illustrated in Figure 3,
where it shows the type of communication between
the components.
The model’s API is the entrypoint to access the
stochastic model capabilities, is responsible to spawn,
schedule, and managing the request for analysis us-
ing the model. It’s implemented as a RESTful API
that communicates with the client API for data man-
agement to provide real-time updates on the dis-
ease spread predictions and the impact of intervention
strategies. Its main concern is to bridge client APIs
and the disease spread model. It does that by manag-
ing a pool of workers for the model, where when an
analysis request is made, the job is dispatched to this
pool, where each work is run as a Docker container.
The API spawns and monitor this container STDOUT
stream, parsing its log messages containing JSON in-
formation, with this the API gets real-time data about
the progress of the model. Another important role of
this API is to aggregate the result of multiple workers.
Some analysis requests will need to dispatch hundreds
of instances of the model, and the result of the con-
tainer needs to be aggregated in representation of the
mean result of the all model instances. THe API does
that by persisting the data about the running models
in a relational database, where later will be queried to
provide the results for the client APIs. With this, it
provides a scalable model to run the stochastic mod-
els, where the work can be dispatched into a Docker
cluster to run.
With all components together, an analysis can be
made starting from the client API, where it will send
data to be analyzed to the model’s API, together with
the parameters to run the model. The model’s API
will spawn N workers to run this analysis, monitoring
and aggregating its output. In the meantime, the client
can query the API to get real-time progress about the
analysis, and when it’s done, will have full access to
the output of the model. This flow of the process is
illustrated in Figured 4
In conclusion, the proposed solution combines
multiple technologies, to provide a scalable solution
to running a stochastic model. This system offers
valuable insights for controlling the spread of dis-
eases and allocating resources for research and devel-
opment.
5 CASE STUDY SCENARIO
To evaluate the feasibility of the approach, and im-
plementation developed, a case study was developed,
This case study aims to demonstrate the use of our
application in a scenario where there’s a suspect of
a disease outbreak on premises. This application has
the main goal of helping veterinaries combat and con-
trol outbreaks proactively.
This fictional scenario is based in the everyday
work of state veterinaries in Brazil, that aims to as-
sess the effective of the application in helping the vet-
erinary control and identify other farms that could be
affected.
For the case study, the following scenario was
considered for describing the approach supported by
the developed application. Imagine ”John”, John
is official Veterinary of the State, in Brazil. As a
State Veterinary, ones of this many tasks is to audit
premises and certify that they are clean from common
diseases that could be detrimental to the livestock pro-
duction ecosystem.
One day, while conducting routine audits, John is
notified that there is simptons of a disease in Arnold’s
premises. Suspicious symptoms in some animals and
unusual mortality rates raise concerns. Recognizing
the urgency of the situation, John swiftly takes sam-
ples and sends them for testing to confirm the pres-
ence of a contagious disease.
Upon receiving the test results, John logs into the
PDSA-RS’s (Descovi et al., 2021) system to use the
disease control module to help him plan his actions.
The system provides a user-friendly interface where
he inputs the confirmed case and the relevant details.
Leveraging the application’s advanced algorithms, it
quickly analyzes the data, considering factors such
as geographical proximity, animal movement records,
and environmental conditions.
In a matter of minutes, the application generates a
comprehensive report outlining the potential risk and
identifies other premises at high risk of being affected
by the outbreak. The predictive modeling algorithms
take into account various factors, including animal
transportation networks, wind patterns, and historical
disease spread data. This gives John various infor-
mation, showing how this disease will spread infect
premises around even from other species, this is illus-
trated in Figure 5.
John is presented with a map highlighting the
A Distributed Processing Architecture for Disease Spread Analysis in the PDSA-RS Platform
317
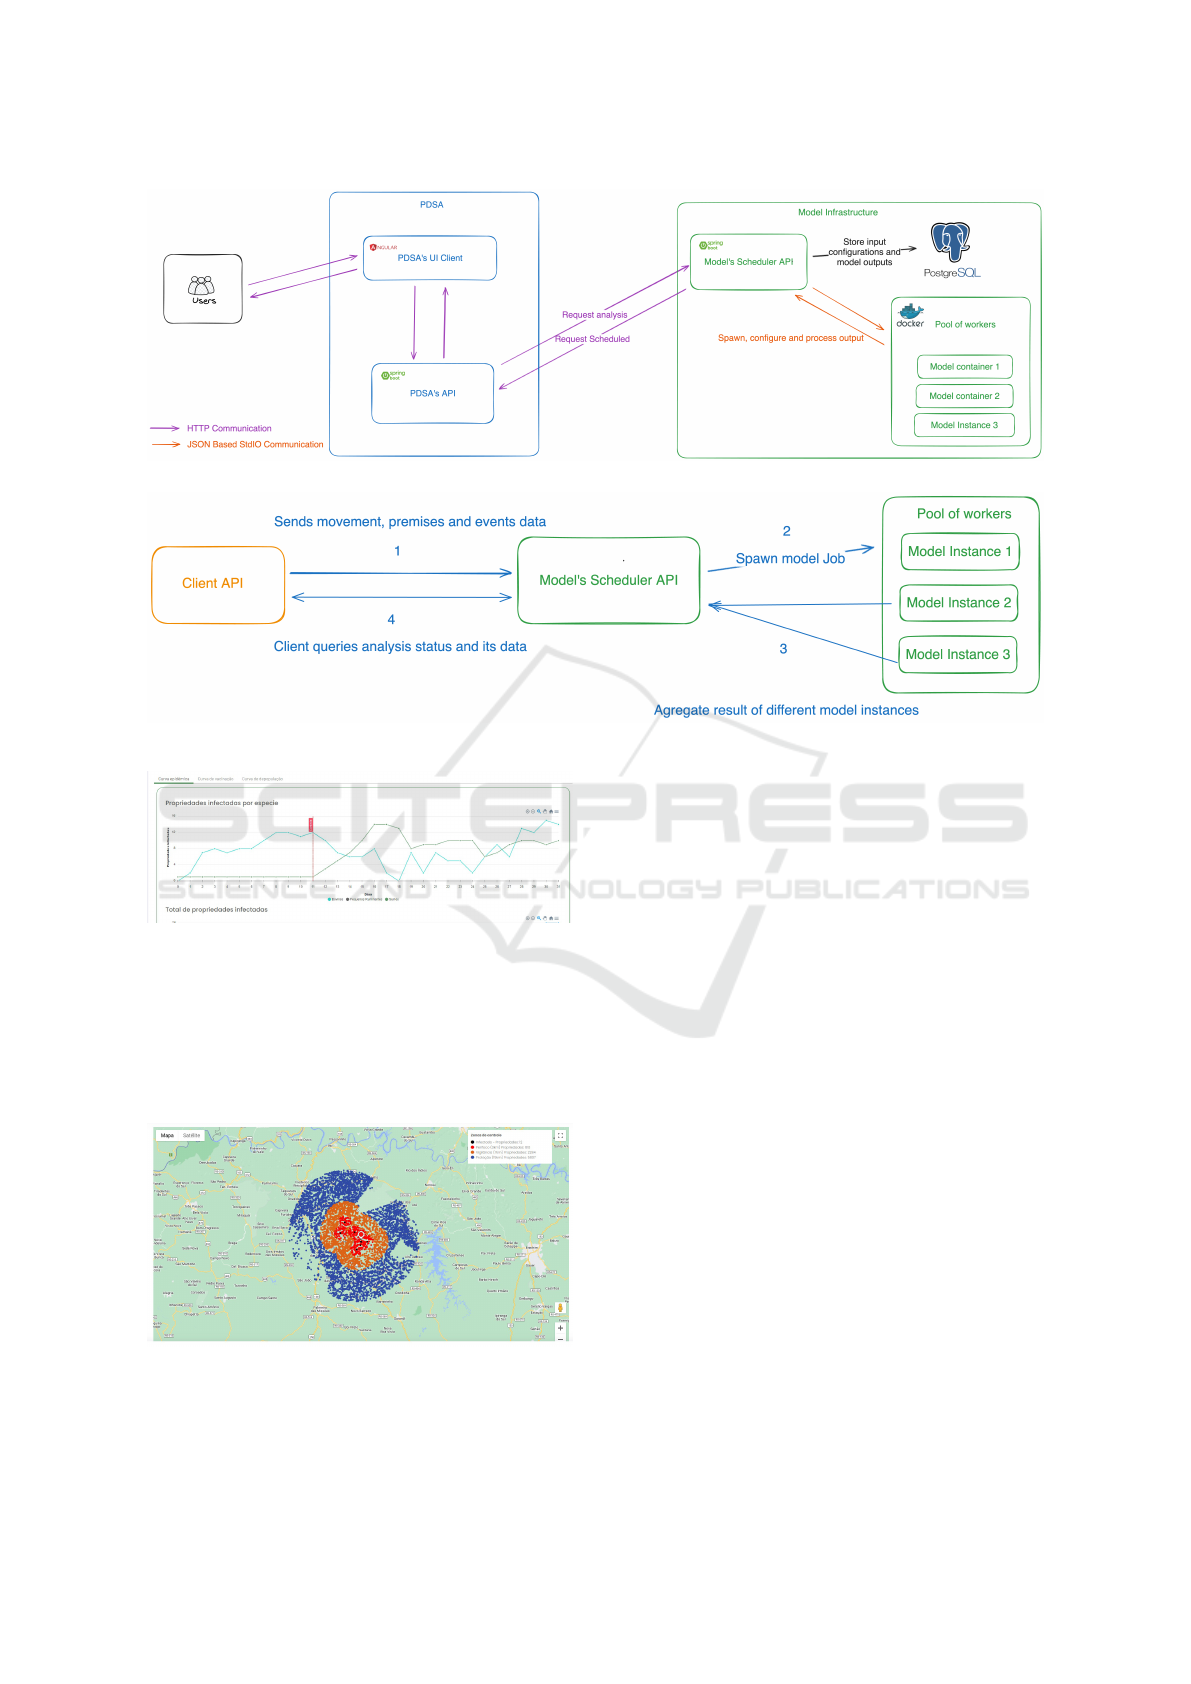
Figure 3: System architecture diagram.
Figure 4: Communication flow between the client and the model’s API to create a analysis.
Figure 5: Application showing a line plot illustrating the
amount of infected premises over time.
farms most susceptible to the contagion, as shown
in Figure 6. The system also provides an estimated
timeline for potential outbreaks on these identified
premises, allowing John to prioritize and plan emer-
gency response measures effectively.
Figure 6: Application showing a disease spread map.
To plan his actions, John, uses the control actions
feature of the application, where it lets him apply ac-
tions to a set of premises and see what’s the impact
of the actions to control the outbreak of that diseases.
This becomes an iterative process, where the vet will
update the system with the current state of the spread
of the diseases, use the system to help plan the next
actions, execute the actions and restart the process
until the outbreak is contained. This process is illus-
trated on Figure 7.
Equipped with this vital information, John ini-
tiates immediate communication with the identified
farms, informing them of the potential threat and ad-
vising precautionary measures. The system’s real-
time capabilities enable John to monitor the situation
as it unfolds, receiving updates on the progression of
the outbreak and making informed decisions to con-
tain its spread.
Under the hood, everytime that the user create a
new analysis or updates one with the current infected
data, the system undergoes the following process to
produce a report:
• PDSA-RS requests a new analysis, by sending the
premises, movement and events data to the model
api.
• The model’s Scheduler API will create one or
more docker containers, running the model in-
stances using a pool of workers algorithm. Here
the API will spawn a new job and propagate the
data to them.
ICEIS 2024 - 26th International Conference on Enterprise Information Systems
318
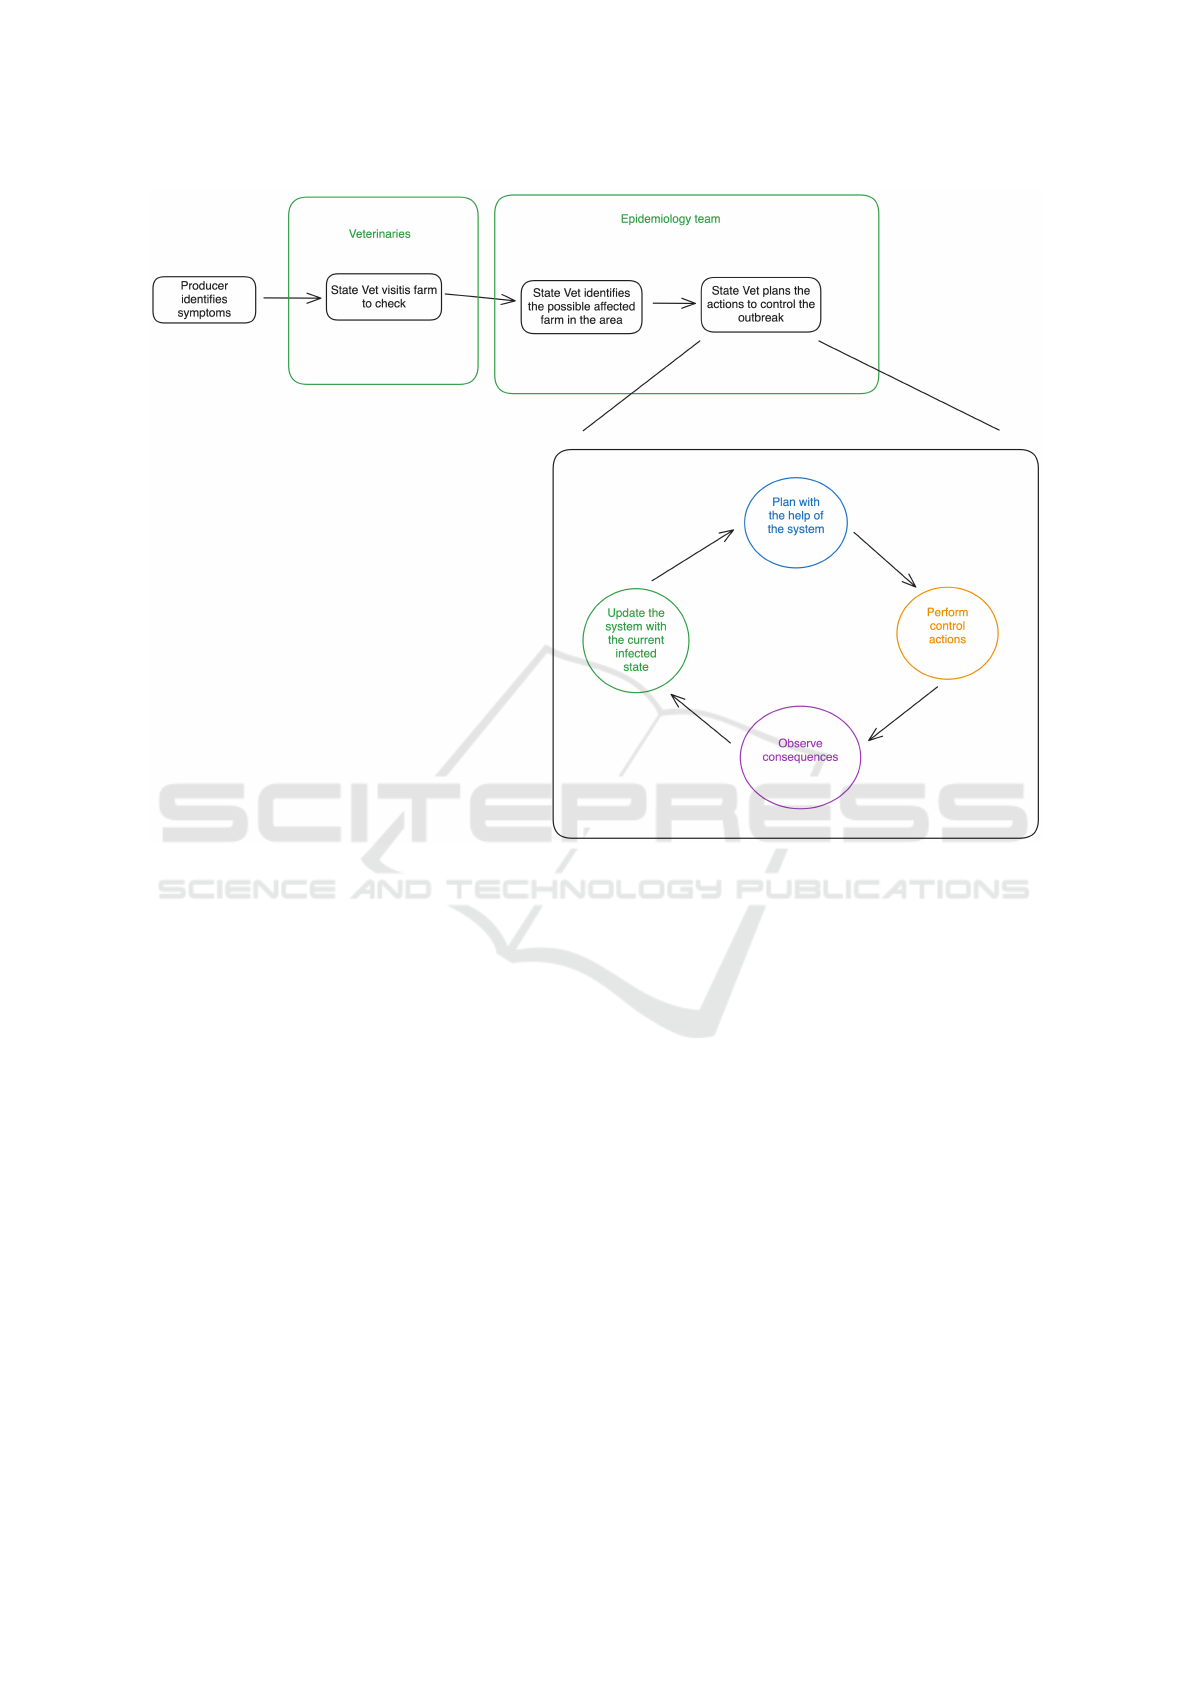
Figure 7: Process to control an outbreak of a disease.
• The API will aggregate the output of all model
instances and its store the final data.
• While the Scheduler is doing its works, the
PDSA-RS will query its status, and when its ready
will request the processed result of the analysis
In this way, the application proves instrumen-
tal in empowering veterinarians like John to respond
rapidly and strategically to disease outbreaks, mini-
mizing the impact on livestock and safeguarding the
overall health of the agricultural ecosystem. The
scenario showcases the practicality and effectiveness
of the developed application in a real-world setting,
demonstrating its potential to revolutionize disease
control efforts in the livestock industry.
6 CONCLUSIONS
This case study was successful, on this work we built
a tool that helps veterinaries make critical decisions
and explore possibilities in advents of an outbreak of
a diseased, allowing them to make confident decisions
to control and to contain outbreaks of diseases in the
livestock production industry.
Based on the results of the case study scenario,
we accommodate the users needs on the tool, and of a
test made on 23rd, October 2023, on a workshop with
the state veterinaries from the state of Rio Grande do
Sul.For future work it will be important to focus on
reducing even more the costs, making the application
more scalable for general users. Another improve-
ment for future work would be the UI/UX of the ap-
plication, while attending the user needs we noticed
that there’s room for improvement for an easier to un-
derstand UI.
ACKNOWLEDGEMENTS
This research is supported by FUNDESA, project Ap-
plication of Machine Learning Techniques to Predict
the Prevalence of Diseases in the Processes of Certi-
fied Swine Breeding Fars and Monthly Pige Epidemi-
ological Sheet (UFSM/057438) and Research and De-
velopment of Innovative Technologies focused on
Agribusiness (UFSM/051568) and (UFSM/060642)
A Distributed Processing Architecture for Disease Spread Analysis in the PDSA-RS Platform
319

Use of artificial intelligence in the systematization
of hygienic sanitary certification processes for ship-
ments and accreditation of legal origin of fish. The
research by Vincius Maran is partially supported by
CNPq grant 306356/2020-1 (DT-2).
REFERENCES
Adadi, A. and Berrada, M. (2018). Peeking inside the black-
box: A survey on explainable artificial intelligence (xai).
IEEE Access, 6:52138–52160.
Bradhurst, R. A., Roche, S. E., East, I. J., Kwan, P., and Gar-
ner, M. G. (2015). A hybrid modeling approach to sim-
ulating foot-and-mouth disease outbreaks in australian
livestock. Frontiers in Environmental Science, 3:17.
Cardenas, N. C., Lopes, F. P., and Machado, G.
(2022a). Modeling foot-and-mouth disease dissemina-
tion in brazil and evaluating the effectiveness of control
measures. bioRxiv, pages 2022–06.
Cardenas, N. C., Pozo, P., Lopes, F. P. N., Grisi-Filho, J. H.,
and Alvarez, J. (2021). Use of network analysis and
spread models to target control actions for bovine tuber-
culosis in a state from brazil. Microorganisms, 9(2):227.
Cardenas, N. C., Sykes, A. L., Lopes, F. P., and Machado,
G. (2022b). Multiple species animal movements: net-
work properties, disease dynamics and the impact of tar-
geted control actions. Veterinary Research, 53(1):14.
Descovi, G., Maran, V., Ebling, D., and Machado, A.
(2021). Towards a blockchain architecture for animal
sanitary control. In ICEIS (1), pages 305–312.
Ehsan, A., Abuhaliqa, M. A. M., Catal, C., and Mishra, D.
(2022). Restful api testing methodologies: Rationale,
challenges, and solution directions. Applied Sciences,
12(9):4369.
Galvis, J. A., Corzo, C. A., Prada, J. M., and Machado,
G. (2022). Modeling between-farm transmission dynam-
ics of porcine epidemic diarrhea virus: characterizing
the dominant transmission routes. Preventive Veterinary
Medicine, 208:105759.
Merkel, D. (2014). Docker: lightweight linux containers for
consistent development and deployment. Linux journal,
2014(239):2.
Mnih, V., Kavukcuoglu, K., Silver, D., Graves, A.,
Antonoglou, I., Wierstra, D., and Riedmiller, M. (2013).
Playing atari with deep reinforcement learning. arXiv
preprint arXiv:1312.5602.
Roth, J. A. (2007). Animal disease information and preven-
tion materials developed by the center for food security
and public health. Iowa State University Animal Industry
Report, 4(1).
Schoenbaum, M., Assefa, D., Holmstrom, L., Delgado, A.,
Seaman, J., Collins, F., and Springs, C. C. (2024). Sim-
ulating foot-and-mouth disease in the united states using
the animal disease spread model.
Silver, D., Hubert, T., Schrittwieser, J., Antonoglou, I., Lai,
M., Guez, A., Lanctot, M., Sifre, L., Kumaran, D., Grae-
pel, T., Lillicrap, T., Simonyan, K., and Hassabis, D.
(2017a). Mastering chess and shogi by self-play with
a general reinforcement learning algorithm.
Silver, D., Schrittwieser, J., Simonyan, K., Antonoglou, I.,
Huang, A., Guez, A., Hubert, T., Baker, L., Lai, M.,
Bolton, A., et al. (2017b). Mastering the game of go
without human knowledge. nature, 550(7676):354–359.
ICEIS 2024 - 26th International Conference on Enterprise Information Systems
320
