
Development of GIS-Based Simulations for Evaluating Interventions
in Latvia's Transport System
Justina Hudenko
1,2 a
, Igors Kukjans
2b
and Inguna Jurgelane Kaldava
2c
1
JSC “LatRailNet”, Latvia
2
Riga Technical University, Latvia
Keywords: User Interface, Online Simulation, State Intervention Outcomes, Transport Systems.
Abstract: This paper presents the development and testing of a user interface (UI) for the Transport Interventions
outcomes simulation Model (TIM) as part of Latvia's efforts to comprehensively assess state interventions in
its transport system. Following the design thinking process, the paper outlines stakeholder needs and proposes
a centralized website for accessing transport system data and outcomes. The TIM UI facilitates data
exploration, submission of proposals, and initial impact assessment. It integrates GIS technology for enhanced
visualization and decision-making. Testing results inform improvements in navigation, clarity, visual design,
and performance. The TIM UI contributes to sustainable transportation planning and policy formulation in
Latvia by engaging stakeholders and enabling informed decision-making.
1 INTRODUCTION
This research is motivated by the requirement to
comprehensively assess the outcomes of state
interventions within Latvia's transport system. These
interventions, extending beyond mere infrastructural
enhancements, are linked to broader environmental
(ESG) and regional development objectives.
Consequently, the transport system assumes a pivotal
role as an agent facilitating progress toward these
multifaceted goals.
This publication serves as a follow-up to the initial
phase of the design thinking process, which focuses
on prototyping and understanding the needs of
stakeholders. The previous paper (Hudenko et al.,
2022) outlines the first two steps Scheer et al. (2012)
based design thinking process: (1) Observation and
(2) Synthesis. The observations of railway
stakeholders were conducted through focus group
discussions, involving representatives from railway
policy makers, professionals (railway undertakers),
and implementers of railway policy (the
infrastructure manager and the capacity allocation
body). The synthesis of stakeholder insights revealed
varying levels of development and involvement in
a
https://orcid.org/0000-0002-2347-8539
b
https://orcid.org/0009-0003-5166-6347
c
https://orcid.org/0000-0001-6756-7675
ESG processes among different stakeholder groups.
While some stakeholders demonstrated a high level
of engagement and accountability, others indicated a
more passive approach, primarily driven by
regulatory requirements. The results also highlighted
stakeholders' perceptions and motivations regarding
ESG activities, revealing areas of alignment and
divergence among different groups. These findings
underscore the importance of addressing
stakeholders' varying levels of awareness and
engagement in ESG activities within the railway
sector, particularly in fostering effective
communication and collaboration among
stakeholders to advance sustainable strategies in
transportation planning and execution.
This research bridges this gap and discusses the
subsequent phases of the design thinking process: (3)
Ideate; (4) Prototype; and (5) Testing. These phases
involve the development and testing of an open-
access Geographic Information System (GIS) based
data and data simulation tool among stakeholders, so
that they can understand broader objectives of
transportation planning.
GIS technology coordinates a wide range of
applications across different industries including
258
Hudenko, J., Kukjans, I. and Kaldava, I.
Development of GIS-Based Simulations for Evaluating Inter ventions in Latvia’s Transport System.
DOI: 10.5220/0012748700003758
Paper published under CC license (CC BY-NC-ND 4.0)
In Proceedings of the 14th International Conference on Simulation and Modeling Methodologies, Technologies and Applications (SIMULTECH 2024), pages 258-265
ISBN: 978-989-758-708-5; ISSN: 2184-2841
Proceedings Copyright © 2024 by SCITEPRESS – Science and Technology Publications, Lda.
regional planning, environmental management,
transportation and allows users to understand
patterns, relationships, and trends that are not always
apparent in tabular data, thus enabling users to make
informed decisions.
By leveraging GIS technology, this research seeks
to empower policymakers, transport and regional
development planners, and transportation
stakeholders with actionable insights into the
potential impacts of various interventions on Latvia's
transport system. Furthermore, we seek to address
challenges in this domain to both SIMULTECH
society and practitioners.
In the following sections, this paper will delve
into the methodological details of developing GIS-
based simulations for interventions in Latvia's
transport system. It will explore the underlying data
sources, modelling techniques, and simulation
methodologies employed, highlighting key insights
and implications for urban planning and policy
formulation.
2 THE IDEATION
In the ideation phase of our project, we propose the
development of a comprehensive website aimed at
providing a centralized platform for stakeholders to
access information on existing transport system
developments, planned interventions, and their
outcomes (Fig. 1).
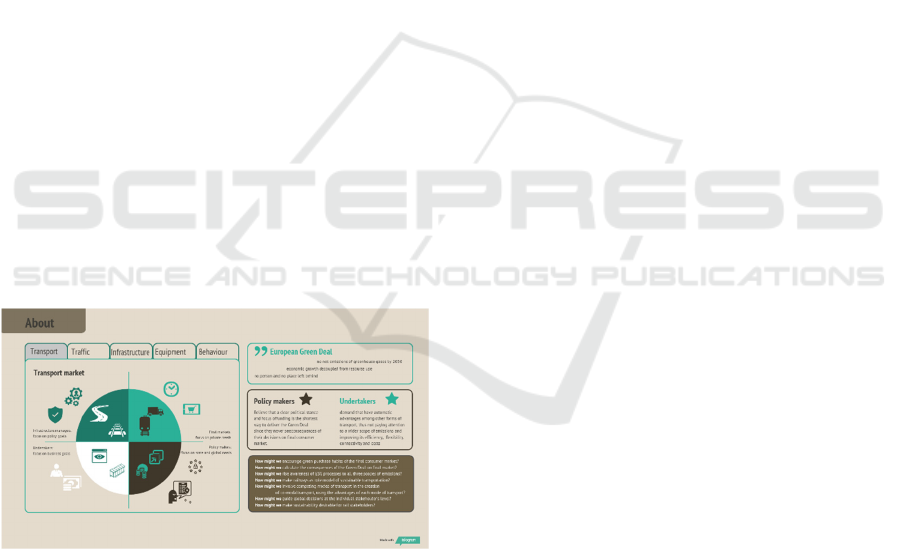
Figure 1: Conceptual Framework of Stakeholder
Involvement in the Green Deal Website.
Figure 1 illustrates the ideation proposal
regarding the involvement of various stakeholders in
the Green Deal via the website. The website is
structured into four main sections: transport
(transports operators), infrastructure (policy makers),
equipment (infrastructure undertakers), and
behaviour (transport users).
Each section is tailored to focus on achieving the
goals of the Green Deal within their respective
domains by addressing these questions:
Transport operators: "How might we make
sustainability desirable for rail stakeholders?"
Transport users: "How might we encourage
green purchase habits of the final consumer
market?"
Policy makers: "How might we make railways
as a role model of sustainable transportation?”,
“How might we involve competing modes of
transport in the creation of co-modal transport,
using the advantages of each mode of
transport?" and "How might we guide global
decisions at the individual stakeholder's level?"
Infrastructure undertakers: "How might we
calculate the consequences of the Green Deal
on final market?" and "How might we raise
awareness of ESG processes to all three scopes
of emissions?"
If implemented, the proposed website would
serve as a valuable tool for stakeholders by
consolidating data and insights on ongoing and
proposed transport interventions, providing
accessible and up-to-date information. This platform
would enable policymakers, urban planners,
transportation engineers, and other stakeholders to
gain valuable insights into the current state of the
transport system, identify improvement areas, and
explore potential intervention strategies.
The first testing of prototyped website asked to
develop an intuitive interface that allows users to
navigate through different sections, including a
comprehensive database of existing transport system
developments, detailed profiles of planned
interventions, and comprehensive reports on the
outcomes of previous interventions. Additionally,
interactive maps and visualizations were asked to be
incorporated to enhance the user experience and
facilitate data exploration:
The list of accepted infrastructure projects,
those location, and details (Figure 2)
Use studies (optional – not discussed)
Possibilities to submit proposals (Figure 3).
Development of GIS-Based Simulations for Evaluating Interventions in Latvia’s Transport System
259
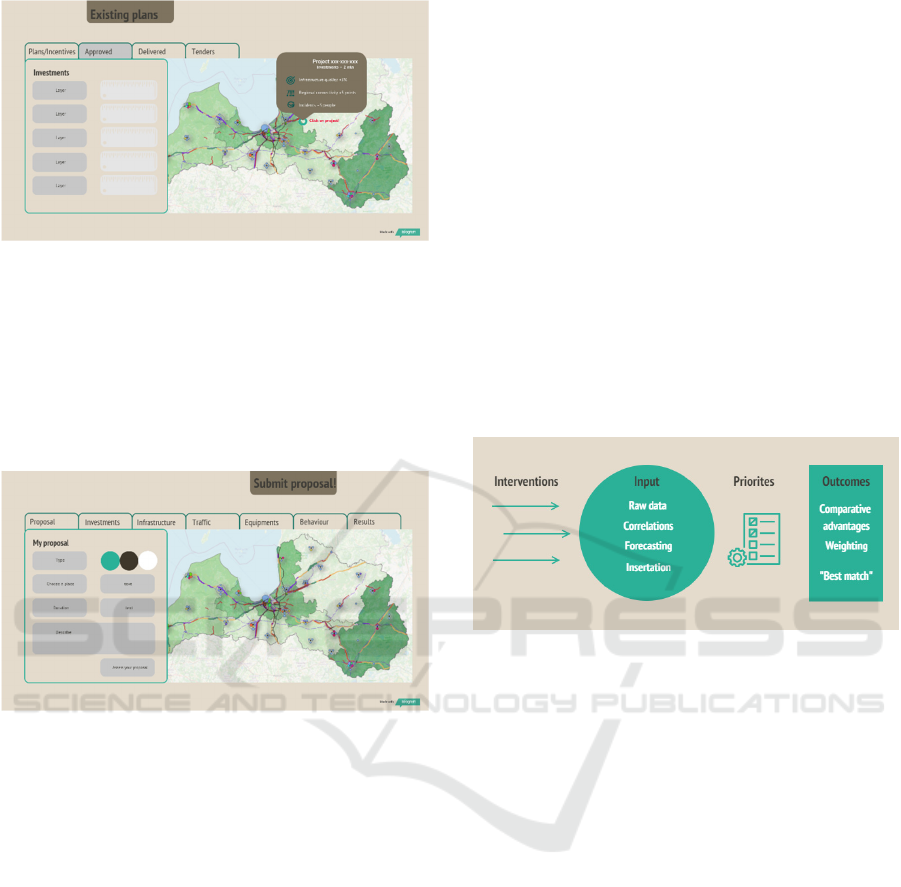
Figure 2: Latvia Infrastructure Project Data Visualization.
Figure 2 depicts a visualization an accepted
projects’ explanation tool. It includes a map of Latvia
infrastructure, divided into layers. Each layer has
information about the project and associated
investments as well as its outcomes such as
infrastructure quality, regional connectivity, and
incidents.
Figure 3: Project Proposal Submission Tool with
Interactive Map Display.
Figure 3 illustrates the ideated proposal of
submission interactive map, with multiple survey of
information, including required interventions as well
as affected infrastructure, traffic, equipment, and
behaviour aspects. At the end there is a result section
where stakeholders require an initial impact of their
proposal where they can assess feasibility of the
submitted proposal.
In summary, the ideation step of the prototyped
website focused on developing an intuitive interface
to allow users to navigate through various sections,
including a comprehensive database of existing
transport system developments, detailed profiles of
planned interventions, and comprehensive reports on
the outcomes of previous interventions. Additionally,
interactive maps and visualizations were proposed to
enhance the user experience and facilitate data
exploration, allowing stakeholders to submit
proposals and to make those initial assess. The next
step discusses the prototype of the transport
interventions initial assessment tool.
3 THE PROTOTYPE
This section will discuss the Transport Interventions
outcomes simulation Model (TIM), which enables
researchers, interested stakeholders, and policy
analysts to calculate, in a comparable manner, the
effects of taxes, investments, and other transport
interventions on transport system outcomes for
specific countries or groups of countries.
3.1 TIM Model
Figure 4 show a representation of the TIM model
inputs, interactions, and outcomes.
Figure 4: The TIM Model Overall Scheme.
Figure 4 summarizes the framework of the TIM
and its core components:
Interventions. Presently, our focus primarily
encompasses investment strategies.
Nevertheless, a supplemental investigation
incorporates additional potential interventions,
such as legal frameworks and taxation policies.
Model Core ("Black Box"). This component
serves as the central processing unit, where raw
data undergoes correlation analysis, forecasting,
weighting, and integration processes.
Alignment with Decision Makers. This stage
involves the identification of outcome priorities
to ensure congruence with the preferences and
objectives of decision-making entities.
Outcomes. The model simulates the
comparative advantages inherent in various
intervention scenarios.
Subsequent sections will elucidate the constituent
blocks of the model in reverse order.
3.1.1 The Outcomes and Capabilities
TIM can be used in many ways. For online users:
SIMULTECH 2024 - 14th International Conference on Simulation and Modeling Methodologies, Technologies and Applications
260

Standard estimation of environment impact,
mobility redistribution and productivity
statistics under actual conditions.
Budgetary effects.
Illustrative changes to traffic redistribution on
transport modes and public/private source of
transport financing.
More advanced capabilities (outside of online
version):
Ex-ante and ex-post assessment of complex
policy reforms e.g., Transport Development
Master plan.
Policy transfer’s assessment e.g., how adopting
a policy measure currently effective in country
A would have effect in country B.
Assessment of other "what if" questions effects
and costs of EU-wide policy reforms.
In summary, we expect that TIM's comprehensive
functionalities make it a valuable tool for
policymakers, researchers, and stakeholders involved
in transportation planning and policy analysis at both
national and international levels.
3.1.2 Policy Priorities
The TIM model either reflects the intervention-
benefit outcomes for a specific period (ex-post
analysis) or the outcomes for an actual (planned) or
imaginary intervention (ex-ante) scenario.
This is a fact that decision-making is not always
as simple as the value of a specific parameter.
Therefore, the primary output of the TIM model is an
aggregated weighted of scenario comparable
advantages of key performance indicators (KPIs) for
various scenarios. This outcome is attained through
the application of the Analytic Network Process
(ANP) methodology. The output consists of two lists:
evaluations of comparable advantages and those
weights (policies).
Technically an evaluation of comparable
advantages is the aggregate of input data correlations
and forecasts as described below. These components
in rare cases fractions can be either added or
subtracted to build the unknown aggregate.
TIM policies are functions, which typically
represent an eligibility for the intervention (e.g. better
connectivity indicators leads "best match" to
investments). The purpose of using policy functions
as building blocks of the model is to provide a general
structure, which can be seen as using a standardised
language to describe transport policy instruments.
As a default TIM produces a table with forecasted
KPIs, those weights and aggregated value. The KPI
are divided into three groups:
Productivity: Nominal labor productivity per
hour in the transportation and storage sector;
GDP per capita at purchasing power parity;
Transport infrastructure index;
Cohesion: Regional GDP disparity; Attraction
of private investment in planning regions; Wage
in planning regions;
Sustainability: Share of energy generated from
RES in transport; Share of zero-emission
vehicles in the total number of vehicles;
Reduction in the number of pedestrian fatalities
in road traffic accidents.
The concept of "best match" refers to achieving
an optimal system-dataset combination where no
further improvements can be made in one aspect
without sacrificing performance in another aspect,
e.g. Pareto optimality.
Achieving a "best match" suggests that there may
be multiple combinations of interventions that could
be considered optimal, as it is not possible to improve
one aspect (e.g. productivity) without compromising
another aspect (e.g. sustainability). We use the
concept of Pareto optimality for selecting the "best
match" intervention/priorities combination by
considering the trade-offs between different criteria
and striving for an outcome where no further
improvements can be made without sacrificing
performance in other areas.
3.1.3 Data Input
TIM is based on two inputs: raw data and correlations
coefficients.
Raw data or parameters contain the information
the model needs to produce its output. These are the
initial, unprocessed data inputs from transport sector
stakeholders that serve as the foundation for analysis
within TIM. They are stored in XML files and consist
of factual information or observations collected from
sensors, databases, or official statistics. Raw data
consists of assessment unit, such as: Number of
transport units on a road or rail section (for traffic
dimension); Maximum transport unit available (for
infrastructure dimension); Revenue generated by one
transported unit (for behaviour dimension); Number
of incidents per infrastructure unit (for equipment
dimension). The assessment units consist of meta data
e.g., definitions of e.g., what is a transport unit, when
and how it is collected, etc. The meta data is also a
part of the input data and requires extensional
communication among data users.
Coefficients are numerical values or parameters
used to quantify the relationships or correlations
between different factors within the transportation
Development of GIS-Based Simulations for Evaluating Interventions in Latvia’s Transport System
261

system’s row data. In the context of TIM, coefficients
include regression coefficients, correlation
coefficients, elasticity coefficients, and other
coefficients derived from econometric models or
empirical studies. These coefficients play a crucial
role in estimating the effects of policy interventions,
predicting outcomes, and assessing the impacts of
various factors on transportation system performance.
Coefficients mostly derived from statistical analyses
or previous research and are used to represent the
strength and direction of the relationships between
variables.
Furthermore, while in an ideal research setting,
assessing the outcomes of interventions for the year
YYYY would involve the modification of data
relevant to the same year, it is essential to
acknowledge that in the real-world corresponding
data is not consistently guaranteed. Therefore,
datasets used for simulating several intervention
years, are compiled by forecasting technics and
alongside with user’s adjustments develop baseline or
base scenario.
These forecasting parameters reflect the
dynamics of the transport system and represent the
probable outcome in the absence of interventions.
Additional parameters can be included by
stakeholders to improve forecasting accuracy by
users based on their knowledge and the specific
context of the time series being modelled. Some
examples of additional parameters mentioned during
ideation were:
• Seasonal and cyclical patterns that repeat
over fixed periods.
• Known cases or events (e.g., legal changes,
end of related projects etc) that lead to
gradual changes in the data over time.
• Influence of the external variable such as
demography economic indicators, weather
data, or any other relevant factors.
• System dynamics components such as
saturation and delays in feedback.
The involvement of stakeholders provides a
powerful framework for understanding and managing
complex transportation systems, allowing
policymakers, managers, and researchers to explore
the dynamic behaviour of the system and design more
effective strategies.
3.1.4 Interventions
The name of the model, reflects its core function of
simulating outcomes resulting from interventions,
including taxes, investments, and legal boundaries.
Technically, the intervention file in the TIM model
consists of multiple variables that aggregate a set of
key performance indicators (KPIs) relative to a
baseline scenario. The comparison of different
intervention scenario allows to find the "best much"
as described in section 3.1.2. The intervention file
also consists of name, type, amount and starting year
of intervention, affected row data sets and coefficient
used for updating those values to the corresponding
year.
For the online user the interventions are
standardised (standard interventions), that means that
online users can propose to change only specified
data sets, which were used over the ex-ante
assessment, as described in section 3.2.
Advanced users can introduce special intervention
function, defining any variables and data sets as well
as develop a list of interventions worked off in
sequence when the TIM model performs its
calculations called "policy". These is a file that define
variables that aggregates the effect of each
intervention to the sequent intervention and on the
final output. The variables in the file capture both
direct impacts and indirect influences, considering the
spatial relationships and interactions among
interventions.
Technically there is no difference between
standard interventions and special interventions, both
use ANP functions for their implementation and both
need to be listed in the "policy" to be performed.
Thus, calling some of them "special" is just a matter
of better comprehensibility, that shows that user can
influence the outcomes by defining of relationships
and interconnections.
Through this approach, the TIM model refers to
prevalent users’ inquiries regarding the omission of
certain transport interventions from simulation due to
datasets typically lacking information on past
contributions of the progressing transport system.
This will lead us to the next problem of "How
might we guide global decisions at the individual
stakeholder's level?", which on an ideational level is
addressed through the introduction of a challenging
user interface.
3.2 TIM User Interface
The user interface prototype was introduced in 2023
as a step forward in improving the user experience
within simulation modelling and GIS applications,
particularly in addressing the complex transport
system dynamics of guiding "strategical level"
decisions at the individual stakeholder's level. This
milestone sets the foundation for continued research
and development aimed at refining the interface's
SIMULTECH 2024 - 14th International Conference on Simulation and Modeling Methodologies, Technologies and Applications
262
functionality and effectiveness in facilitating
informed decision-making processes.
In the subsequent text, we will present the results
from the testing phase of the developed prototype.
3.2.1 Explanatory Pages
By distinguishing between raw data inputs and
coefficients primarily assessing data correlations,
users can gain a clearer understanding of the various
types of information integrated within TIM and their
respective contributions to the analysis and decision-
making process. Therefore, the key elements of the
model are interpreted to users through the "About"
window in the user interface.
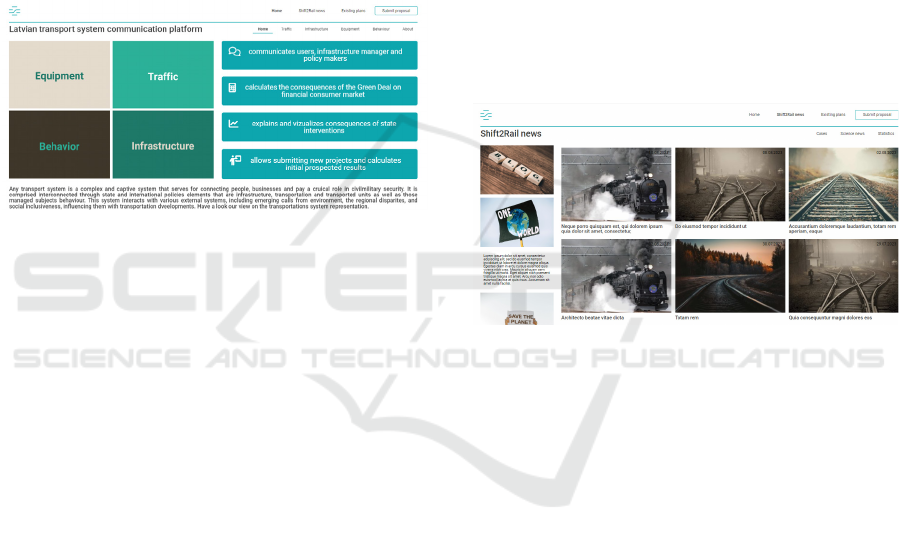
Figure 5: Clarifying Raw data Utilization in TIM: ˝About˝
window.
The "About" window sections presents
aggregated data in four model dimensions:
• "Traffic" encompasses two distinct groups of
indicators: (1) traffic flow intensity, reflecting
the tangible load on the transportation
infrastructure in terms of vehicles, and (2)
turnover of transported units (passengers or
freight tonnes). Traffic indicators are delineated
by three dimensions: passenger and freight
transport, intensity of public and commercial
transport, and road transport and railway
movement. Furthermore, efforts are made to
delineate the regional distribution of traffic for
GIS representation.
• "Infrastructure" distinct two groups of
indicators: (1) throughput, delineating the
maximum volume of vehicles passing through a
designated section of the infrastructure per day,
and (2) throughput capacity, representing the
projected maximum capacity for both linear
infrastructure and terminals. To ensure data
comparability, the same dimensions employed
for "Traffic" indicators are adopted."
• "Equipment" is characterized by three primary
groups of indicators: (1) environmentally
friendly equipment associated with the
availability of environmentally safer modes of
transport as electrified railway lines, cycling
paths, alternative fuel filling stations etc., (2)
safety (for passengers) and security (for freight)
of transported units, as well as (3)
Competitiveness and time efficiency that are
influenced by infrastructure quality, with
improved infrastructure correlating to reduced
time losses.
• "Behaviour" assessed through three groups of
indicators: (1) changes in behaviour patterns,
like modal shift, management shift and spatial
shift; (2) revenue, that pertains to the ability of
individuals and businesses to meet the costs
associated with transportation and make vehicle
choices based on price considerations; (3) costs,
where assessments consider separately allocated
capital and operational costs, along with
evaluating the cost burden on service users.
Figure 6: Clarifying Data Correlations in TIM: ˝Shift2Rail˝
window.
This section of the user interface displays all
submitted use cases and statistics clarifying
regression, correlation, and elasticity coefficients,
derived from econometric models or empirical
studies utilized within the TIM model. Additionally,
we aim to present unexplained aspects of the model
for future evaluations by scientists and students.
The "Existing plans" window explain in GIS and
excel representation those plans that already
approved and aimed to explain those outcomes and
restrictions that appears in traffic during
implementation (see Figure 7)
We aimed to provide enhancements across
various categories of lanes to facilitate easier
navigation. But in fact, we were engaged in extensive
discussions with stakeholders regarding the level of
detail in mapping, as well as the implementation of
notifications for announced project changes.
Additionally, considerations such as data accuracy (in
terms of understanding of definitions), usability for
final users, and stakeholder feedback were also
prominent in our deliberations.
Development of GIS-Based Simulations for Evaluating Interventions in Latvia’s Transport System
263
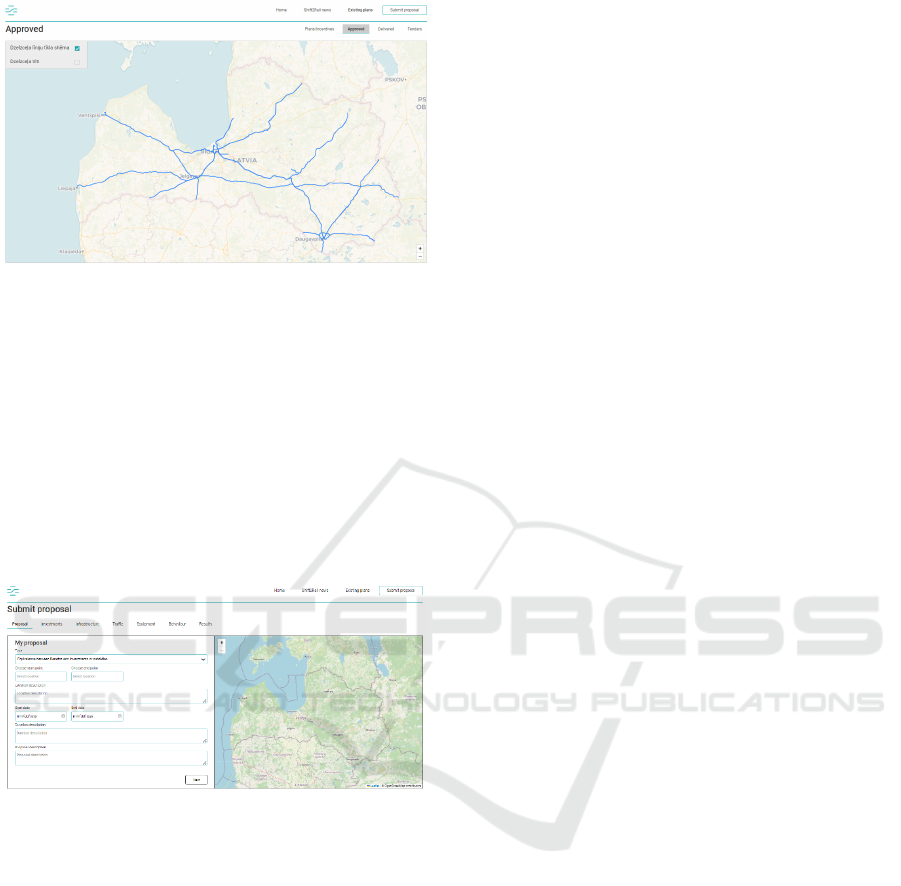
Figure 7: Clarifying Approved Interventions in the
Transport System with GIS instruments.
3.2.2 TIM Public Access
In recent years, the development of user interfaces
(UIs) for complex systems has garnered significant
attention due to their crucial role in facilitating user
interactions and improving overall user experience.
The TIM UI, serves as a central access point for
public usage, providing access to feedback to existing
transport policy through the implementation of the
"Submit Proposal" feature (see Figure 8)
Figure 8: TIM User Interface’s prototype.
By integrating the "Submit Proposal" feature into
the TIM interface, we aim to address the question
raised in the ideation part of the research: "How might
we encourage green purchase habits of the final
consumer market?" Our goal is to encourage users of
the infrastructure to actively participate in social
dialog. This approach fosters better public
participation and allows us to demonstrate the logic
behind intervention assessments. Users will be driven
through the set of questions ensuring reliability and
viability of the submitted proposals. This initial
assessment will be shared with the final users,
fostering transparency and trust in the decision-
making process.
After the registration process, the "Submit
Proposal" feature on the user interface's main window
displays the following components:
• The "Type" ribbon allows users to access
parameters related to the specific state
intervention and switch between TIM
parameters for customized calculations.
• Additional ribbons are available for specifying
details such as prescription, location, duration,
and description of the proposal. These details
are stored and listed in the "Delivered" window
of the user interface for easy reference and
tracking.
• The delivered proposals are also shown on the
map.
Once user click the "Next" button located at the
bottom of the user interface, a run dialog is initiated
to support the manipulation of intervention
parameters. These dialogues enable the configuration
of adjustments in traffic, infrastructure, equipment,
and other input datasets, all of which are essential for
simulating transportation system outcomes.
The TIM UI offers initial calculations based on
built-in regression, correlation, and elasticity
coefficients. These calculations not only facilitate
standard computations but also aid in error
identification and the assessment of consistency in
various considerations. Users are encouraged to
provide remarks and evidence to refine decision-
making processes in line with real-world scenarios.
Each TIM model category is presented within its
own window, and users can navigate between these
windows by clicking on the respective flags. The
"Results" window compiles all delivered proposals
for policymakers, serving as a foundational resource
for discussions and public involvement.
4 CONCLUSIONS
The paper introduces a proposed user interface to
centralize information on transport system
developments and intervention outcomes,
particularly focusing on broader environmental and
regional development objectives aligned with the
European Green Deal. It emphasizes the importance
of effective communication and collaboration among
stakeholders to advance sustainable strategies in
transportation planning and execution.
The TIM user interface facilitates user interaction
and enhances the overall user experience, featuring a
"Submit Proposal" feature to encourage public
participation and demonstrate intervention
assessment logic. It allows users to customize
calculations, provide input data, and access detailed
information on delivered proposals.
SIMULTECH 2024 - 14th International Conference on Simulation and Modeling Methodologies, Technologies and Applications
264

The users’ feedback allowed us to improve some
parts of the ideation process:
• Changing some parts and adding some features
(such as buttons, ribbons, and dropdown menus)
for intuitive navigation between different
sections and windows within the interface.
• Wordings improvement for clarity of interface
elements.
• Users appreciate better visual layout and design
of the interface.
Further involvement of users in submission
process would improve the functionality:
• We are aiming to increase the accuracy of
calculations, ensuring that the results align with
users’ expectations.
• We are looking for feedback that the interface
functions properly across different devices and
screen sizes, including desktop computers,
laptops, tablets, and smartphones.
• We are continuously improving performance
under different load conditions to ensure that it
can handle a high volume of user interactions
without performance degradation.
In conclusion, the research contributes to
advancing sustainable transportation strategies in
Latvia by providing a comprehensive framework for
evaluating state interventions, promoting stakeholder
engagement, and facilitating informed decision-
making processes in transportation planning and
policy formulation.
REFERENCES
Hudenko, J., Gorska, L. A., Kukjans, I., & Kustova, I.
(2022). Latvian Rail Transport Sector Stakeholders'
Perception of Green Deal Policy Measures. Economics
and Business, 36, 120–133. https://doi.org/10.2478/eb-
2022-0008
Scheer, A., Noweski, C. & Meinel, C. (2012). Transforming
constructivist learning into action: design thinking in
education. Design and Technology Education: An
International Journal, 17, 8-19.
Development of GIS-Based Simulations for Evaluating Interventions in Latvia’s Transport System
265
