
RLHR: A Framework for Driving Dynamically Adaptable
Questionnaires and Profiling People Using Reinforcement Learning
Ciprian Paduraru
1
Catalina Camelia Patilea
1
and Alin Stefanescu
1,2
1
Department of Computer Science, University of Bucharest, Romania
2
Institute for Logic and Data Science, Romania
Keywords:
Reinforcement Learning, Bias Removal, Time Series, Classification, Behaviors, Profiling.
Abstract:
In today’s corporate landscape, the creation of questionnaires, surveys or evaluation forms for employees is a
widespread practice. These tools are regularly used to check various aspects such as motivation, opportunities
for improvement, satisfaction levels and even potential cybersecurity risks. A common limitation lies in their
generic nature: they often lack personalization and rely on predetermined questions. Our research focuses on
improving this process by introducing AI agents based on reinforcement learning. These agents dynamically
adapt the content of surveys to each person based on their unique personality traits. Our framework is open
source and can be seamlessly integrated into various use cases in different industries or academic research.
To evaluate the effectiveness of the approach, we tackle a real-life scenario: the detection of potentially in-
appropriate behavior in the workplace. In this context, the reinforcement learning-based AI agents function
like human recruiters and create personalized surveys. The results are encouraging, as they show that our
decision algorithms for content selection are very similar to those of recruiters. The open-source framework
also includes tools for detailed post-analysis for further decision making and explanation of the results.
1 INTRODUCTION
The goal of this work is to create a framework that
contains the tools needed to conduct large-scale adap-
tive surveys and to thoroughly analyze the results after
the survey. The main component is a software-based
virtual HR agent that can behave like a real human
during a survey and adapt the sequence of questions
asked to the individuals being assessed and their pre-
vious responses. We refer to this adaptive way of ask-
ing questions as dynamic survey. With the proposed
software agents, each person in an organization could
be individually assessed at minimal cost. A limited
and targeted number of questions must be asked to
maintain respondent engagement. In this context, the
agent strategically determines the sequence of ques-
tions. By optimizing this sequence, the goal is to bet-
ter assess individuals based on the survey objectives,
with the number of questions comparable to that of a
typical fixed survey.
We summarize our contribution below:
1. The first deep reinforcement learning (DRL)
method mimics HR professionals to drive ques-
tionnaires in real-time.
2. Improved methods for detecting and subtracting
bias in responses (due to user over- or under-
response to questions over time) using time series
techniques. (Xia et al., 2015).
3. A method of augmenting existing datasets (which
are usually small) to create large synthetic
datasets that mimic the original datasets.
4. We make our work available to industry
and academia as an open-source framework
called RLHR (Reinforcement Learning Hu-
man Resources) at https://github.com/unibuc-cs/
AIForProfilingHumans.
2 RELATED WORK
The work that comes closest to ours is (Paduraru.
et al., 2024), which has similar goals but different
methods. We compare their methods with ours using
a new, larger anonymized dataset. The methods pro-
posed in our current work have several technical fea-
tures to improve the state of the art. First, we found
that the Pathfinding AI method in (Paduraru. et al.,
2024) suffers from biased selection (Wang and Singh,
2021) as it always selects the closest possible clus-
ter (with limited random explorations). To improve
the results, in this work we use a deep reinforcement
learning method (Mnih et al., 2016) by adding bet-
Paduraru, C., Patilea, C. and Stefanescu, A.
RLHR: A Framework for Driving Dynamically Adaptable Questionnaires and Profiling People Using Reinforcement Learning.
DOI: 10.5220/0012752800003753
Paper published under CC license (CC BY-NC-ND 4.0)
In Proceedings of the 19th International Conference on Software Technologies (ICSOFT 2024), pages 359-366
ISBN: 978-989-758-706-1; ISSN: 2184-2833
Proceedings Copyright © 2024 by SCITEPRESS – Science and Technology Publications, Lda.
359

ter explorations, latent encapsulation of individuals
by deep neural networks, and temporal information
understanding with gated recurrent unit (GRU) neural
networks (Cho et al., 2014). We also improve the con-
stant type of bias removal from the original method
with time series (Benvenuto et al., 2020), which leads
to better results. The available tools for post-survey
analysis have also been improved. We are also ad-
dressing the issue of creating synthetic data that ap-
proximates real human profiles so that clients can
evaluate and customize their survey definitions before
sending them to people.
Profiling people for content recommendations,
such as news recommendations, is a long-standing
practice (Mannens et al., 2013). Automatic detec-
tion of fraudulent profiles on social media platforms
such as Instagram and Twitter is another common
application for the creation of people profiles using
data mining and clustering techniques (Khaled et al.,
2018). In (Ni et al., 2017), social media data ex-
tracted from WeChat
1
is used to create individual
profiles and group them based on their occupational
field, using similar NLP techniques to those previ-
ously mentioned. The research in (Schermer, 2011)
discusses the use of data mining in automated pro-
filing processes, with a focus on ethics and potential
discrimination. Use cases include security services
or internal organizations that create profiles to assess
various characteristics of their employees. Profiling
and grouping individuals using data mining and NLP
techniques to extract information from text data is a
common topic in the literature. In (Wibawa et al.,
2022), the authors use AI methods such as traditional
NLP to process application documents for job open-
ings, which enables automatic filtering, evaluation
and prioritization of candidates.
3 SURVEY SETUP
3.1 Survey Formalization
Our aim is to present a survey in as generalized a form
as possible. In doing so, we rely on our experience
with the clients of vorteXplore and on the experience
we have gained with later versions of the framework.
The proposed high-level presentation method consists
of a limited number of questions (configurable on the
client side, on average between 15-25) that are either
general in nature or related to an asset shown in the
form of an image, video or extracted text (e.g. arti-
cles, SMS messages, emails, etc.). The formal spec-
1
WeChat.com
ifications and components of a survey are explained
below.
Groups. Every asset and question that is asked is part
of a group. Examples of groups from the use case:
Awareness, Prevalence, Sanction, Inspiration, Fac-
tual, Sensitivity. In our experience, this has proven to
be very useful for characterizing people from multi-
ple perspectives and organizing assets and questions.
It also has implications for reusability and makes it
easier to maintain the dataset.
Assets. A collection of assets representing video
files, media posts, SMS, etc. Asset indices also have
an optional dependency specification, i.e. the client
can specify that an asset should depend on a pre-
viously displayed set of other assets: Deps(A
i
) =
{A
j
}
j∈1..|Assets|
. For example, a video or image as-
set could only make sense as a sequence of previous
assets.
Question. The set of textual questions is denoted
by Q. Each element Q
i
∈ Q has two categories of
properties:
1. Structural properties.
• The set of assets that are compatible with this
question: Compat(Q
i
) = {A
j
∈ Assets}
j
. The
idea of compatibility is that some of the ques-
tions make sense for each type of asset shown.
Others do not, e.g. video-based assets with a
concrete action demonstration.
• Dependencies on previous questions. Internally,
the dependencies between questions take the
form of a directed acyclic graph, where each
node Q
i
has a set of dependencies Deps(Q
i
) =
{Q
j
}
j
. This set represents a restriction that Q
i
can only be asked as a follow-up question to a
previous question Q
k
∈ Deps(Q
i
).
b) Scoring properties.
• Attributes. For the use case of IB recognition,
some examples: Team interaction, Offensive
language, Rumors, Personal boundaries, Lead-
ership Style (the full list can be found in a ta-
ble in our repository). These are customizable
in the framework, are usually set by the organi-
zations prior to the surveys and are not visible
to the respondents. Generally, the client orga-
nization strategically uses these inherent charac-
teristics to gain the insights they are looking for
in the post-survey analysis. The Attr set repre-
sents the collection of attributes used by an ap-
plication. For each question Q
i
, a vector of all
attributes ordered by indices is given, represent-
ing the relative importance of each attribute to
the question. The value range is [0 − 1], where
ICSOFT 2024 - 19th International Conference on Software Technologies
360
...........
........... ........... ...........
step 0
steps 1..N+1
step N + 2
steps (N+3)..(N+3+M)
subsequent question on each asset. Usually 2-5 for each asset, total: 15-25 questions
steps (N+3+M+2)..(N+3+M+2+T)
step N+3+M+1
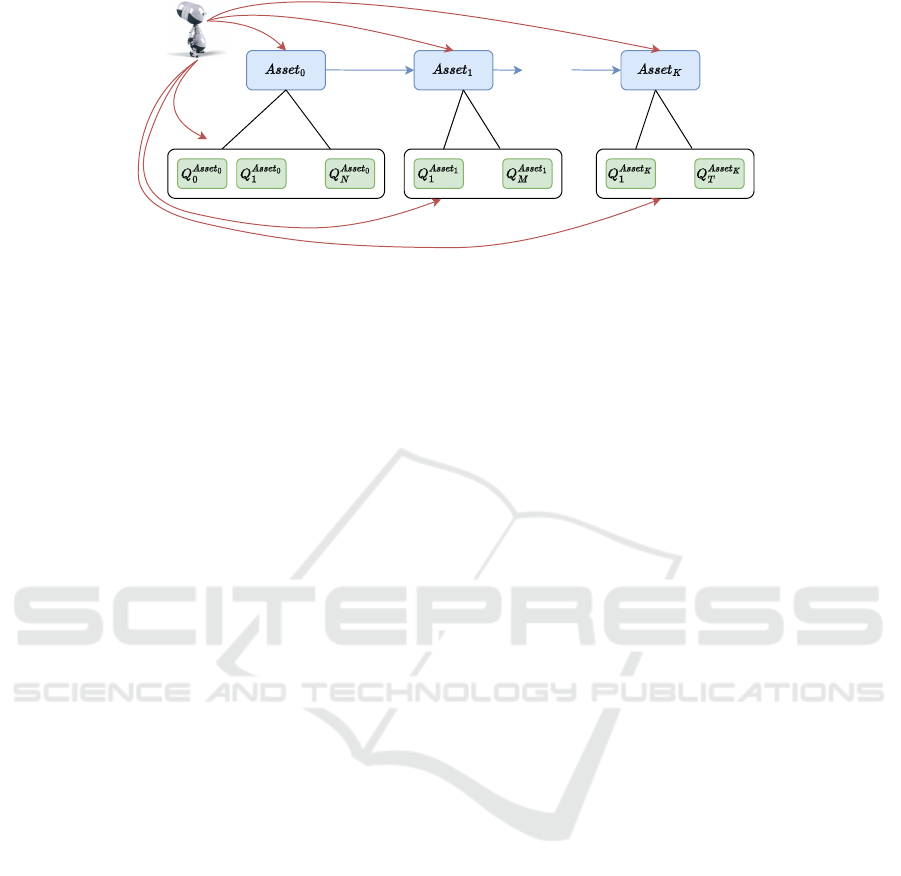
Figure 1: Example of the RLHR agent first selecting an asset and then asking a series of related questions, taking into account
constraint dependencies until the end of the interview. For each asset, the typical number of questions asked by clients ranged
from 1-5, and the total number of questions was 15-25.
0 means that the respective attribute is insignif-
icant for the asset, while a value of 1 repre-
sents a strong correlation between the attribute
and the asset. Formally, each question is given
a specification vector (by the client): At(Q
i
) =
{At
1
,At
2
,...,At
NAt
}, where NAt = |Attr|. A get-
ter function, Imp(Q
i
,At
i
), is used later in the pa-
per to determine the degree of importance for
each attribute in relation to the question.
• Importance of the questions. The function
Imp(Q
i
) is used to determine the relevance of the
question for the survey from the client’s point of
view. The values are numerical floating point
numbers in the range [0−1], where 0 has no rel-
evance, while 1 represents a high interest in the
user responses to the question.
• Baseline and tolerance values. Base(Q
i
) rep-
resents the standard expected response of re-
spondents to this question by the organization.
Tol(Q
i
) is used to denote the accepted deviations
in the responses.
• Amb(Q
i
): each question has an ambiguity factor.
This is not set from the beginning (no one would
intentionally create ambiguous questions); it is
regressed from the results of the post-survey or
participant feedback. Rather than changing the
entire survey structure, the client can increase
this factor to remove potential ambiguity and
mitigate the value of divergent responses. The
value range is between [0 − 1], where a value of
1 means no ambiguity, while 1 is the maximum.
Internally, the answers to the questions were
mapped to floating point numbers in the range [1 − 7],
either in binary format, as point values within a range,
etc. The same range of values is used for baselines
and tolerances.
Profiles Specification. The autonomous survey aims
to categorize a person into a specific profile that cor-
responds as closely as possible to an HR professional
who would interview the person face-to-face. Intu-
itively, people’s responses to a survey’s assets and
questions according to the factors mentioned above
(i.e. baselines and tolerance from the client’s perspec-
tive, importance of questions and ambiguities) con-
tribute to the aggregate score for each attribute. These
scores are used to calculate the match with one or the
other profile.
A profile is specified as a multivariate Gaussian
distribution (Guti
´
errez et al., 2023), with a total of
NAt (number of attributes) dimensions, i.e. one for
each attribute. The set of all profiles is denoted by
Pro f iles. The reasons for using this type of distribu-
tion are explained below, while the technical details
can be found in Section 4:
• It enables the natural modeling of an individual by
the properties hidden in the question. Intuitively,
the HR defines the mean, the µ vector, as the ex-
pected values of the deviations for the observed
inherent attributes for each of the profiles.
• The covariance matrix, Σ, can be used to indicate
both the tolerance (variance) of these attributes for
each of the profiles and the correlations between
the attributes. Of course, some attributes are cor-
related with each other and cannot be treated sep-
arately. At the beginning of a project with new at-
tributes and no previous data set, the client has no
information about correlations, so it uses a diag-
onal matrix Σ. However, after data has been col-
lected, as in our use case, the RLHR framework
has tools to calculate the correlation between the
attributes based on the Pearson correlation (Ben-
esty et al., 2008).
RLHR: A Framework for Driving Dynamically Adaptable Questionnaires and Profiling People Using Reinforcement Learning
361
4 METHODS FOR EVALUATING
SURVEYS
This section introduces the common evaluation func-
tions and the internal accounting of the statistics to
prepare the inputs for the RLHR agent discussed in
Section 5.
4.1 Deviations
The root of the scoring process begins with the calcu-
lation of the deviations for each question. After each
question Q
i
in the survey, the user responds with a nu-
merical sliding value in the range [1−7] (Section 3.1),
denoted by R(Q
i
). As shown in Eq. (1), this value is
compared with the base value and the tolerance val-
ues. Then, the importance of the question (or sever-
ity) in the range [0 −1] is added to mitigate deviations
from questions that are irrelevant to the final classi-
fication from the client’s perspective. Finally, the re-
ported and agreed ambiguities in the range [0 − 1] are
added to the equation to mitigate questions that have
been found to be ambiguous, and depending on the
degree, the deviations become inversely proportion-
ally less important.
D(Q
i
) =
|
R(Q
i
) − Base(Q
i
)
|
Tol(Q
i
)
2
×
1 + Amb(Q
i
)
−1
× Imp(Q
i
) (1)
4.2 Removing Anchor and over- or
under-scoring the Questions
Numerous biases can manifest themselves in a survey
(Yan et al., 2018). The most common are anchors (in-
fluences or connections to a previously asked ques-
tion) and the consistent over- or under-rating of an-
swers. The identification of these are needed to ob-
tain accurate statistics at the team and organizational
level. Otherwise, the RLHR agent might misunder-
stand the situation. Figure 2 illustrates this behavior.
The method is to find patterns in the deviation either
in the entire survey or in short, consecutive sequences
(Dee, 2006).
While the RLHR agent is conducting a survey, it
has access to the answers to the questions asked in
steps [1...K − 1] in each step K. To detect possible
bias or anchor, our method looks for an initial position
S in the range of steps so that a model can fit a predic-
tor of biases for the range [S..K − 1]. The model is an
auto-regressive integrated moving average (ARIMA)
(Benvenuto et al., 2020).
.......
Deviations
.......
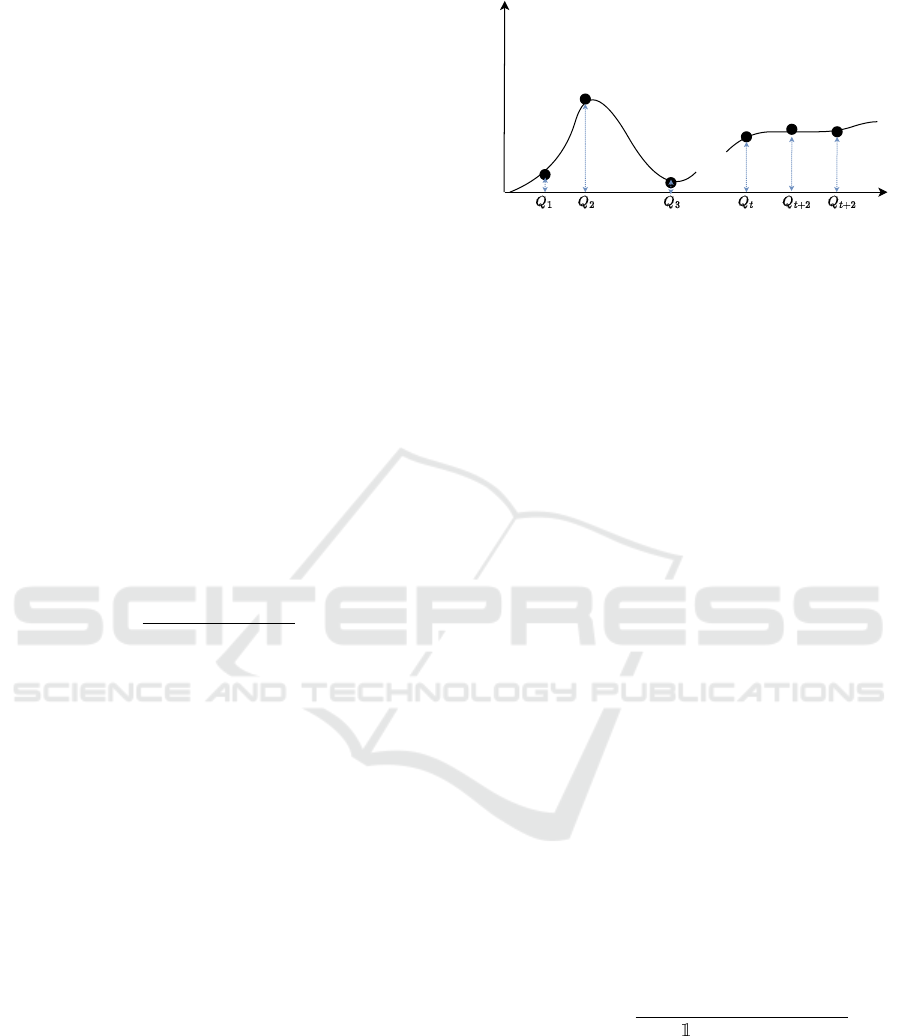
Figure 2: An example of user responses during a survey
and deviation values calculated with Eq. (1). At the begin-
ning, for the first three questions, there is no trend in the
deviations. From step t onwards, however, it can be seen
that the deviations gradually equalize, which means that the
user could be over- or under-rating responses provided for
a number of steps.
4.3 Scores Feature Vector
An important feature that the RLHR agent uses to cat-
egorize a user U into one of the defined profiles is the
aggregated score of each inherent attribute in the set
Attr in relation to the questions asked and their an-
swers. Assume that a survey is in progress and there
are already t pairs of questions, answers and both
types of deviations that can be computed using Eq.
(1).
The set of inherent attributes and their scores rep-
resent the features of U used by the RLHR agent and
for profile classification in each step. The calculation
method of these scores is shown in Eq. (2), where
the final result Sc
t
(U,At
k
) represents the score vector
for the feature (attribute) At
k
∈ Attr of the user U dur-
ing the survey after t questions have been asked. We
further denote by Sc
nb
t
(Ui, At
k
) the same score func-
tion without bias, D
nb
(Q
i
) instead of D(Q
i
). The idea
behind the calculations is that for each attribute At
k
it iterates over all questions Q
i
asked so far and ag-
gregate their contribution to At
k
(as an average) by
using the deviations and the importance of questions,
Imp(Q
i
,At
k
) (Section 3.1). For simplicity, we use the
vectorized notation of the scores of U at time t by
Sc
t
(U) ∈ R
NAt
.
Sc
t
(U,At
k
) =
∑
t
i=1
Imp(Q
i
,At
k
) × D(Q
i
)
∑
t
i=1
(Imp(Q
i
,At
k
) > 0)
(2)
As mentioned in Section 3.1, the profiles are defined
using multivariate Gaussian distributions (Guti
´
errez
et al., 2023) around the set of inherent attributes by
the expected mean and covariance (tolerance of each
attribute and predicted correlations between them)
Eq. (3). We denote the number of profiles with
NumPr f = |Pro f iles|.
ICSOFT 2024 - 19th International Conference on Software Technologies
362

Pr f De f
k
= N (µ
k
,Σ
k
), µ ∈ R
NAt
, Σ ∈ R
NAt×NAt
,
∀Pr f De f
k
∈ Pro f iles
(3)
To determine the probability that U is part of each
profile at time t given the current score vector Sc
t
(U),
the deviation scores calculated above are passed to the
standard probability density function, as shown in Eq.
(4).
P
U
t
(k) = P
U
t
(Pr f De f
k
|Sc
t
(U)) = p(Sc
t
(U); µ
k
,Σ
k
) =
1
(2π)
NAt/2
|Σ
k
|
1/2
exp
−
1
2
(x − µ
k
)
T
Σ
−1
k
(x − µ
k
)
,
∀Pr f De f
k
∈ Pro f iles
(4)
The predicted profile index at time step t for the user
U results from the selection of the maximum from
these results, Eq. (5).
Pr f
pred
t
(U) = argmax[P
U
t
(Pr f De f
k
|Sc
t
(U))]
k∈[1...NumPr f ]
(5)
5 THE RLHR AGENT
The goal of the RLHR agent is to autonomously con-
trol the survey process, adapt to the content requested
by the respondent, and provide a distribution of scores
across profiles that matches the ground truth profile as
closely as possible. The general ideas for applying the
RL methodology and components to our objectives
are detailed in this section and outlined in Figure 3
5.1 Synthetic Environments and Dataset
The environment represents the world in which the
RLHR agent performs actions and receives feedback
through partial observations and rewards. We have
used the OpenAI Gym (Towers et al., 2023) interfaces
and principles (more specifically, the updated Gym-
nasium library) so that our framework can be further
used for experiments in the community.
Set up Virtual Users. With defined profiles, even
without collecting real data, synthetic data can be cre-
ated based on sampling methods. Specifically, N ex-
amples of virtual users, VUsers, can be created, with
each U ∈ VUsers following a two-step process:
1. Select a ground truth profile for U by drawing a
uniform sample from the available set of profiles.
Note that this is hidden from the observation of
the RLHR agent and is only used for background
evaluation mechanisms when interacting with the
environment.
Pr f
gt
(U) = Uni f orm[1,NumPr f ] (6)
2. Sample a vector of inherent (ground truth) at-
tributes, knowing the ground truth profile and its
base distribution parameters from Eq. (3).
At
gt
(U) ∼ N (µ
gt
,Σ
gt
) (7)
If accurate data is available from HR experts, anno-
tated data for points 1. and 2. can be added to the
database.
Simulation of Responses from Virtual Users When
the RLHR agent asks the environment for an answer
from the surveyed user U to a question Q
i
, the value
of the answer must be correlated with: (a) the inher-
ent personality attributes, At
gt
(U), and (b) with the
importance of the attributes in the questions, At(Q
i
).
This correlation can be solved by a dot product be-
tween the two, Eq.s (8), which gives the normalized
deviation value for Q
i
in the range [0 − 1]. It must
then be converted to the client range (in our use case,
for example, the range [1 − 7] is used, Section 3.1.
D(Q
i
) = remap(At
gt
(U) ∗ At(Q
i
)) (8)
Finally, we substitute D(Q
i
) into Eq. (1) to determine
the response valueR(Q
i
). This results in the form
shown in Eq. 9
R(Q
i
) = Base(Q
i
)+
Tol(Q
i
) ×
D(Q
i
) × Imp
−1
(Q
i
)
1 + Amb
−1
(Q
i
)
1/2
(9)
5.2 Episodes, Actions and Observations
An in-progress survey of a user U is represented as a
trajectory, τ, using the reinforcement learning policy-
based algorithms (Sutton and Barto, 2018). In our
case, a episode is the same as a trajectory from the
beginning of a survey to its end.
At any time t in a survey, the state includes all as-
sets displayed and the t questions asked. As shown in
Figure 1, at each step (or action in RL terminology),
the agent must either select a new asset to show or a
follow-up question based on the currently presented
asset. Suppose that t questions have been asked us-
ing multiple NG − 1 completed groups of assets and
associated questions, and the RLHR agent is decid-
ing which asset or question to show for group NG.
We denote the asset shown in group K by A
K
, the
i-th follow-up question by Q
k
i
, and the total number
of questions asked in group K by N(G
K
). Eq. (10)
shows closed groups (indexed by k). Similarly, Eq.
(11) defines an ongoing group that must select the
next question i + 1, while an empty group means that
the next action of the RLHR agent should be to se-
lect an asset first, Eq. (12). Finally, Eq.(13) shows
RLHR: A Framework for Driving Dynamically Adaptable Questionnaires and Profiling People Using Reinforcement Learning
363
Environment
Inherent (hidden)
attributes
........
Virtual user
Survey history
States
User partial
observation
Feedback:
rewards, observations
Response
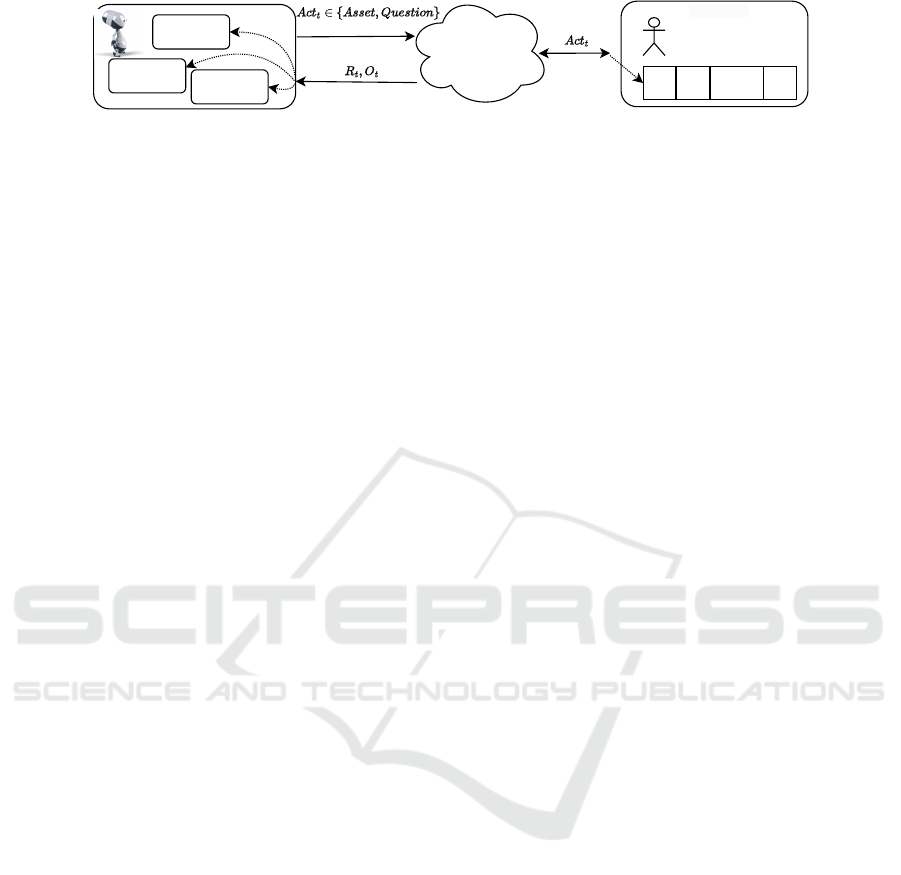
Figure 3: Relationship between the RLHR agent (left), the environment (center) and the virtual user being interviewed. The
agent sends actions to the environment and asks to display a new asset or ask a new question about the current state. In return,
the environment simulates a response that correlates with the user’s ground truth profile. Each response updates the inherent
attributes. The environment sends feedback as a reward for the last action performed and the new partial observation of the
user, which models the agent’s belief in the user’s inherent attributes. The dashed lines represent the updates made internally.
the formalized relationship between the step (actions)
and the parameter t.
G
k
=
A
k
,Q
k
1
...Q
k
N(G
k
)
(10)
G
i+1
k
=
A
k
,Q
k
1
..., Q
k
i
,Q
k
i+1
=?
(11)
G
/
0
k
=
A
k
=?
(12)
t =
NG−1
∑
j=k
N(G
k
) (13)
The trajectory for a running survey is displayed in Eq.
(14). It is parameterized by three parameters: (a) t-
the total number of questions asked so far, (b) NG-the
index of the current group and (c) k-the number of
questions asked so far in the group NG, which can be
/
0 if no question has been asked yet, i.e. if an asset
is expected. In order not to overcomplicate the equa-
tions, we omit the typical pair (state, action, reward)
at each step and keep only the state and action to be
performed next (with an exclamation mark). The ac-
tions are formally discussed in Section 5.2, while the
rewards are taken after each action and defined in Sec-
tion 5.3.
τ
(t,NG,k)
=
h
G
1
,... , G
NG−1
,G
NG
= G
k+1
NG
orG
/
0
NG
i
(14)
At each step during surveying a user U at time t, the
observation of the RLHR agent returned by the envi-
ronment, O
U
t
, is composed of two components:
(a) the trajectory τ, which consists of the history of
pairs of groups, assets and questions asked.
(b) the score of the user’s attributes after each action,
Sc
t
(U), which is calculated as in Eq. (2).
The state of the agent is given by Eq. (15)). It in-
cludes the observation, the set of valid questions V Q
t
and the assets VA
t
at time t due to the course of the
survey and the contextual dependencies.
S
U
t
=
τ
(t,..)
, Sc
U
t
,{V Q
t
,VA
t
}
(15)
Actions and environment constraints . There are also
hard constraints that must be fulfilled along the trajec-
tory (or episode) in relation to the actions:
1. In the first step, an asset must be shown.
2. If at any time t the RLHR agent decides to ask a
new question Q
new
, it must comply with two main
rules. First, it must satisfy the dependencies on
the previously asked question (or no dependencies
at all), i.e. Deps(Q
new
) =
/
0, or Q
t
∈ Deps(Q
new
).
In addition, the new question must be compatible
with the current asset, i.e. A(t) ∈ Compat(Q
new
).
3. A maximum number of follow-up questions can
be asked about a currently presented asset, rep-
resented by the parameter MaxQPerAsset (in our
example MaxQPerAsset=5). Once this threshold
is reached, a hard constraint to show a new asset
is added to the RLHR agent’s observation. Note
that the agent can switch to a new asset even if this
threshold is not reached.
4. When a new asset is shown, it must satisfy the de-
pendency on a previous asset, similar to questions.
5. The episode ends when: (a) the number of steps
reaches a threshold MaxSteps (in our example
MaxSteps=30 - intuitively set for a maximum of
25 questions and five or more assets), or (b) when
there is no remaining question or asset that can be
shown to satisfy the dependencies and structural
requirements (e.g., an asset must be shown, but
there is no longer one that satisfies the dependen-
cies). Note in this context that the number of ques-
tions may vary between surveys depending on the
user’s choices and answers. We think this is natu-
ral human behavior.
6. To handle the case of general questions where no
asset needs to be shown, we consider a special
NULL asset that does not visually display any-
thing other than the following general questions.
7. The minimum number of questions in a group is 1.
Eq. (16) formalizes the action that the RLHR agent
can take if a group NG is in progress in the current
trajectory and k (possibly
/
0) questions have already
ICSOFT 2024 - 19th International Conference on Software Technologies
364

been asked (Eq. (14)). The possible actions are: (a)
displaying a new asset when the agent decides or is
forced to start the next group NG + 1, and (b) ask the
new question K + 1 in the current group.
Act
K
NG
∈ {A
new
{NG or NG+1}
, Q
new
NG
} (16)
5.3 Rewards
The aim of the RLHR agent is to drive the survey us-
ing the actions defined in Eq. (16) so that the user U is
classified as close as possible to their known ground
truth profile Pr f
gt
(U) (Eq. (6)) at the end.
As in Eq. 4, at any time t during a survey, the
probability that a user U belongs to a profile k is given
by the values of the inherent attributes, Sc
t
(U). In
this representation, the main idea is to display assets
and ask corresponding questions to find the attribute
scores that lead to the correct classification.
With this in mind, the system models the reward
function at time t, i.e. with two main components:
(a) OverallScore. The agent is penalized for hav-
ing attribute scores that do not yet approach the
ones defined by the ground truth, Eq. (17). In-
tuitively, the maximum of this component is 0 if
the inherent attributes have scores that are close
to the predefined mean value of the ground truth
µ
gt
, and taking into account the associated co-
variances Σ
gt
.
OverallSc = P
U
t
(gt) − 1.0 (17)
(b) The agent is penalized for not performing an ac-
tion that moves the classification in the right di-
rection. As shown in Eq. (18), the idea is to cal-
culate the velocity of the last action in relation to
the classification probability of the ground truth.
VelSc =
(
P
U
t
(gt) − P
U
t−1
(gt), t > 1
0, otherwise
(18)
Eq. (19) shows the final reward function after t
questions asked, with the same correlations to the cur-
rent group NG and the number of questions asked k
NG as in Eq. (13) is shown. The two components de-
fined above are averaged with configurable weights.
In our use case, we set the total reward component as
W
ov
= 0.8 and the velocity component as W
vel
= 0.2.
Reward
t
= OverallSc ∗W
ov
+VelSc ∗W
vel
(19)
After some evaluation, we decided to use the
asynchronous actor-critic method, more precisely
A2C(Mnih et al., 2016) from the class of policy-based
methods.
Table 1: Comparative results between HR professionals,
PathfindingAI (Paduraru. et al., 2024), and our proposed
method RLHR. Accuracy 1
st
indicates how many predic-
tions of the person’s profiles match the HR, which is consid-
ered the ground truth. The Accuracy 2
nd
for the two meth-
ods indicates how many of the incorrect predictions were
placed at the 2
nd
position in the probability distributions of
the output. The last column shows the average error be-
tween the probability assigned to the ground truth profile
and the probability of the predicted profile.
Evaluation
method
Accuracy
1
st
Accuracy
2
nd
Avg. Error
1
st
to 2
nd
HR
100%
(69)
0 0
PathfindingAI
62.3%
(43)
6.9%
(10)
∼ 0.221
RLHR
74%
(51)
21.7%
(15)
∼ 0.127
6 EVALUATION
The framework is evaluated from several perspec-
tives. First, quantitative and qualitative assessments
are presented to understand the ease of use from the
user’s perspective and the credibility of the methods.
Then, the computational effort required to conduct
scale surveys and retrain the RLHR agent is presented
to understand the practical usability. Finally, this sec-
tion presents post-survey analysis tools and lessons
learned from prototype development and previous ef-
forts.
Setup. Quantitative Evaluation. First, we try to
evaluate the correctness of the methods proposed in
this work by comparing them with an evaluation per-
formed in parallel by HR experts and the algorithm
PathfindingAI in (Paduraru. et al., 2024).
A sample of 69 people was selected by HR pro-
fessionals and interviewed in a similar way to that
described in the study, but face-to-face. After six
months, with no major post-survey interventions or
actions, we assessed the same individuals using the
proposed RLHR agent. Note that the dataset of as-
sets and questions used by the HR and RLHR agents
matched, but the questions and assets that were orig-
inally asked were replaced to avoid any bias. There
were a total of 1498 responses to the questions. The
results of the observed comparison follow:
Table 1 shows the results obtained by comparing
the supposed ground truth assessment of HR profes-
sionals in the client organization with the Pathfindin-
gAI and RLHR agents. The key observation is that the
RLHR agent implemented in our proposed framework
performs better than the state-of-the-art Pathfindin-
gAI method. Moreover, in many cases, the RLHR
RLHR: A Framework for Driving Dynamically Adaptable Questionnaires and Profiling People Using Reinforcement Learning
365

agent successfully classified the missing cases of the
1
st
ground truth profile at the 2
nd
position in the out-
put probability distribution. It left only three out of
69 classified individuals at the 3
rd
and 4
th
positions,
compared to the PathfindingAi, which left 16 individ-
uals. Furthermore, the error of the RLHR is signifi-
cantly lower for the misclassified examples, i.e. the
entropy between the ground truth profile and the pre-
dicted profile is high.
The method of removing bias based on time se-
ries improved the final results, as shown in Table 1.
More specifically, compared to the previous method
for identifying constant bias in (Paduraru. et al.,
2024), the new method improved the Accuracy 1
st
from 48 to 51 correctly predicted individuals, while
the Accuracy 2
nd
increased from 12 to 15.
7 CONCLUSIONS
The purpose of the RLHR framework is not to re-
place the experts in the HR departments of compa-
nies. Its main purpose is to create another layer be-
tween individuals and HR departments. The inter-
mediate layer we propose would improve the HR de-
partment’s survey processes and interventions and fo-
cus on the available resources where they are most
needed.
ACKNOWLEDGEMENTS
This research was supported by European Union’s
Horizon Europe research and innovation programme
under grant agreement no. 101070455, project DYN-
ABIC.
REFERENCES
Benesty, J., Chen, J., and Huang, Y. (2008). On the impor-
tance of the pearson correlation coefficient in noise
reduction. IEEE Transactions on Audio, Speech, and
Language Processing, 16(4):757–765.
Benvenuto, D. et al. (2020). Application of the arima model
on the covid-2019 epidemic dataset. Data in Brief,
29:105–340.
Cho, K. et al. (2014). Learning phrase representations using
RNN encoder–decoder for statistical machine trans-
lation. In Proceedings of the 2014 Conference on
Empirical Methods in Natural Language Processing
(EMNLP), pages 1724–1734, Doha, Qatar. Associa-
tion for Computational Linguistics.
Dee, D. (2006). Bias and data assimilation. In Proceed-
ings of the ECMWF Workshop on Bias estimation and
correction in data assimilation., pages 1–20.
Guti
´
errez, F. et al. (2023). Differentiating abnormal, nor-
mal, and ideal personality profiles in multidimen-
sional spaces. Journal of Individual Differences.
Khaled, S. et al. (2018). Detecting fake accounts on social
media. In IEEE International Conference on Big Data
(Big Data), pages 3672–3681.
Mannens, E. et al. (2013). Automatic news recommenda-
tions via aggregated profiling. Multimedia Tools and
Applications - MTA, 63.
Mnih, V. et al. (2016). Asynchronous methods for deep
reinforcement learning.
Ni, X. et al. (2017). Behavioral profiling for employees
using social media: A case study based on wechat.
In Chinese Automation Congress (CAC), pages 7725–
7730.
Paduraru., C., Cristea., R., and Stefanescu., A. (2024).
Adaptive questionnaire design using ai agents for peo-
ple profiling. In Proceedings of the 16th International
Conference on Agents and Artificial Intelligence - Vol-
ume 3: ICAART, pages 633–640.
Schermer, B. W. (2011). The limits of privacy in automated
profiling and data mining. Computer Law and Secu-
rity Review, 27(1):45–52.
Sutton, R. S. and Barto, A. G. (2018). Reinforcement Learn-
ing: An Introduction. A Bradford Book, Cambridge,
MA, USA.
Towers, M. et al. (2023). Gymnasium: An API standard
for single-agent reinforcement learning environments,
with popular reference environments and related utili-
ties (formerly gym) https://gymnasium.farama.org/.
Wang, Y. and Singh, L. (2021). Analyzing the impact of
missing values and selection bias on fairness. In-
ternational Journal of Data Science and Analytics,
12(2):101–119.
Wibawa, A. D. et al. (2022). Text mining for employee can-
didates automatic profiling based on application docu-
ments. EMITTER International Journal of Engineer-
ing Technology, 10:47–62.
Xia, P., Zhang, L., and Li, F. (2015). Learning similar-
ity with cosine similarity ensemble. Information sci-
ences, 307:39–52.
Yan, T., Keusch, F., and He, L. (2018). The impact of
question and scale characteristics on scale direction
effects. Survey Practice.
ICSOFT 2024 - 19th International Conference on Software Technologies
366
