
HybridCRS-TMS: Integrating Collaborative Recommender System and
TOPSIS for Optimal Transport Mode Selection
Mouna Rekik
1,2
, Rima Grati
3
, Ichrak Benmohamed
1
and Khouloud Boukadi
2 a
1
Higher Institute of Transport and Logistics of Sousse, Tunisia
2
University of Sfax, Multimedia, Information systems and Advanced Computing Laboratory, Tunisia
3
Zayed University, College of Technological Innovation, Abu Dhabi, U.A.E.
Keywords:
Collaborative Filtering, K-NN, Transport Mode Selection, Hybrid Decision, TOPSIS.
Abstract:
The pervasive influence of smartphones and mobile internet has revolutionized journey planning, particularly
transportation. With navigation applications delivering real-time information, recommender systems have
emerged as crucial tools for enhancing the travel experience. This paper introduces HybridCRS-TMS, a unique
Hybrid Collaborative Recommender System for Transport Mode Selection, leveraging a dataset of 260 pas-
sengers. Through advanced data mining techniques, specifically k-Nearest Neighbors (k-NN) for collaborative
recommendations and TOPSIS (Technique for Order of Preference by Similarity to Ideal Solution) analysis
for objective evaluation, the system provides personalized transportation mode recommendations. The model
not only demonstrates exceptional performance but also showcases the synergy between collaborative and
objective decision-making approaches, contributing to efficient, personalized, and well-informed travel solu-
tions. This study underscores the system’s versatility, illustrating its ability to optimize travel choices through
a hybrid recommendation framework that integrates both collaborative and objective criteria.
1 INTRODUCTION
The advent of smartphones and mobile internet has
significantly transformed modern living, particularly
in journey planning. These technological advance-
ments extend beyond traditional domains like e-
commerce and healthcare, reaching the transporta-
tion sector. Navigation applications have liberated
travelers from the hassle of paper maps and transit
timetables, introducing a dynamic aspect to decision-
making. Empowered by real-time information, pas-
sengers can explore transportation options based
on their starting point and destination, streamlining
route-searching and enabling informed decisions. In-
tegrating these technologies not only saves time but
also enhances the overall travel experience by provid-
ing tailored transportation choices aligned with pas-
sengers’ preferences and constraints (Liu et al., 2021).
Recommender systems, crucial in this transfor-
mation, contribute by providing personalized sugges-
tions and enhancing the overall travel experience.
These systems offer various transportation options,
ensuring passengers make informed choices based on
a
https://orcid.org/0000-0002-6744-711X
their preferences and needs.
In the transportation field, these systems assist in-
dividuals, including students, employees, and work-
ers, in selecting the most suitable mode of transporta-
tion, such as a taxi, shared taxi, bus, or car. They
significantly enhance the overall transportation expe-
rience by providing personalized recommendations
based on individual preferences and requirements.
In Tunisia, where citizens face diverse transportation
options and preferences, recommender systems help
streamline decision-making and mitigate challenges
associated with navigating various transport modes.
These systems tailor suggestions to users’ needs, op-
timizing travel choices and contributing to more effi-
cient and personalized transportation solutions.
Passengers in Tunisia can access various trans-
portation options, including shared taxis, buses, indi-
vidual taxis, and personal cars if public transportation
falls short. Shared taxis compete with buses, offer-
ing high speeds and frequencies despite limited ca-
pacity and sometimes chaotic organization. Individ-
ual taxis provide comfortable and fast service, though
at a higher cost. These transportation options play
a crucial role in passengers’ lives, allowing them to
choose the mode that best suits their needs in terms of
Rekik, M., Grati, R., Benmohamed, I. and Boukadi, K.
HybridCRS-TMS: Integrating Collaborative Recommender System and TOPSIS for Optimal Transport Mode Selection.
DOI: 10.5220/0012758300003753
Paper published under CC license (CC BY-NC-ND 4.0)
In Proceedings of the 19th International Conference on Software Technologies (ICSOFT 2024), pages 383-394
ISBN: 978-989-758-706-1; ISSN: 2184-2833
Proceedings Copyright © 2024 by SCITEPRESS – Science and Technology Publications, Lda.
383

convenience, cost, and speed.
Several existing research works focus solely on
either subjective selection approaches or objective
methods without exploring the potential benefits of a
hybrid selection approach. This limited scope raises
questions about the comprehensiveness of their rec-
ommendations and their ability to leverage the com-
bined strengths of both subjective and objective crite-
ria for a more nuanced and effective decision-making
process.
This paper introduces a novel two-phased recom-
mender system utilizing a collected dataset from 260
travelers. The unique two-step decision-making pro-
cess employs a collaborative filtering recommender
system in the first phase, delivering personalized rec-
ommendations based on similar users’ preferences.
What sets this work apart is the integration of a sec-
ond phase introducing the Technique for Order of
Preference by Similarity to Ideal Solution (TOPSIS)
method, adding a layer of objectivity and robustness
to transportation mode selection. Combining subjec-
tive and objective criteria, the hybrid approach en-
sures a comprehensive and effective decision-making
mechanism for transportation mode recommenda-
tions.
The paper is structured as follows: the first section
provides an overview of the related work. Section 3
details our proposed recommender system. Finally, in
section 4, we present the conclusion of the paper.
2 RELATED WORK
Recommendation systems in the transport sector are
of exponential interest due to their ability to assist
travelers in choosing the most convenient mode of
transportation.
The study in (Sun and Wandelt, 2021) utilizes ma-
chine learning on a travel recommendations dataset
and actual mode choices in Beijing, China. The data
is sourced from Baidu’s prototype route recommen-
dation system. Users received a summarized list of
recommended transportation modes for a specific ori-
gin/destination/time request and selected their pre-
ferred mode, leading to a detailed route.
The recommender system proposed by Wu et al.
(Wu et al., 2022) introduces an incremental scanning
method incorporating multiple time windows to ex-
tract multi-scale features from user behaviors. Addi-
tionally, a hierarchical behavior structure is devised
to alleviate the computational burden associated with
large data sets. The proposed framework aims to en-
hance social benefits by dynamically adjusting can-
didate modes based on real-time traffic states. This
adaptation can promote public transport use, allevi-
ate traffic congestion, and reduce environmental pol-
lution.
In the same context, (Arnaoutaki et al., 2021) in-
troduces a recommender system tailored for selecting
MaaS (Mobility as a Service) plans, aiding travelers
in choosing bundles of mobility services that align
with their everyday transportation needs. The rec-
ommender system filters out unsuitable plans, subse-
quently ranking the remaining options based on their
similarity to users’ characteristics, habits, and prefer-
ences.
The model proposed by (Lai et al., 2023), entitled
Balance Multi Travel Mode Deep Learning Prediction
(BMTM-DLP), applies the concept of recommender
systems to individual travel mode prediction. The
model is leveraged to extract individual travel prefer-
ences, enhancing the accuracy of travel mode predic-
tions. Additionally, introducing a focal loss function
module within the model mitigates the impact of un-
balanced categories, contributing to more robust and
balanced predictions. (Arnaoutaki et al., 2019) intro-
duces a knowledge-based recommender system that
utilizes constraint programming mechanisms. It of-
fers functionalities to capture user preferences, elim-
inate MaaS (Mobility as a Service) plans that do not
align with those preferences, and assess the similar-
ity of the remaining plans to the user’s profile. The
result is a filtered and ranked list of MaaS plans, en-
abling users to choose the one that best aligns with
their preferences.
In (Rodriguez-Valencia et al., 2022), research on
user satisfaction and ridership factors in public trans-
portation (PT) has been extensive. A significant
contribution is found in a study conducted in Bo-
got
´
a, Colombia, utilizing Structural Equation Mod-
eling (SEM) and Multiple Indicators Multiple Causes
(MIMIC) models. The study focuses on three PT bus
subsystems, including Bus Rapid Transit, a formal-
ized bus subsystem, and a semi-formalized counter-
part. It identifies latent variables such as ”condition,”
”service,” and ”safety/security” within each subsys-
tem, highlighting the varying strengths and signifi-
cance of direct and indirect effects. This research pro-
vides nuanced insights into the relationships among
infrastructure, vehicles, operational attributes, and
regulatory processes, offering valuable perspectives
for decision-makers aiming to improve PT services
and aligning with the broader discourse on enhancing
user experiences in transportation systems.
In the context of intelligent transportation, indi-
viduals typically decide on their preferred transport
modes based on personal inclinations and journey
characteristics. As the transportation landscape un-
ICSOFT 2024 - 19th International Conference on Software Technologies
384

dergoes a transformative shift with the introduction
of autonomous vehicles (AVs), it becomes crucial to
understand the potential impacts on traditional mode-
choice models. In this context, (Hamadneh and Es-
zterg
´
ar-Kiss, 2023) explores three transport modes:
conventional cars, privately owned autonomous vehi-
cles (PAVs), and shared autonomous vehicles (SAVs).
This study employs a discrete choice modeling ap-
proach to formulate a transportation mode choice
model. A stated preference (SP) methodology is uti-
lized, collecting 306 responses in Hungary. Individu-
als exhibit variations in their willingness to use a spe-
cific transport mode based on factors such as income,
family size, and current transportation habits.
In reviewing the related work, it is evident that
existing research in transportation recommender sys-
tems predominantly falls into two distinct categories,
each emphasizing specific aspects of the decision-
making process. On one hand, a substantial body
of work concentrates on understanding and incor-
porating users’ preferences into the recommenda-
tion process. On the other hand, another significant
strand of research focuses on the objective selection
of transport modes, emphasizing efficiency and prac-
tical decision-making.
While these two approaches have individually
demonstrated their effectiveness in addressing spe-
cific facets of the transportation recommendation
challenge, integrating user-centric and objective-
oriented elements remains a relatively underexplored
area. Combining insights from user preferences with
the rigor of objective decision-making methods could
yield a more versatile and adaptable recommender
system.
3 PROPOSED HYBRID
RECOMMENDER SYSTEM
Our HybridCRS-TMS recommender system intro-
duces a collaborative recommendation approach that
incorporates all essential components of such a sys-
tem. Moreover, we integrated a Multiple Criteria De-
cision Making (MCDM) method to enhance decision-
making by combining subjective and objective ele-
ments. This integration ensures a more robust selec-
tion of transportation modes, contributing to a com-
prehensive and effective decision-making process.
The collaborative filtering method has gained
widespread popularity and demonstrated significant
success in terms of accuracy. The underlying prin-
ciple of collaborative filtering methods involves ana-
lyzing users’ historical ordinal feedback information
to make predictions for recommendations. In simpler
terms, the system suggests items to a specific user
based on similar users’ preferences, independent of
the features of the items themselves (Alhijawi and Ki-
lani, 2020).
The HybridCRS-TMS, illustrated in Figure 1,
leverages collaborative filtering techniques to ana-
lyze user preferences, behaviors, and historical data,
providing personalized recommendations for various
transportation modes, including taxis, shared taxis,
buses, and private cars. The system incorporates user
profiles, historical usage patterns, and a collaborative
filtering algorithm to enhance the accuracy and rele-
vance of the recommendation. Through a comprehen-
sive approach, it considers the diverse factors influ-
encing transportation choices. The output of this sys-
tem is used as an input of the second decision phase
discussed in Section 3.4
3.1 Pre-Treatment of Collected Data
3.1.1 Data Collection
A meticulously crafted questionnaire was developed
to gather insights into passengers’ preferences and
profiles. Ensuring the acquisition of highly accurate
data was paramount for precise results. The question-
naire comprises 14 questions divided into two parts,
each designed to extract distinct yet valuable infor-
mation.
The first part is devoted to passengers’ profiles,
encompassing demographic details such as age, gen-
der, socio-professional category/function, reason for
travel, and the weekly allocated budget for trans-
portation. The second part focuses on the behavioral
aspects of transport users, including the reason for
travel, departure and arrival stops, days of travel, and
the preferred mode of transportation.
To guarantee a thorough understanding of the
questions by participants, a pre-test was conducted
among a sample of one hundred individuals. This pre-
liminary step aimed to assess the clarity and relevance
of the questions and identify any potential sources of
confusion. Feedback obtained during this pre-test was
carefully analyzed and contributed to refining the fi-
nal questionnaire. This proactive approach optimized
the quality of responses, ensuring that the questions
were understandable and pertinent to the diverse par-
ticipants.
During the three-week study conducted at the end
of February and the beginning of March 2023, 260
individuals aged 10 and above participated, each ded-
icating approximately ten minutes to complete the
questionnaire.
It’s vital to note that the questionnaire was tailored
HybridCRS-TMS: Integrating Collaborative Recommender System and TOPSIS for Optimal Transport Mode Selection
385
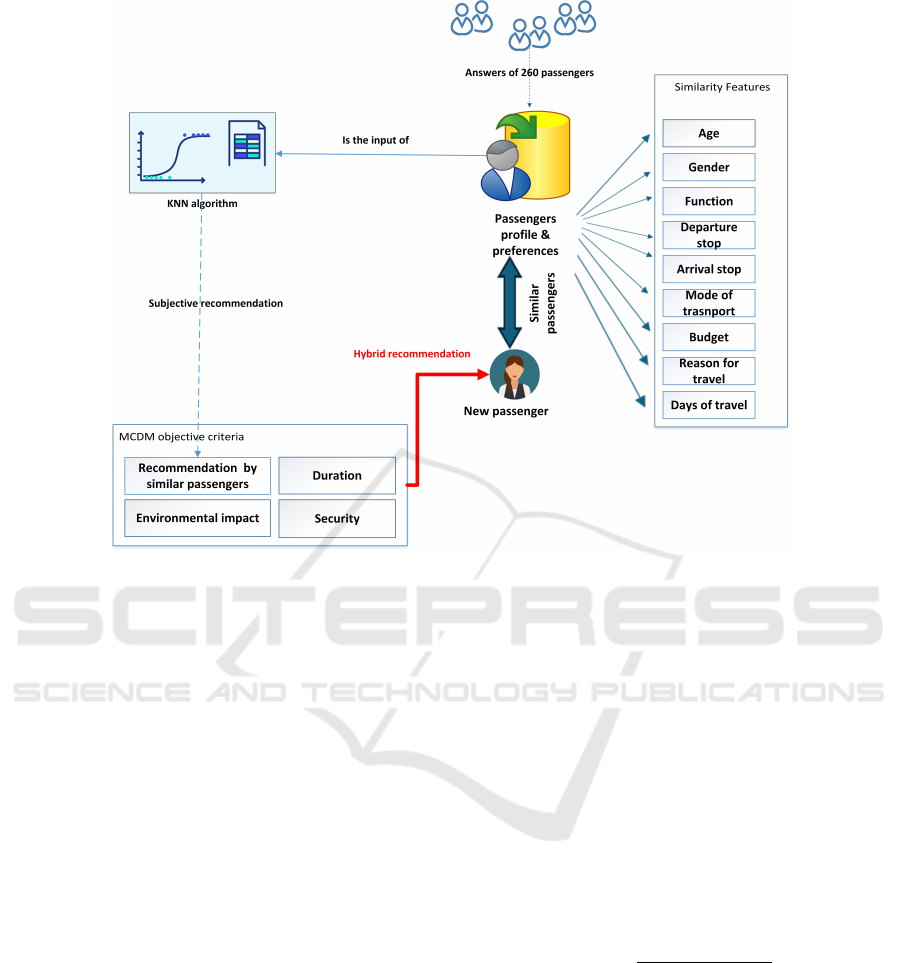
Figure 1: The proposed recommender system framework.
to capture citizens’ unique characteristics and prefer-
ences in the Sousse region of Tunisia.
3.1.2 Data Preprocessing
After the data collection phase, we proceed to a
pivot phase consisting of data preparation and pre-
treatment (Mariscal et al., 2010).
Table 1 explains in detail the dataset attributes.
This table provides information on each attribute. The
”Original values” column showcases the data as ini-
tially recorded or collected, while the ”Normalized
values” column represents the same data transformed
into a standardized format. This normalization pro-
cess ensures consistency, making it easier to analyze
and compare the attributes across the dataset.
The pre-processing phase for our HybridCRS-
TMS dataset comprises various essential steps. Ini-
tially, the dataset is loaded from an Excel file resulting
from the collection phase. Missing values are handled
through imputation using mean and mode for numer-
ical and categorical features. Categorical attributes
such as ’Reason for travel’,’Days of travel’, ’Func-
tion’,’Departure stop’ and ’Arrival stop’ are one-hot
encoded to convert them into a machine-learning-
friendly format.
One Hot Encoding is the predominant coding
scheme widely employed in data representation. This
method involves comparing every level of a cate-
gorical variable against a designated reference level.
Through One Hot Encoding, a single variable with
n observations and d distinct values is transformed
into d binary variables, each having n observations
(Kedar Potdar, 2017). The ’Transport modes’ col-
umn is transformed from a comma-separated string to
a list, and MultiLabelBinarizer is utilized to manage
this list-formatted data. It is straightforward to men-
tion that each passenger may use many transporta-
tion modes. Additionally, Min-Max scaling is applied
to normalize the ’Age’ and ’Budget’ attributes. The
Min-Max normalization transforms a variable x into a
new normalized variable x’ according to the equation
1:
x
′
=
x − min(x)
max(x) − min(x)
(1)
where
• x’ is the new normalized variable,
• x is the original variable,
• min(x) is the minimum value of x
• max(x) is the maximum value of x
In this pre-processing phase for our collected dataset,
instances associated with less frequently chosen
transportation modes are removed from the dataset.
This step is taken to streamline the dataset and focus
ICSOFT 2024 - 19th International Conference on Software Technologies
386
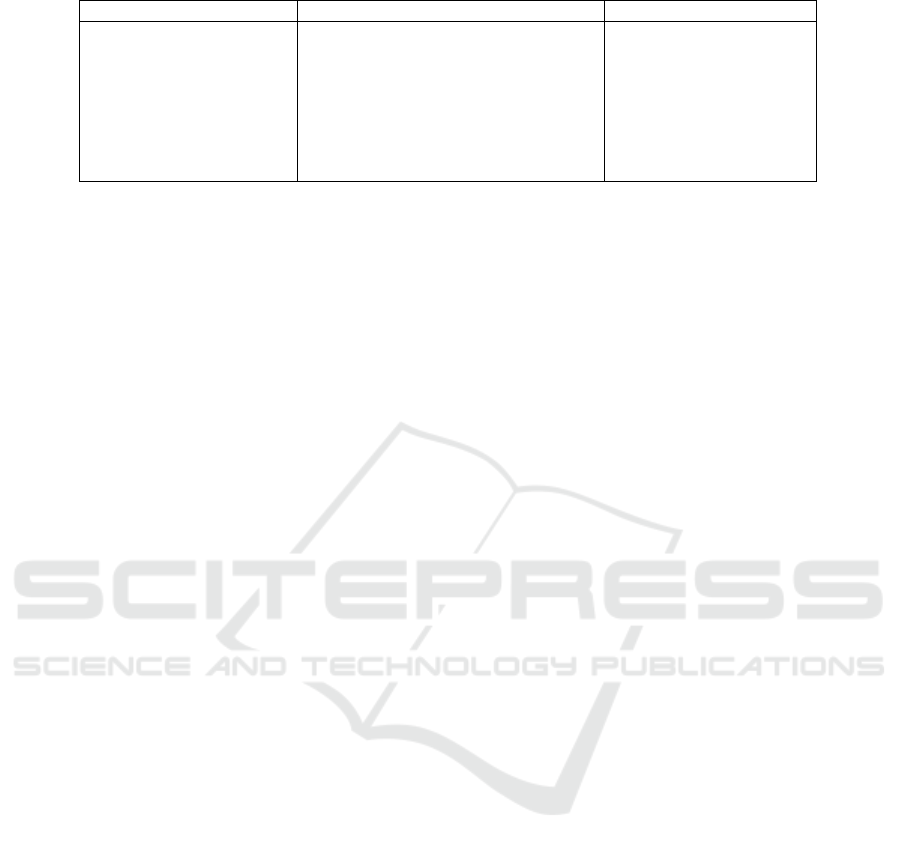
Table 1: Used dataset Attributes.
Attribute Original values Normalized values
Age [10..65] Scaled values [0 and 1]
Budget [3..35] Scaled values [0 and 1]
Gender [Male,Female] [ 1 : female, 0 : male]
Function Student, Worker, Trader, Retired... One-hot encoded columns
Departure and arrival stops 5 different stops One-hot encoded columns
Reason for travel Study, Health, Purchase, Leisure, Other One-hot encoded columns
Days of travel [’Monday’, ’Tuesday’,...] One-hot encoded columns
Transportation mode Bus, Taxi, shared Taxi, Car MultiLabelBinarizer
on more prevalent and representative transportation
choices. Removing instances with infrequent trans-
port mode selections aims to enhance the dataset’s
overall quality and relevance for subsequent analyses.
3.2 Collaborative Filtering System
In this first decision phase, we employ a collaborative-
based recommender system tailored to transportation
choices. This system analyzes passengers’ historical
preferences and usage patterns to identify similarities
among them.
To recommend the transportation mode most tai-
lored to a new passenger profile, we use the k-Nearest
Neighbors (k-NN) classification algorithm. k-NN is
a versatile and intuitive machine learning algorithm
for classification and regression tasks. Its fundamen-
tal principle is leveraging the proximity of data points
in the feature space to make predictions for new, un-
seen instances (Airen and Agrawal, 2022). In what
follows, we describe the K-NN algorithm.
1. Input: Training data X
train
, labels y
train
, test data
X
test
, number of neighbors k
2. Output: Predicted labels for test data
3. For each test instance x
test
∈ X
test
:
(a) Compute distances between x
test
and all train-
ing instances in X
train
(b) Select the top k neighbors based on distances
(c) Assign the class label by majority voting
among the k neighbors
Preparing and optimizing the k-NN classification
model for predicting transportation modes is a crucial
phase. The dataset is strategically split into training
and test sets, with 80% of instances designated for
training and the remaining 20% for testing. This en-
sures a robust evaluation of the model’s performance
on unseen data.
We conducted several experiments to determine
the optimal settings for the k-NN model. These ex-
periments involved the selection of the most suitable
distance metric, identifying prominent attributes, de-
termining an appropriate k value, and assessing how
the dataset’s size influences the model’s performance.
3.2.1 Selecting the Most Appropriate Distance
Metric
In Figure 2, we present the k-NN model’s accuracy
evaluation when employing various distance met-
rics, namely Euclidean, Manhattan, Chebyshev, and
Minkowski (Nayak et al., 2022). The test accura-
cies corresponding to each distance metric are as fol-
lows: 84.78% for Euclidean, 82.61% for Manhattan,
76.09% for Chebyshev, and 84.78% for Minkowski.
For the subsequent analyses and model applications,
we will utilize the Euclidean distance, given its rel-
atively higher accuracy than other metrics. This de-
cision is based on the observed superior performance
of the Euclidean metric in capturing the underlying
patterns in our dataset. These results provide insights
into the performance of the k-NN model under dif-
ferent distance calculations. Notably, the Euclidean
and Minkowski distances exhibit similar and rela-
tively higher accuracies compared to the Manhattan
and Chebyshev distances. This suggests that, in the
context of our dataset and problem domain, the dis-
tance metric choice significantly impacts the k-NN al-
gorithm’s predictive performance. The observed vari-
ations in accuracy underscore the importance of care-
fully selecting an appropriate distance metric tailored
to the characteristics of the data, as it can influence
the model’s ability to capture underlying patterns and
relationships.
3.2.2 The Impact of Attributes Elimination on
Model Performance
At the outset of our analysis, we conducted a series of
experiments to assess the impact of attribute elimina-
tion on the accuracy and F1-Score of our transporta-
tion mode recommendation model. This investigation
systematically removed different sets of attributes re-
lated to ’Function,’ ’Reason for travel,’ and ’Days of
travel’ from the dataset. The results of these exper-
iments were then visualized in the curve depicted in
Figure 3, where each point corresponds to a distinct
configuration of attribute elimination.
The x-axis of the graph indicates the number of
eliminated attributes, while the y-axis showcases the
HybridCRS-TMS: Integrating Collaborative Recommender System and TOPSIS for Optimal Transport Mode Selection
387
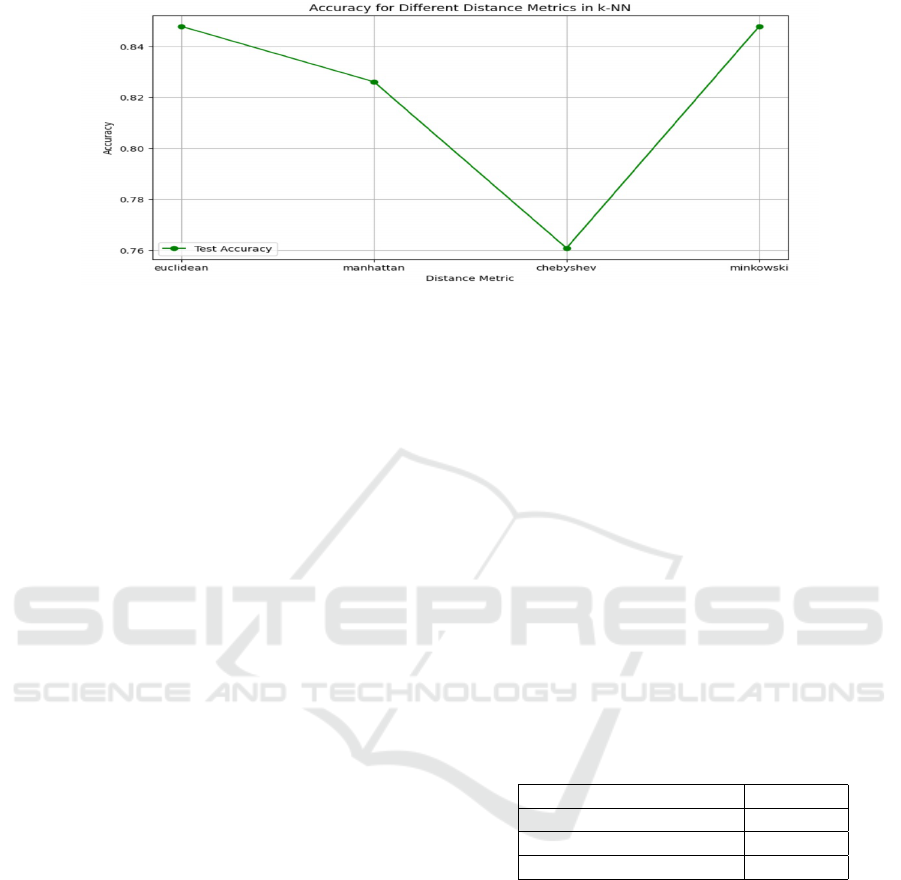
Figure 2: Accuracy related to each distance metric.
associated accuracy and F1-Score values. This graph-
ical representation allows us to discern patterns and
trends related to attribute elimination and better un-
derstand its effects on the model’s performance.
Elimination of ’Days,’ ’Function,’ and ’Reason’
resulted in the highest performance across all met-
rics. This suggests that these attributes may introduce
noise or redundancy to the model, and their concur-
rent removal enhances overall predictive accuracy.
3.2.3 The Selection of Best k Neighbour Value
To optimize the K-NN model, we utilized Grid-
SearchCV, a technique that systematically searches
through a specified parameter grid to find the com-
bination that yields the best performance.
We present in Figure 4 the validation curve for
the k-Nearest Neighbors classification model. This
curve illustrates the relationship between the number
of neighbors (k) and the model’s performance met-
rics, specifically the cross-validation score. The x-
axis represents different values of k, while the y-axis
showcases the corresponding cross-validation scores.
The validation curve is a crucial visualization tool that
allows us to explore how changes in the hyperparam-
eter (k) influence the model’s accuracy. By examin-
ing this curve, we can identify the optimal value of
k, which is 3, often called the ”elbow” point, where
the model achieves the best balance between bias and
variance. This analysis is pivotal for making informed
decisions about hyperparameter tuning and ensuring
the robustness and generalization capability of the k-
NN model.
3.2.4 Impact of the Dataset’s Size on the Model
Performance
The learning curve illustrated in Figure 5 depicts the
model’s performance in terms of accuracy concern-
ing the size of the training set. The cross-validation
curve starts when the training set size is relatively
small x=10, and the accuracy is approximately 0.51.
As the size of the training set increases, the curve
ascends, reaching a peak at a certain point x=140
with an accuracy of around 0.8. This indicates that
adding initial training data led to an improvement in
the model’s performance. The general interpretation
of this learning curve is that the model benefits from
adding more training data up to a certain point.
3.3 Recommender System’s Final
Settings and Performance
This section evaluates the final performance of our
system based on the findings of the experiments that
were conducted. Table 2 presents the used k-NN set-
tings.
Table 2: Best Parameters for k-NN Model.
Parameter Value
Number of Neighbors (k) 3
Weighting Method Distance
Distance Metric Euclidean
The outcomes were meticulously presented and
analyzed to evaluate the efficacy of our recommenda-
tion system, leveraging the k-NN classification model
with optimal parameters: 3 neighbors and distance-
based weighting. The selection of these parameters
signifies that, for the prediction, the system considers
the three nearest neighbors with distance-weighted
voting. This tailored approach ensures that our rec-
ommendation system operates with precision, taking
into account the characteristics and preferences of
users for a more personalized and effective transporta-
tion mode suggestion.
Our recommender system proves good perfor-
mance, with a cross-validation accuracy of 78.65%,
final model test accuracy of 84.78%.
ICSOFT 2024 - 19th International Conference on Software Technologies
388
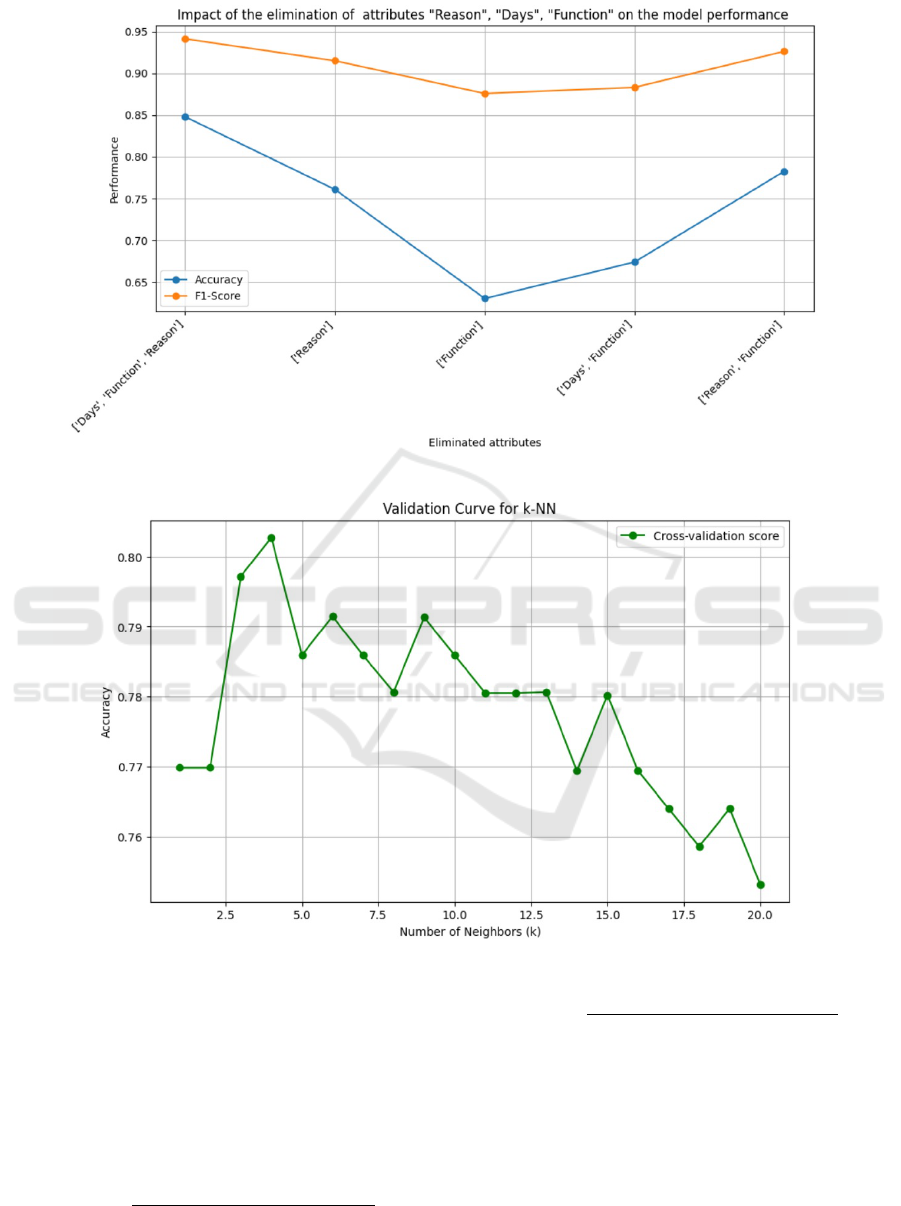
Figure 3: Impact of attributes elimination on model accuracy.
Figure 4: Validation curve.
In the context of supervised learning algorithms
and, more specifically, concerning our k-NN classifi-
cation algorithm, we evaluate the precision and recall
values. These metrics are the two important ones used
to evaluate the model’s performance, especially in bi-
nary or multilabel classification problems (Nguyen
et al., 2023). Equations 2 and 3 present the precision
and recall formulas used to evaluate our model.
Precision =
True Positive
True Positive + False Positive
(2)
Recall =
True Positive
True Positive + False Negative
(3)
The precision value of our model is 0.9600, which
means that approximately 96% of the instances pre-
dicted as positive by the model are true positives. This
is a high precision value, indicating that it is quite ac-
curate when the model predicts a positive class. Con-
cerning the recall value, which is 0.9231, it means that
the model has captured about 92.31% of all true pos-
itive instances in the dataset. Finally, our model has
an impressive F1-Score of 94.12%. We think that this
HybridCRS-TMS: Integrating Collaborative Recommender System and TOPSIS for Optimal Transport Mode Selection
389
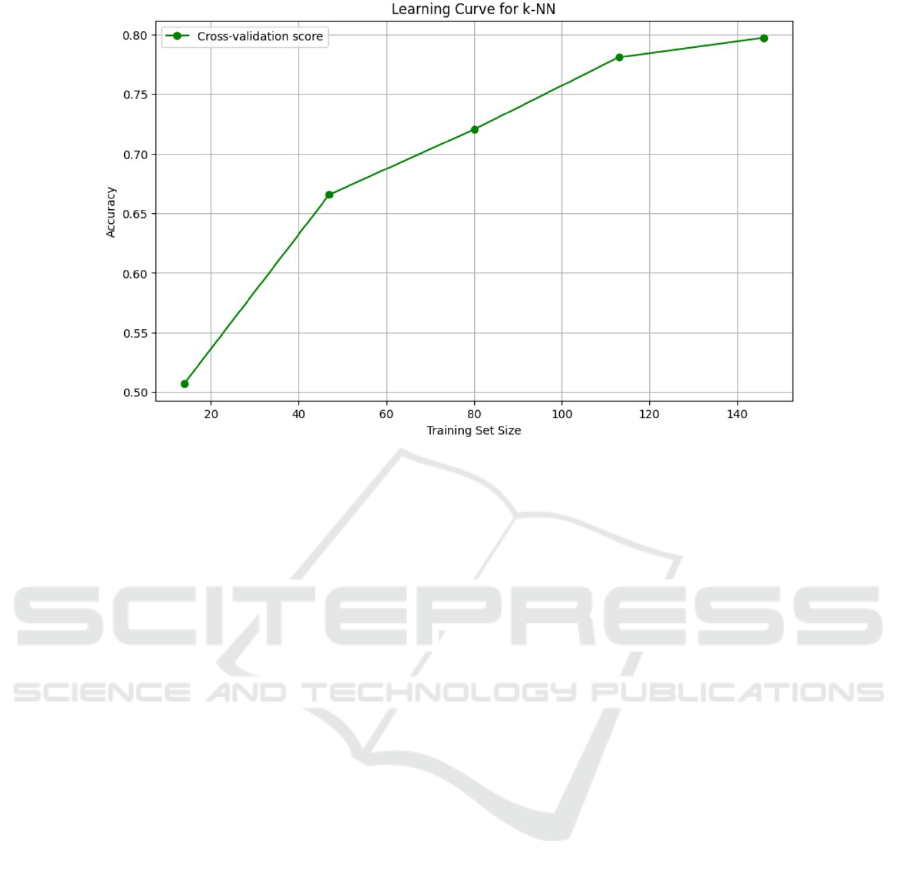
Figure 5: Learning curve.
is a high recall value, suggesting that the model is ef-
fective at identifying a large proportion of the actual
positive cases.
3.4 An MCDM Approach for Objective
Transport Mode Selection
To optimize the selection of a transport mode, we pro-
pose a hybrid decision-making approach that com-
bines traditional objective criteria with the person-
alized recommendations of our collaborative filter-
ing recommender system. Our multi-criteria decision
method integrates factors such as environmental im-
pact, security, and duration, ensuring a comprehen-
sive evaluation. The subjective element is introduced
by treating the output of the recommender system as
a distinct criterion, capturing user preferences.
Multicriteria Decision Making (MCDM) meth-
ods allow considering multiple criteria simultane-
ously during the decision-making process. The main
objective of MCDM is to provide tools and techniques
to assess, rank, and choose among alternatives, con-
sidering several factors or criteria. These methods
are particularly useful when decisions involve mul-
tiple and often conflicting considerations, requiring
a comprehensive evaluation. MCDM provides sys-
tematic frameworks to structure and analyze complex
problems by integrating qualitative and quantitative
information. These methods assist in prioritizing op-
tions, evaluating trade-offs, and facilitating informed
decision-making in contexts where multiple criteria
need to be considered. In summary, MCDM aims to
aid decision-makers in navigating complex situations
by providing systematic and objective approaches to
assess and compare different alternatives (Taherdoost
and Madanchian, 2023).
To propose a comprehensive system incorporating
the subjective and objective criterion and to perform
the final selection, we will employ the Technique for
Order of Preference by Similarity to Ideal Solution
(TOPSIS) (Chakraborty, 2022) as our multi-criteria
decision method. This approach allows for a bal-
anced consideration of both objective and subjective
aspects, facilitating a well-rounded and personalized
transport mode recommendation.
TOPSIS approach is widely employed for ranking
and selecting alternatives in decision-making scenar-
ios involving multiple criteria. TOPSIS operates in
several key steps: it starts by normalizing a decision
matrix to ensure uniformity in scale across different
criteria. If criteria have varying levels of importance,
weights can be assigned to reflect their relative sig-
nificance. The method defines both an ideal solu-
tion, representing the best possible performance for
each criterion, and an anti-ideal solution, represent-
ing the worst performance. The Euclidean distance
or other distance measures are then used to calculate
the proximity of each alternative to these solutions.
Based on this distance calculation, TOPSIS assigns
similarity scores to alternatives. The closer an alter-
native is to the ideal solution, the farther it is from
the anti-ideal solution, the higher its similarity score.
In the final step, alternatives are ranked according to
similarity scores, providing a clear preference order.
TOPSIS is valued for its simplicity and effectiveness
ICSOFT 2024 - 19th International Conference on Software Technologies
390

in handling both positive and negative aspects of de-
cision criteria. It offers decision-makers a straightfor-
ward method for selecting the most preferred option
in complex decision environments.
The versatility of TOPSIS is evident in its ex-
tensive application across various domains. It has
been successfully employed in diverse fields such as
purchase decisions and outsourcing provider selec-
tion (Kahraman et al., 2009), manufacturing decision-
making financial performance analysis, service qual-
ity assessment, educational selection applications,
technology selection, material selection, product se-
lection, strategy evaluation, and critical mission plan-
ning. This broad spectrum of applications under-
scores the adaptability and effectiveness of TOPSIS in
addressing decision-making challenges across differ-
ent contexts(Chiharu Nanayakkara and Moayedikia,
2020).
3.4.1 TOPSIS Methodology
In this section, we will describe the key steps of the
TOPSIS method.
• Normalization: The first step involves normaliz-
ing the decision matrix, denoted as X, where x
i j
represents the performance of alternative i on cri-
terion j. Normalization is typically achieved us-
ing the Min-Max normalization method.
• Weighting: If criteria have different importance
levels, weights (w
j
) can be assigned. The
weighted normalized decision matrix is then ob-
tained:
v
′
i j
= w
j
· x
′
i j
• Ideal and Anti-Ideal Solutions: The ideal solution
(A
∗
) and anti-ideal solution (A
−
) are determined
based on the nature of the criterion (maximization
or minimization):
A
∗
j
= max(v
′
j
), A
−
j
= min(v
′
j
)
where v
′
j
represents the j-th column of the
weighted normalized decision matrix.
• Distance calculation: The Euclidean distance (D
+
and D
−
) is then computed for each alternative
concerning the ideal and anti-ideal solutions:
D
+
i
=
s
m
∑
j=1
(v
′
i j
− A
∗
j
)
2
, D
−
i
=
s
m
∑
j=1
(v
′
i j
− A
−
j
)
2
where m is the number of criteria.
• Similarity Scores: The relative closeness of each
alternative is assessed using the following similar-
ity score:
S
i
=
D
−
i
D
+
i
+ D
−
i
• Ranking: Alternatives are ranked based on sim-
ilarity scores, with higher scores indicating a
higher preference.
TOPSIS is known for its simplicity and effectiveness
in handling both positive and negative aspects of de-
cision criteria. It provides a clear ranking of alter-
natives, aiding decision-makers in selecting the most
preferred option based on multiple criteria.
3.4.2 Decision Objective Criteria
Criteria used for a hybrid transport mode (Bus, shared
taxi, individual taxi, and car) selection are Recom-
mendation by similar passenger, Environmental im-
pact, Security, and Duration
• Recommendation by a similar passenger: Binary
(0 for not recommended and 1 for recommended).
The ”recommendation by similar passenger cri-
terion” introduces a subjective element into the
decision-making process by considering the out-
put of our recommender system as a distinct cri-
terion. This criterion captures user preferences by
assigning a binary score, where 1 indicates that
the transportation mode is recommended by the
collaborative filtering recommender system, and
0 denotes a non-recommended mode. In the final
decision-making process, this criterion holds sig-
nificance as it encourages the selection of a trans-
port mode recommended by our collaborative fil-
tering recommender system. This approach aligns
the decision with user preferences inferred from
similar passengers, aiming to enhance the trav-
eler’s overall satisfaction and personalized expe-
rience.
• The environmental impact of transportation
modes, specifically CO
2
emissions, is a crucial
criterion for objective mode selection. The emis-
sions calculation considers various factors, in-
cluding distance traveled, fuel efficiency, and
emission factors. For public transportation modes
like buses and taxis, the emissions formula incor-
porates a Passenger Occupancy Factor (POF) to
account for the influence of passenger numbers:
Emissions
bus/taxi
=Distance × Fuel Efficiency
× Emission Factor × POF
(4)
HybridCRS-TMS: Integrating Collaborative Recommender System and TOPSIS for Optimal Transport Mode Selection
391

In this formula, POF indicates the ratio of passen-
gers on board relative to the vehicle’s maximum
capacity. Higher POF values result in reduced
emissions per passenger.
For individual modes such as cars or individual
taxis, the occupancy factor is usually fixed at 1, 2
respectively (assuming one passenger per car and
2 passengers per individual taxi). In these cases,
the impact of occupancy on emissions is less sig-
nificant, and the formula simplifies to:
Emissions
car/taxi
=Distance × Fuel Efficiency
× Emission Factor
(5)
The Distance metric in the formula refers to the
anticipated distance that the new passenger will
travel based on their indicated departure and ar-
rival stops. This information is derived from route
planning algorithms that estimate the distance be-
tween two specified locations. It signifies the spa-
tial extent that the passenger is expected to cover
during their intended journey. This personalized
distance parameter ensures that the emissions cal-
culation is tailored to the unique travel require-
ments of each passenger, contributing to a more
precise estimation of the environmental impact.
The Fuel Efficiency metric (see equation 6) is a
crucial component in the calculation of carbon
dioxide CO
2
emissions for different transporta-
tion modes. It reflects the efficiency of a vehicle
in utilizing fuel to generate the required energy
for propulsion. Generally measured in units like
Miles Per Gallon (MPG) for traditional vehicles
or equivalent metrics for alternative fuel sources,
the fuel efficiency value indicates how far a ve-
hicle can travel on a specific amount of fuel. In
the context of our environmental impact assess-
ment, higher fuel efficiency values are desirable
as they denote a more eco-friendly performance
with fewer emissions produced per unit of dis-
tance traveled. This metric plays a significant role
in evaluating the sustainability of each transporta-
tion mode, aligning with the broader goal of min-
imizing the carbon footprint associated with pas-
senger journeys.
Fuel Efficiency =
Distance
Fuel Consumption
(6)
Distance represents the total distance traveled by
the vehicle, which can be the distance between
a specific passenger’s departure and arrival stops.
Fuel Consumption is the vehicle’s fuel consump-
tion during the journey. This value is specific
to each mode of transportation and can be ob-
tained from vehicle specifications or real-world
measurements.
• Security: Accident statistics play a crucial role in
assessing the security level of each mode of trans-
portation. The security level is determined by ana-
lyzing historical accident data, providing valuable
insights into the safety performance of different
transportation modes. A lower accident rate is in-
dicative of a higher security level. The formula
used for computing the security level is expressed
as:
Security Level = 1 −
Accident Rate
Max Accident Rate
(7)
In this formula, Accident Rate represents the his-
torical accident rate specific to each mode of
transportation, while Max Accident Rate is a hy-
pothetical maximum accident rate. The resulting
Security Level is a normalized value between 0
and 1, where 0 indicates a lower security level
(higher accident rate), and 1 signifies a higher se-
curity level (lower accident rate). It’s essential to
note that the accident data utilized in this evalua-
tion is sourced from the Tunisian National Road
Safety Observatory (ONSR). For detailed acci-
dent statistics, the interested reader can refer to
the ONSR website
1
.
• Duration: Estimating the average duration for
each mode of transportation involves using the
TrackGPS tool
2
. This tool provides valuable
insights into the average duration of traveling
routes, considering the habitual paths of each
transportation mode. Additionally, it factors in the
average duration of stops for public transportation
modes. By leveraging the capabilities of Track-
GPS, we can obtain reliable and real-world data to
enhance the accuracy of our duration assessments.
3.4.3 Use Case of TOPSIS Evaluation
In our study, we sought the expertise of a transport
specialist to assign appropriate weights to various cri-
teria. The expert, utilizing a ten-point scale where
1 indicates not at all important criterion and 10 de-
notes very important criterion, meticulously evaluated
transportation criteria (see Table 4.
In our evaluation of transportation alternatives,
various criteria were considered to provide a com-
prehensive assessment of each mode. Table 3 sum-
marizes the data evaluation for four transportation
1
https://onsr.nat.tn/onsr/index.php?page=3fr
2
https://trackgps.ro/en/
ICSOFT 2024 - 19th International Conference on Software Technologies
392
Table 3: Data Evaluation for Transportation Alternatives.
Alternative Recommendation by similar passengers Environmental Impact Security Duration
Car 1 1.68 6.8 20
Shared Taxi 0 7.29 7.2 30
Individual Taxi 1 2.92 4.5 25
Bus 1 0.192 9.0 35
Table 4: Weights assigned by the transport specialist to eval-
uation criteria.
Criteria Weight
Recommendation by similar passengers 6
Environmental Impact (CO
2
Emissions) 8
Security (Accident Statistics) 8
Duration 9
alternatives: Car, Shared Taxi, Individual Taxi, and
Bus. The ”Recommendation by Similar Passengers”
column reflects a binary value, indicating whether
the transportation mode is recommended by similar
passengers (1 for recommended, 0 for not recom-
mended).
The ”Environmental Impact (kg CO
2
)” column
represents the estimated CO
2
emissions for each
transportation mode over a distance of 7 km, assum-
ing the use of gasoil as fuel. Notably, the values range
from 0.192 kg CO
2
for the Bus, known for its eco-
friendly features, to 7.29 kg CO
2
for the Shared Taxi,
reflecting its potentially higher environmental impact.
The ”Security” column assigns security scores
to each mode, considering factors such as histori-
cal accident statistics. Higher security scores indi-
cate modes with lower accident rates, contributing to
a safer travel experience. For instance, the Bus re-
ceived a security score of 9.0, emphasizing its per-
ceived safety.
The ”Duration” column provides the duration for
each mode, representing the average time it takes to
complete the 7-kilometer journey. These durations,
measured in minutes, were estimated using Track-
GPS, a tool that tracks and estimates transportation
durations based on real-world data. The final re-
sults corresponding to the TOPSIS ranking and scores
are presented in Table 5. The TOPSIS analysis pro-
vides valuable insights into the performance of differ-
Table 5: TOPSIS scores and ranking for transportation al-
ternatives.
Alternative TOPSIS Score Rank
Car 0.45812809 2
Shared Taxi 0.41078759 3
Individual Taxi 0.39101742 4
Bus 0.66696562 1
ent transportation alternatives based on multiple crite-
ria, including recommendation by similar passengers,
environmental impact (CO
2
emissions), security (ac-
cident statistics), and duration. The results reveal a
comprehensive evaluation, with each alternative as-
signed a TOPSIS score and corresponding rank.
Starting with the Bus, it emerges as the top-
ranking alternative, securing the lowest TOPSIS score
of 0.3910. This indicates that the Bus performs excep-
tionally well across the considered criteria, showcas-
ing the most favorable balance and proximity to the
ideal solution.
The Car follows closely with a TOPSIS score of
0.4108, earning the second position in the ranking.
While it performs well, it falls just short of the Bus
alternative in achieving an optimal balance across the
criteria.
The Shared Taxi takes the third position with a
TOPSIS score of 0.4581. It demonstrates a good over-
all performance but is outranked by both the Bus and
Car alternatives.
Finally, the Individual Taxi secures the highest
TOPSIS score of 0.66697 but ranks fourth. Although
it excels in certain criteria, the overall evaluation
places it behind the other alternatives.
In summary, the TOPSIS analysis suggests that,
for a specific new passenger profile with predefined
preferences, the Bus stands out as the most favorable
transportation mode, offering a well-balanced perfor-
mance across various criteria. At the same time, the
Individual Taxi, despite being a good choice in certain
aspects, falls behind in the overall ranking.
4 CONCLUSION
This paper presented a comprehensive two-phased
approach for transportation mode recommendation,
blending collaborative filtering with the k-NN al-
gorithm and the TOPSIS method. The initial
phase focuses on refining subjective recommenda-
tions through collaborative filtering, ensuring accu-
rate and personalized suggestions for users. The sub-
sequent phase employs TOPSIS to introduce an ob-
jective dimension, evaluating modes based on crite-
ria such as environmental impact, security, and dura-
tion. This hybrid decision-making model combines
HybridCRS-TMS: Integrating Collaborative Recommender System and TOPSIS for Optimal Transport Mode Selection
393

both subjective user preferences and objective evalu-
ations, offering a more nuanced and comprehensive
solution to transportation mode selection.
Furthermore, the proposed approach stands out
for its ability to integrate both objective and sub-
jective factors seamlessly. By incorporating user
preferences and incorporating objective criteria, the
hybrid decision-making model aims to provide a
well-rounded recommendation system. This unique
combination enhances the robustness and adaptabil-
ity of the system, catering to individual user needs
while considering broader performance indicators.
As a result, the hybrid model introduces a balanced
and effective approach to transportation mode selec-
tion, fostering a more sustainable and user-centric
decision-making process.
As future work, we envision a further investiga-
tion that involves expanding our research in two key
areas: collecting more comprehensive passenger data
and evaluating additional recommender system algo-
rithms.
REFERENCES
Airen, S. and Agrawal, J. (2022). Movie recommender
system using k-nearest neighbors variants. National
Academy Science Letters, 45(1):75–82.
Alhijawi, B. and Kilani, Y. (2020). A collaborative filtering
recommender system using genetic algorithm. Infor-
mation Processing & Management, 57(6):102310.
Arnaoutaki, K., Bothos, E., Magoutas, B., Aba, A., Es-
zterg
´
ar-Kiss, D., and Mentzas, G. (2021). A recom-
mender system for mobility-as-a-service plans selec-
tion. Sustainability, 13(15).
Arnaoutaki, K., Magoutas, B., Bothos, E., and Mentzas, G.
(2019). A hybrid knowledge-based recommender for
mobility-as-a-service. In ICETE (1), pages 101–109.
Chakraborty, S. (2022). Topsis and modified topsis: A
comparative analysis. Decision Analytics Journal,
2:100021.
Chiharu Nanayakkara, William Yeoh, A. L. and
Moayedikia, A. (2020). Deciding discipline,
course and university through topsis. Studies in
Higher Education, 45(12):2497–2512.
Hamadneh, J. and Eszterg
´
ar-Kiss, D. (2023). The prefer-
ences of transport mode of certain travelers in the age
of autonomous vehicle. Journal of Urban Mobility,
3:100054.
Kahraman, C., Engin, O.,
¨
Ozg
¨
ur Kabak, and
˙
Ihsan Kaya
(2009). Information systems outsourcing decisions
using a group decision-making approach. Engineering
Applications of Artificial Intelligence, 22(6):832–841.
Artificial Intelligence Techniques for Supply Chain
Management.
Kedar Potdar, Taher S. Pardawala, C. D. P. (2017). A com-
parative study of categorical variable encoding tech-
niques for neural network classifiers. International
Journal of Computer Applications, 175(4):7–9.
Lai, Z., Wang, J., Zheng, J., Ding, Y., Wang, C., and Zhang,
H. (2023). Travel mode choice prediction based on
personalized recommendation model. IET Intelligent
Transport Systems, 17(4):667–677.
Liu, Y., Lyu, C., Liu, Z., and Cao, J. (2021). Exploring a
large-scale multi-modal transportation recommenda-
tion system. Transportation Research Part C: Emerg-
ing Technologies, 126:103070.
Mariscal, G., Marb
´
an, O., and Fern
´
andez, C. (2010). A sur-
vey of data mining and knowledge discovery process
models and methodologies. The Knowledge Engineer-
ing Review, 25(2):137–166.
Nayak, S., Bhat, M., Reddy, N. V. S., and Rao, B. A. (2022).
Study of distance metrics on k - nearest neighbor al-
gorithm for star categorization. Journal of Physics:
Conference Series, 2161(1):012004.
Nguyen, L. V., Vo, Q.-T., and Nguyen, T.-H. (2023). Adap-
tive knn-based extended collaborative filtering recom-
mendation services. Big Data and Cognitive Comput-
ing, 7(2).
Rodriguez-Valencia, A., Ortiz-Ramirez, H. A., Simancas,
W., and Vallejo-Borda, J. A. (2022). Understanding
transit user satisfaction with an integrated bus system.
Journal of Public Transportation, 24:100037.
Sun, X. and Wandelt, S. (2021). Transportation mode
choice behavior with recommender systems: A case
study on beijing. Transportation Research Interdisci-
plinary Perspectives, 11:100408.
Taherdoost, H. and Madanchian, M. (2023). Multi-criteria
decision making (mcdm) methods and concepts. En-
cyclopedia, 3(1):77–87.
Wu, F., Lyu, C., and Liu, Y. (2022). A personalized rec-
ommendation system for multi-modal transportation
systems. Multimodal Transportation, 1(2):100016.
ICSOFT 2024 - 19th International Conference on Software Technologies
394
