
Backdoor Attacks During Retraining of Machine Learning Models: A
Mitigation Approach
∗
Matthew Yudin, Achyut Reddy, Sridhar Venkatesan and Rauf Izmailov
Peraton Labs, Basking Ridge, NJ, U.S.A.
Keywords:
Concept Drift, Adversarial Machine Learning, Mitigation.
Abstract:
Machine learning (ML) models are increasingly being adopted to develop Intrusion Detection Systems (IDS).
Such models are usually trained on large, diversified datasets. As a result, they demonstrate excellent perfor-
mance on previously unseen samples provided they are generally within the distribution of the training data.
However, as operating environments and the threat landscape change over time (e.g., installations of new ap-
plications, discovery of a new malware), the underlying distributions of the modeled behavior also change,
leading to a degradation in the performance of ML-based IDS over time. Such a shift in distribution is referred
to as concept drift. Models are periodically retrained with newly collected data to account for concept drift.
Data curated for retraining may also contain adversarial samples i.e., samples that an attacker has modified
in order to evade the ML-based IDS. Such adversarial samples, when included for re-training, would poison
the model and subsequently degrade the model’s performance. Concept drift and adversarial samples are both
considered to be out-of-distribution samples that cannot be easily differentiated by a trained model. Thus,
an intelligent monitoring of the model inputs is necessary to distinguish between these two classes of out-
of-distribution samples. In the paper, we consider a worst-case setting for the defender in which the original
ML-based IDS is poisoned through an out-of-band mechanism. We propose an approach that perturbs an input
sample at different magnitudes of noise and observes the change in the poisoned model’s outputs to determine
if an input sample is adversarial. We evaluate this approach in two settings: Network-IDS and an Android
malware detection system. We then compare it with existing techniques that detect either concept drift or ad-
versarial samples. Preliminary results show that the proposed approach provides strong signals to differentiate
between adversarial and concept drift samples. Furthermore, we show that techniques that detect only concept
drift or only adversarial samples are insufficient to detect the other class of out-of-distribution samples.
1 INTRODUCTION
The spectacular successes of machine learning (ML)
applications are driven by advanced neural network
architectures and large diverse datasets that are used
to efficiently train ML models. As a result, there has
been an increased adoption of ML-based models for
developing Intrusion Detection Systems (IDS). How-
ever, traditional training and deployment pipelines for
a ML-based IDS are vulnerable to attacks in which an
adversary can control a model’s output by manipulat-
∗
This material is based upon work supported by the In-
telligence Advanced Research Projects Agency (IARPA)
and Army Research Office (ARO) under Contract No.
W911NF-20-C-0034. Any opinions, findings and con-
clusions or recommendations expressed in this material
are those of the author(s) and do not necessarily reflect
the views of the Intelligence Advanced Research Projects
Agency (IARPA) and Army Research Office (ARO).
ing the data provided as input to the model. Thus,
it is important to monitor the inputs to an ML model
to make sure they are suitable for its operation and
to maintain an appropriate level of confidence in the
model’s outputs.
Data to a trained model (i.e., test data) can
be characterized as either in-distribution or out-of-
distribution. In-distribution data can be either data
present during the training of the model, or data that is
statistically similar to the training data. Deep Learn-
ing (DL) and ML models are known to show excellent
performance on previously unseen data provided that
their statistical distribution is similar to the training
dataset. Out-of-distribution (OOD) data, on the other
hand, is unseen data that is not statistically similar to
the training dataset. By definition, trained models are
expected to perform poorly on OOD data.
In a cyber setting, OOD samples can be broadly
categorized into two types depending on how they
140
Yudin, M., Reddy, A., Venkatesan, S. and Izmailov, R.
Backdoor Attacks During Retraining of Machine Lear ning Models: A Mitigation Approach.
DOI: 10.5220/0012761600003767
Paper published under CC license (CC BY-NC-ND 4.0)
In Proceedings of the 21st International Conference on Security and Cryptography (SECRYPT 2024), pages 140-150
ISBN: 978-989-758-709-2; ISSN: 2184-7711
Proceedings Copyright © 2024 by SCITEPRESS – Science and Technology Publications, Lda.
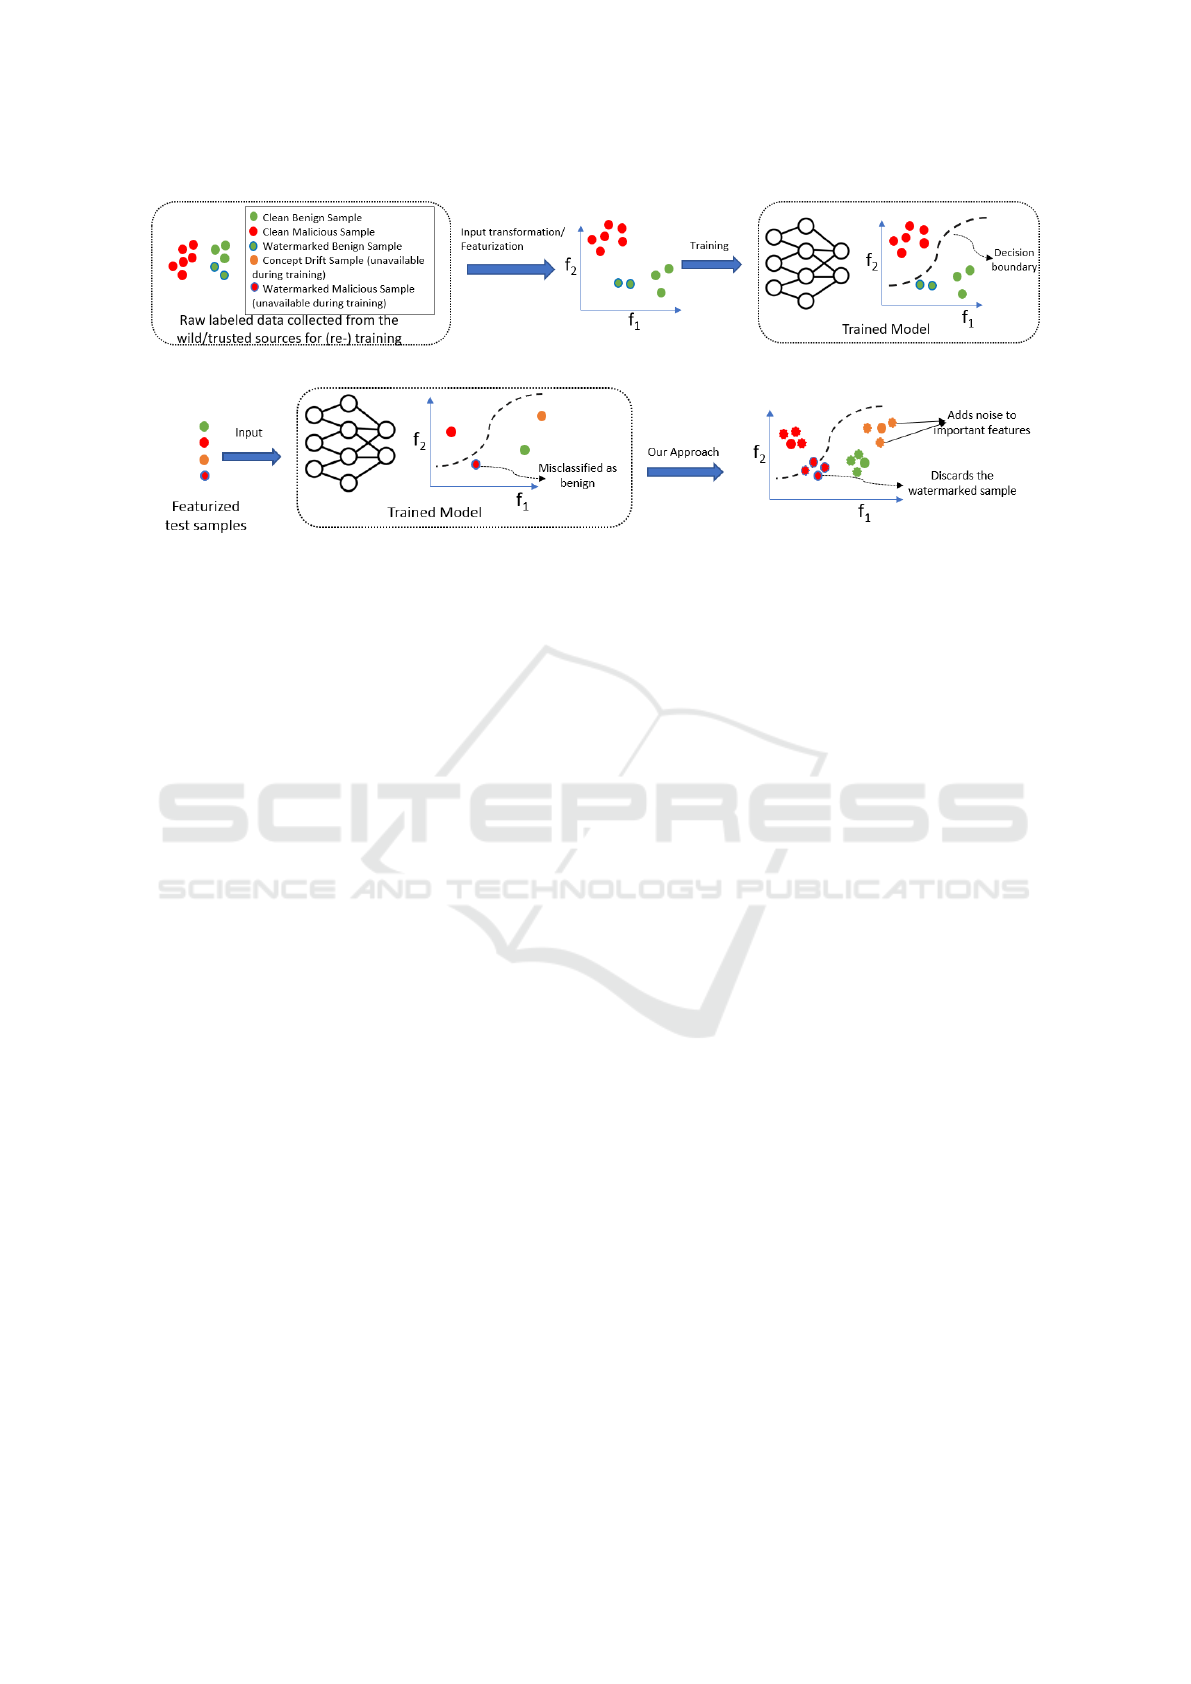
(a) ML-based IDS training pipeline
(b) IDS testing pipeline with our approach
Figure 1: (a) Depicts a typical ML-based IDS training pipeline in the presence of a clean-label poisoning attack wherein the
trained model associates a watermark with the benign label and (b) shows how an adversary can evade a poisoned model by
adding the learned watermark to malicious samples. The proposed approach perturbs input samples to a model and uses the
degree of change in logits of the perturbed samples to determine if the input sample is watermarked to evade classification.
were materialized: Concept drift samples and Adver-
sarial samples. Concept drift samples are manifested
when the operating environment and sample distribu-
tions change significantly over a period of time. For
instance, consider the case of a network IDS that clas-
sifies intercepted traffic as either benign or malicious.
When a new network application is installed, its traf-
fic characteristics may deviate from the benign traffic
distribution of the original training dataset and sub-
sequently, the trained model may misclassify the new
benign traffic as malicious. As a result, it is recom-
mended to retrain a ML-based IDS periodically with
the newly collected data containing the identified con-
cept drift samples (Yang et al., 2021).
Adversarial samples, on the other hand, are
crafted by adversaries to intentionally evade a ML
model (Szegedy et al., 2014; Carlini and Wagner,
2017). In particular, adversaries perturb the charac-
teristics of a malicious sample with the goal of de-
ceiving an ML model into mis-classifying it as be-
nign. Adversarial attacks against an ML model can
be broadly categorized as either evasion or poisoning.
While evasion attacks against IDS have been explored
extensively in the past (Corona et al., 2013; Abaid
et al., 2017), recently researchers have explored the
feasibility of poisoning attacks in cyber security set-
tings (Severi et al., 2021; Yang et al., 2023a). Among
the different classes of poisoning attacks, backdoor
poisoning attacks have been identified as one of the
biggest concerns to ML practitioners (Siva Kumar
et al., 2020). In this attack, adversaries inject a wa-
termark into a small subset of the training samples
such that the trained model associates the watermark
with the label desired by the adversaries. After de-
ployment, the poisoned model classifies samples con-
taining the watermark with the adversary-desired la-
bel. In the presence of adversarial samples, it is cru-
cial that only concept drift samples are considered
for retraining while the adversarial samples are dis-
carded. Existing work focuses on either the detec-
tion of concept drift (Yang et al., 2021) or mitigation
of attacks (Yudin and Izmailov, 2023). In this paper,
we consider the worst-case setting for a defender in
which a model is considered to be already poisoned
with a backdoor through an out-of-band mechanism,
and for such a setting, we develop an approach to de-
tect adversarial samples in the presence of concept
drift samples.
We consider a typical training and testing pipeline
of a ML-based IDS in the presence of adversarial and
concept drift samples as shown in Figure 1. Raw data
for training such models originate from both trusted
sources (e.g., data collected from the network) and
from un-trusted sources (e.g., malicious samples from
the wild). As shown in Figure 1a, adversaries may
introduce watermark samples that are labeled benign
and poison the trained model to associate samples
containing the watermark with the benign label. Note
that the watermarked samples may have been present
during initial training or may have appeared as a con-
cept drift sample during an earlier retraining phase.
During testing, as shown in Figure 1b, inputs to the
model can be either OOD data (i.e., watermarked ma-
licious sample or concept drift data) or in- distribu-
Backdoor Attacks During Retraining of Machine Learning Models: A Mitigation Approach
141

tion data (i.e., clean benign or malicious data). In
the absence of an input monitoring system, water-
marked malicious samples will be misclassified as be-
nign. Our approach acts as an input filtering system
that first perturbs the input samples to a trained model
at different magnitudes and uses the degree of change
in the logits of the perturbed samples as a signal to
detect if an input sample is watermarked.
We summarize the contributions of this paper be-
low:
• We develop a noise-based approach to discern
poisoned samples from concept drift samples and
clean samples even when the model is already poi-
soned.
• We show the generality of the approach by con-
sidering two different cyber settings, namely net-
work IDS and an Android malware detection sys-
tem; each with different input processing and fea-
turization pipelines.
• We show that existing approaches that focus only
on the detection of concept drift or the mitigation
of poisoning attacks are insufficient when both
concept drift and adversarial samples are present.
The rest of the paper is organized as follows: Sec-
tion 2 provides the necessary background and related
work on adversarial samples and concept drift. Sec-
tion 3 provides an overview of the proposed approach.
Section 4 provides the experiment results, and finally,
Section 5 presents the conclusions.
2 BACKGROUND AND RELATED
WORK
Deep Neural Networks (DNNs) are parameterized
functions which map some n-dimensional input into
an m-dimensional output. The DNN typically takes
the form of multiple non-linear functions stacked on
top of each other. By stacking these functions, known
as layers, a very complex relationship between the in-
put and output is established. The resulting DNN has
been shown to achieve exceptional accuracy on a va-
riety of tasks, including image recognition, machine
translation, and network intrusion detection.
While the large number of parameters within the
DNN help it achieve high accuracy on many tasks,
it also introduces some vulnerabilities to the model’s
integrity. The multitude of parameters allows for un-
expected or adversarial behavior to hide within the
model. A common adversarial attack against a DNN
is the poisoning attack. The particular poisoning at-
tack relevant to this paper is known as the backdoor
attack (Gu et al., 2017). In this type of attack, a model
is trained on data which includes both clean sam-
ples (normal training data with no malicious activity)
and poisoned samples (samples in which a trigger has
been inserted). This trigger is some set of features
that an attacker has placed into the poisoned samples.
When the attacker injects the poisoned samples into
the training data, they manipulate the labels of these
poisoned samples as well. The DNN should learn to
associate the trigger with the attacker’s intended la-
bel. Once the model is trained, it should achieve high
accuracy on clean samples but exhibit some attacker-
specified behavior on poisoned samples. This could
include generally low accuracy, or deliberate misclas-
sification to some targeted class.
An even stealthier backdoor attack, known as the
clean-label attack (Shafahi et al., 2018), follows a
similar pattern of inserting poisoned samples into the
training data. The key difference is that the labels are
unchanged by the attacker. This represents a more re-
alistic scenario in certain cases, such as when data is
crowdsourced from user submissions. Additionally,
mislabeled poisoned samples may be detected by the
victim if they were to run anomaly detection on the
training data prior to training. The correctly labeled
poisoned samples that comprise the clean-label attack
may be more likely to go undetected. The key to
the attack is that the model should learn to associate
the trigger with the class of data that it is inserted to.
Then, at test time, if a poisoned sample from another
class contains this same trigger, the model should
misclassify it based on the relationship it learned dur-
ing training.
The Jigsaw attack (Yang et al., 2023b) further ex-
tends the clean-label attack to make it even stealthier.
In this attack, a trigger is optimized to only work on
a specific subset of a particular class. By reducing
the cases in which a trigger is activated, the attack is
demonstrably more difficult to detect.
Because of the threat these attacks pose, there has
been much research conducted into poisoned sample
detection. These techniques make predictions at test-
time on whether a given sample contains some trigger
in relation to a potentially poisoned model. One such
method is DUBIOUS (Yudin and Izmailov, 2023).
DUBIOUS works by perturbing an input at different
magnitudes and collecting statistics on the model’s
decisions on those perturbed samples. The statistics,
referred to as a signature, are stored for known clean
samples. The signature of a novel sample is created
at test time, and outlier detection is run to determine
whether to reject the sample as poisoned or not.
Aside from poisoned sample detection, re-
searchers have also investigated concept drift detec-
tion. Prior works often follow a common framework.
SECRYPT 2024 - 21st International Conference on Security and Cryptography
142

They first employ a dissimilarity or distance metric to
measure how far a given sample is from the rest of
the available data, and then use statistical tests to de-
termine whether that sample is drifting or not. How-
ever, due to the nature of these techniques, adversar-
ial samples may also be treated as a concept drift.
Thus, adversarial samples may be considered as new
data and be included for re-training the model. If
an attacker begins introducing poisoned samples, the
model could be re-trained on the incoming poisoned
samples, resulting in a poisoned model. Alternatively,
if the model has already been poisoned, then even if
poisoned samples are not detected as drift, they could
trigger incorrect output from the model.
One such vulnerable concept drift detection ap-
proach is Drift Detection Method (DDM) (Gama
et al., 2004), where the error rate over a sliding win-
dow of incoming data is used at the determining
statistic. Another, Statistical Test of Equal Propor-
tions (STEPD) (Bu et al., 2016), similarly uses the
error rate in the most recent window by comparing
it to the overall window. ADWIN (Nishida and Ya-
mauchi, 2007) on the other hand automatically opti-
mizes the window sizes over the set of data. While
these approaches work well in the cases they were
tested on, they don’t address the risk posed by a mali-
cious actor presenting poisoned samples into the data.
Poisoned samples can be crafted to retain their origi-
nal classification and may not therefore be detectable
through error rate.
Besides techniques that rely on error rate, tech-
niques such as Statistical Change Detection for multi-
dimensional Data (SCD) (Song et al., 2007) and
Information-Theoretic Approach (Dasu et al., 2006)
measure the distance between the original data distri-
bution and the new data. However, these approaches
require multiple drifting samples in order to learn
their distribution for comparison to the original data.
If an attacker releases a small number of poisoned
samples among a set of typical drifting samples, the
poisoned samples may be masked by the samples
around it. This could result in them failing to be de-
tected, or making their way into the new training data
if the clean samples around it are drifting and trigger
re-training.
Yet another approach, CADE (Yang et al., 2021),
learns a distance metric via an autoencoder to mea-
sure dissimilarity among data points. If a novel sam-
ple is sufficiently far from all known class clusters,
it is regarded as drifting. As we will demonstrate in
our experiments, CADE fails to distinguish poisoned
samples from the rest of the samples as accurately as
our method.
While each of these techniques may detect con-
Figure 2: Conceptual illustration showing the difference be-
tween adversarial samples and concept drift samples.Top
part of the figure shows the original data distribution in ge-
ometrical input space and the bottom part show the variabil-
ity in logits. The dotted lines represent a distance metric.
cept drift samples, their authors did not consider that
some of the new samples being introduced may con-
tains triggers. This is explored in (Korycki, 2022)
where the authors develop adversarially robust drift
detectors via restricted Boltzmann machines. Their
approach targets adversarial attacks which cause in-
correct adaptation to concept drift, rather than the
backdoor attack we examine in this paper.
3 OVERVIEW OF THE
PROPOSED APPROACH
Our approach to this problem is inspired by related
observations on the nature of adversarial samples em-
ployed in evasion and poisoning attacks: depending
on the specific conditions, such samples exhibit larger
than usual variability in terms of ML model outputs
when exposed to appropriately applied modifications.
For instance, both evasion and poisoned adversarial
samples, when fed into multiple modified ML mod-
els, produce higher diversity of outputs than legiti-
mate data (Izmailov et al., 2021; Venkatesan et al.,
2021; Ho et al., 2022; Reddy et al., 2023). Similarly,
when only a single ML model is available, backdoor
adversarial samples with feature modifications pro-
duce a more diverse spectrum of logits than legitimate
data subject to the same modifications (Yudin and Iz-
mailov, 2023). Our approach thus targets creating an
actionable difference between concept drift and mali-
cious backdoor poisoned samples, both of which be-
ing outside of the original training distribution.
To illustrate the differences, Figure 2 shows the
distribution of the original training data (in the upper
part of the figure) along with two samples (malicious
Backdoor Attacks During Retraining of Machine Learning Models: A Mitigation Approach
143

and concept drift ones) and their modifications. While
both samples do not belong to the original training
distribution, modifications of adversarial samples ex-
hibit larger variability in terms of ML model logits
(shown in the lower part of the figure) since some of
the modifications interfere with the hidden backdoor
and thus, potentially flipping the classification out-
put. On the other hand, modifications of the concept
drift sample show reduced variability by being located
further from the decision boundary even though they
may be classified incorrectly by the ML model. In
this paper, we explore the possibility of adding noise
perturbations to an input sample in order to create
the modifications that would exhibit different levels
of variability for the two types of OOD data.
3.1 Methodology
One of the challenges in leveraging the above obser-
vation to differentiate between concept drift and ad-
versarial samples is determining the appropriate mag-
nitude of perturbation that we must introduce to an in-
put sample. If the magnitude of perturbation is small,
then it may not interfere with the hidden backdoor and
thus, adversarial samples may remain undetected. If
the magnitude is very large, it may completely disrupt
the influence of the backdoor and thus, will have a
high variability in the model’s output. However, if the
magnitude is very large, legitimate samples and con-
cept drift samples will also exhibit a large variability
in the model’s output thereby making it challenging
to discern clean/concept drift samples from adversar-
ial samples. Thus, identifying the optimal magnitude
for perturbations is crucial for effective detection of
adversarial samples.
In our approach, we first perturb a given sample
multiple times and at various magnitudes. These per-
turbations can be thought of as adding noise to the
original sample. We then run the set of perturbed
samples through the model and obtain the logit val-
ues corresponding to the malware class. We take the
mean at each noise magnitude level to learn how the
mean logit values change as the size of the perturba-
tions increases. We measure the change in absolute
percent change, starting from a magnitude level of 0
(i.e., no noise).
We expect poisoned samples to exhibit the great-
est change, since if the trigger (i.e., backdoor) is de-
graded by the addition of noise, the model should flip
its classification decision for the sample. We expect
samples belonging to the concept drift class to have
the second largest change, as the model is unfamiliar
with these types of samples, and so its decision should
be more easily changed by the addition of noise. Fi-
nally, we expect clean data similar to the training data
to be the most robust to noise, and therefore have the
lowest absolute percent change in mean logit value.
Algorithm 1 provides a detailed set of steps of the pro-
posed methodology.
Algorithm 1: Algorithm to compute absolute percent
change.
Input: A malware detector f that returns
logits, list of perturbation magnitudes
PM, perturbation function p, number
of perturbations to apply N
Output: The mean absolute percent change
in logit value for each perturbation
magnitude level AbsPercentChanges
Data: Data that may contain poisoned
samples as well as concept drift
samples X
for X
i
in X do
meanLogits ← []
for M in PM do
logitList ← []
for n = 1 : N do
X
′
i
← p(X
i
,M)
logits ← f (X
′
i
)
add logits[ j] to logitList where j
corresponds to the malware class index
end for
add mean(logitList) to meanLogits
end for
end for
AbsPercentChanges ← []
for mean in meanLogits do
APC ← abs((mean −
meanLogits[0])/meanLogits[0]) ∗ 100
add APC to AbsPercentChanges
end for
4 EXPERIMENT RESULTS
In this section, we first provide an overview of the ex-
perimental setting and then present the empirical re-
sults of the proposed methodology for two different
cyber settings.
4.1 Experiment Overview
For our experiments, we considered ML-based IDS
that classified a sample as benign or malicious i.e.,
a binary classifier. As mentioned above, we con-
sider the worst-case scenario for the defender where
the model is poisoned through an out-of-band mech-
anism. In particular, for our experiments, we evaluate
SECRYPT 2024 - 21st International Conference on Security and Cryptography
144

the proposed methodology against a state-of-the-art
clean-label poisoning attack that uses an explanation-
based method to create watermarks (also, referred to
as triggers) (Severi et al., 2021). In the considered
attack setting (i.e., clean-label attack), the trigger is
only inserted in benign samples and their labels are
unchanged. A model trained with the poisoned be-
nign samples associates the trigger with the benign la-
bel and subsequently, an attacker evades the poisoned
model by inserting the same trigger into a malicious
sample.
The explanation-based poisoning attack proposed
by Severi et al. (Severi et al., 2021) proposed three
types of strategies for generating a watermark. Each
strategy involves the selection of a feature subspace
in which the trigger will be embedded, and the selec-
tion of values within the identified feature subspace.
The first type of attack strategy is referred to as Min-
Population. In this attack, a model is poisoned by
selecting the most important features based on SHAP
values of the training samples, and then assigning val-
ues to those features that occur infrequently in the
dataset. The second type of attack strategy is re-
ferred to as CountAbsSHAP. This attack also selects
the most important features based on SHAP values
but selects values for those features that occur com-
monly in the dataset. Finally, the third attack – re-
ferred to as CombinedGreedy – selects features and
values using a greedy approach such that the finally
constructed trigger is realizable.
We evaluate these poisoned models in two differ-
ent cyber settings, namely a network IDS that detects
botnet command and control (C2) traffic and a mal-
ware Android APK detection system. For each set-
ting, we identify different families of benign and ma-
licious samples, and designate a subset of those fam-
ilies as hold-out sets during training. These held-out
samples represent concept drift and will be used as
part of the testing dataset for the poisoned models.
4.2 Botnet C2 Traffic
For the network traffic IDS setting, we considered
traffic samples from the USTC-TFC2016 dataset (Lu,
). Traffic in this dataset is either generated by benign
applications (Gmail, Facetime, Skype, and FTP), or
belongs to malicious botnet C2 traffic (HTBot, Shifu,
Tinba, and Geodo). In order to build the IDS, we con-
sidered models that operate directly on packets (in-
stead of featurization). In particular, we considered
CNN-based models proposed by Wang et al. (Wang
et al., 2017) where the raw packets in a traffic session
are converted into images by converting each byte of
the packet into a grayscale pixel and then clipping
Figure 3: Network traffic is converted to images prior to the
CNN performing inference on it.
and/or padding the image to 28 by 28 dimension. A
visualization of this pipeline is shown in Figure 3.
Our method relies on observing the output of a
poisoned model on various samples. All of the mod-
els we use in our experiments are ResNet-18 con-
volutional neural networks, trained to differentiate
whether an image was formed from benign or mali-
cious traffic. To represent concept drift, we exclude
traffic generated from a specific application from the
training set. This ensures that at test time, any sample
from this application will be considered novel by our
classifier. Each attack uses a poisoning rate of 5% i.e.,
only 5% of the benign training samples contained the
watermark. During poisoning, we specifically check
that triggers are only placed in portions of the sam-
ples corresponding to the network packet’s payload.
This ensures the realizability of the poisoned sample
as it retain the header information that is needed for
the poisoned traffic to be compliant with network pro-
tocol.
For each type of attack we trained four poisoned
models, holding out a different application for each
(Gmail, Skype, Shifu, and Tinba). We test all four
of these held-out sets to reduce the risk of misin-
terpreting any class-specific effect as concept drift.
Finally, we down-select models that achieve greater
than 75% attack success rate. Table 1 summarizes
the experiment settings, the trained model’s accuracy
on clean dataset and the corresponding attack success
rate. Here, trigger size refers to the number of bytes
in the payload that were considered for inserting the
watermark. For each of these models, the held-out
samples tend to be correctly classified.
To differentiate poisoned samples from unseen
samples (concept drift), we first perturb a given sam-
ple with noise at various magnitudes. Perturbations in
this case select the most important features based on
SHAP values and replace the corresponding values in
the input sample with those selected from a random
training sample belonging to the malware class. The
number of features selected for randomization is re-
ferred to as the perturbation magnitude. We then run
the perturbed samples through the model and obtain
Backdoor Attacks During Retraining of Machine Learning Models: A Mitigation Approach
145
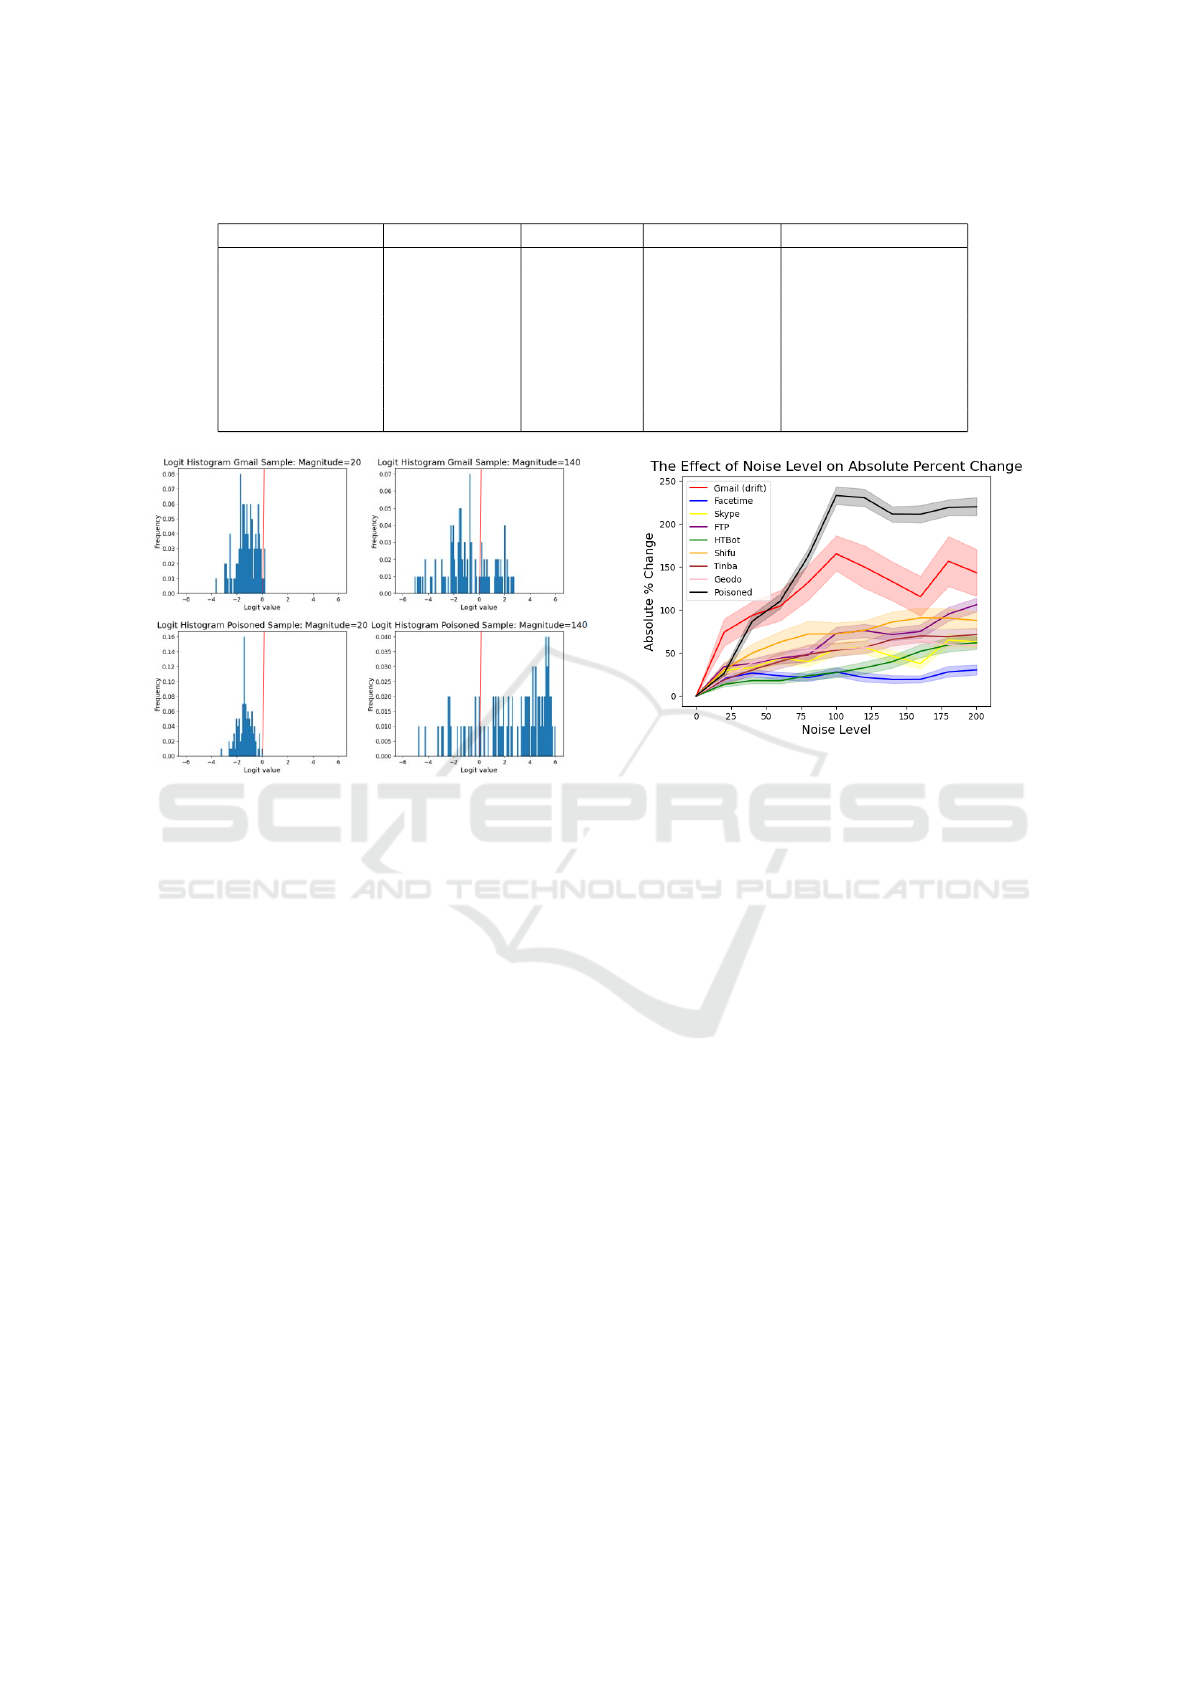
Table 1: Summary of the eight poisoned model settings that were used to evaluate the proposed methodology.
Attack Type Held-out Data Trigger Size Test Accuracy Attack Success Rate
MinPopulation Gmail 100 99.5% 77.4%
MinPopulation Skype 100 98.1% 80.0%
MinPopulation Shifu 100 98.9% 80.1%
MinPopulation Tinba 100 98.2% 79.1%
CountAbsSHAP Gmail 100 99.4% 77.6%
CountAbsSHAP Skype 100 99.4% 86.1%
CountAbsSHAP Tinba 100 97.2% 84.9%
CombinedGreedy Gmail 100 98.8% 79.7%
Figure 4: The distribution shifts of logit values over two
perturbation magnitudes for a novel clean sample (top) and
a poisoned sample (bottom). The distribution shifts are no-
ticeably different.
the logit value corresponding to the malware class.
The plots in Figure 4 show the effect of 100 perturba-
tions for two magnitudes (20 and 100) on an example
unseen benign sample (Gmail), and an example poi-
soned sample. As visualized in Figure 4, the distribu-
tion shift for a sample representing concept drift looks
noticeably different from that of a poisoned sample.
The concept drift samples mostly retain their classi-
fication for both magnitudes, while poisoned samples
have their classification flipped more often when the
higher perturbation magnitude is applied. This sug-
gests the perturbations are successfully removing the
effect of the trigger.
We exploit this change in classification decisions
to discriminate poisoned samples from samples be-
longing to concept drift, as well as from other clean
samples in the training data. We calculate the mean
logit values across 100 perturbations at various per-
turbation magnitudes ranging from 0 to 200, and then
calculate the absolute value of the percent change in
the logit value compared to the case when no noise
is added as described in Algorithm 1. Finally, we re-
peat for 50 samples. In Figure 5 we visually display
Figure 5: As noise increases, the absolute percent change in
logit values grows significantly higher for poisoned samples
than for samples belonging to the concept drift class or other
clean classes present in the training data.
these results for a model poisoned via the MinPopu-
lation attack with Gmail samples held out. The lines
represent the mean over the 50 samples while the cor-
responding shadow represents a 95% confidence in-
terval.
As shown in Figure 5, at a perturbation magni-
tude of 100, the absolute percent change of poisoned
samples is significantly greater than those from clean
and concept drift samples. Poisoned samples exhibit
an absolute percent change of about 225%, while the
concept drift samples (those belonging to the Gmail
class) change by about 150%. The other clean classes
change by between 25% to 75%. Furthermore, at
perturbation magnitudes greater than 100, the dif-
ference in the absolute percent change of poisoned
and clean/drifting samples continues to be statistically
significant, showcasing the strength of the proposed
approach.
While the distinction between the concept drift
class and the remaining classes is evident in Figure 5,
where Gmail samples were used as concept drift, the
distinction was not as apparent for several other tested
classes. In Figure 6, we treat Tinba samples as con-
cept drift instead, and therefore exclude them from
the training data. In this example we see that while
poisoned samples still exhibit significantly higher ab-
SECRYPT 2024 - 21st International Conference on Security and Cryptography
146
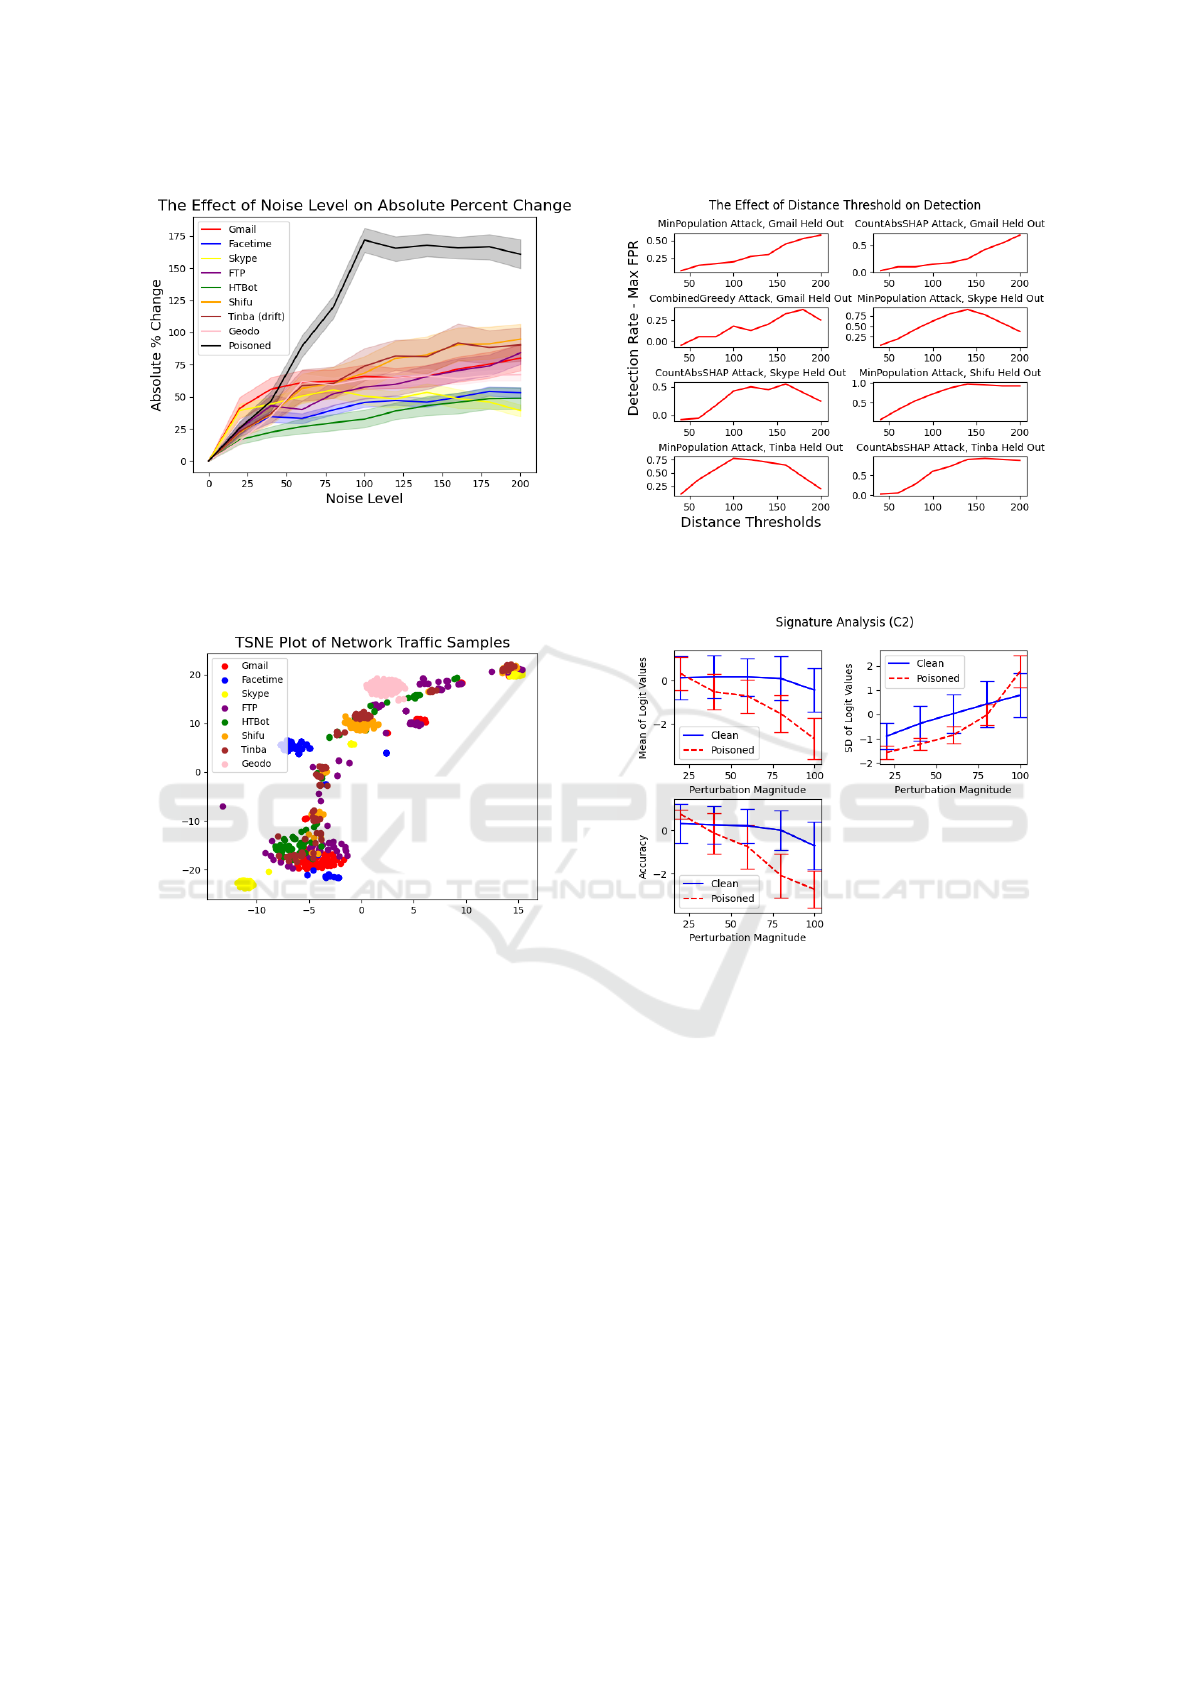
Figure 6: When we exclude Tinba samples from the training
data, poisoned samples are still easily distinguished from
clean samples by their absolute percent change in logit val-
ues at noise levels above 100, but the concept drift class is
not discernible from other clean classes.
Figure 7: Gmail samples mostly fall into a single cluster,
while Tinba samples are widely dispersed among the others.
solute percent change in logit value at higher noise
levels, there is no clear separation between concept
drift and in-distribution samples. We hypothesize that
this may be due to the class separability of our dataset.
The TSNE plot presented in Figure 7 shows that while
Gmail samples mostly fall into a single cluster, Tinba
samples are widely dispersed. The factors responsi-
ble for whether a concept drift class is more easily
detected from other classes is a direction we may pur-
sue in future research.
Our goal is to detect poisoned samples with high
accuracy while avoiding false positives. We define the
max false positive rate (MFPR) as the maximum false
positive rate taken over the set of clean classes. To
determine how effective our poison detection mech-
anism is, we use the metric of detection rate minus
MFPR. We plot this metric over various threshold val-
ues for each of the poisoned models we evaluated.
The results are shown in the plots in Figure 8. From
these plots we see the best performance is achieved
Figure 8: The maximum effectiveness of our approach, as
measured by detection rate minus MFPR, is achieved when
the distance threshold is about 140% to 160%.
Figure 9: The DUBIOUS ”signatures” appear visually dis-
tinct for clean and poisoned samples, in particular for the
accuracy and mean logit statistics.
when the distance threshold is about 140% to 160%.
We also evaluate a poisoned sample detection
algorithm called DUBIOUS (Yudin and Izmailov,
2023) on the botnet C2 traffic dataset. Running DU-
BIOUS on the poisoned samples from the C2 traffic
data yielded a 32% error rate. Most of the errors in-
volved incorrectly predicting that benign traffic was
poisoned. DUBIOUS was fairly efficient at rejecting
poisoned samples, detecting 96% of them. We visu-
ally demonstrate the signatures for clean and poisoned
samples in Figure 9. When we applied DUBIOUS to
held-out Gmail samples, representing concept drift,
DUBIOUS performed much worse. The result was
a 72% error rate and was about equally incorrect for
clean and poisoned data. Thus, DUBIOUS performed
poorly when presented with concept drift samples.
Backdoor Attacks During Retraining of Machine Learning Models: A Mitigation Approach
147

4.3 Android Malware
Detecting concept drift in the android malware de-
tection problem is crucial due to the dynamic na-
ture of the Android Platform and Android Applica-
tions. To keep up with evolving malware techniques
and updates to the Android ecosystem, malware de-
tection models need to be continuously updated to
provide meaningful predictions. We evaluate the pro-
posed method using the AndroZoo (Allix et al., 2016)
dataset. AndroZoo is a growing collection of over
24 million Android APKs collected from multiple
sources including the Google play market. For our
experiments, we used a date range from January 2015
and October 2016 to better compare our results with
prior work and to leverage malware family metadata
which more recent data lacks (Yang et al., 2023b;
Yang et al., 2021; Pendlebury et al., 2019). After this
process, our dataset consists of 152,188 samples. We
used VirusTotal’s flags to assign labels to the samples.
VirusTotal is a popular threat intelligence tool that ag-
gregates labels from many antivirus engines and is
provided by the AndroZoo dataset. We consider an
APK to be benign if there are no VirusTotal flags,
and malicious if there are at least four VirusTotal flags
raised. Finally, we use the feature extraction process
outlined in Drebin (Arp et al., 2014) and reduced the
dimensionality to 10,000 using feature importance.
To create our set of drifting points, we leverage the
Euphony tool (Hurier et al., 2017) provided by An-
droZoo to generate two datasets. The first excludes
all families that contain less than 10 samples from
the training data, and the second excludes all single-
ton malware classes. These samples form our con-
cept drift evaluation dataset and remain unseen dur-
ing training. All experiments were conducted using a
feed-forward neural network with three hidden layers.
Every model had greater than 99% accuracy on a held
out test set. However, these models do not general-
ize well to the drifting points that are out of distribu-
tion from the training data. Specifically, the models
were not significantly better than random guessing at
classifying drifting points. To poison the models, we
leverage SHAP based strategies to compute triggers
(Severi et al., 2021). We use a poison rate of 2% and
the attack success rate of each strategy is listed in Ta-
ble 2.
Our goal during test time is to identify backdoored
samples and concept drift samples. In contrast to
the network traffic experiment, the drifting samples
Android APK setting were exclusively malware and
so, we replaced an increasing magnitude of impor-
tant features with values from a randomly selected
benign sample. In particular, we considered pertur-
Figure 10: Effect of increasing noise level on absolute per-
cent change of logit values for Drebin data. Absolute per-
cent change trends significantly higher for poison and drift-
ing points compared to the validation set.
bation magnitudes ranging from 0 to 400. At each
magnitude, we perturbed samples 10,000 times and
calculated the absolute percent change of the logit val-
ues. By observing the absolute percent change in logit
values in Figure 10, we observed that the poisoned
points have the largest upward trend and the concept
drift points have the second largest upward trend.
CADE (Yang et al., 2021) is an existing method
designed to identify drifting points by training a con-
strastive autoencoder such that samples from different
families will be encoded far apart in the latent space.
The method then looks at distances of new samples to
the nearest family centroid to identify if a point may
be drifting.
We observe that this method fails to accurately dif-
ferentiate between poison and drifting points and es-
pecially struggles with the amount of small families
in the Drebin dataset. In Figure 11 we can see a visu-
alization of the latent space of the autoencoder. While
some of the top families have distinct clusters, many
of the smaller families have no real structure in the la-
tent space, and drifting points are distributed through-
out most of this space. This makes the identification
of these samples with a distance threshold in the latent
space difficult.
5 CONCLUSION
We present an approach to mitigate the effect of poi-
soned samples in the presence of drifting samples on
two distinct cyber settings by observing the effects of
input noise. We tested our method against the state-
of-the-art clean-label backdoor attacks and demon-
strated efficacy against drifting samples with different
SECRYPT 2024 - 21st International Conference on Security and Cryptography
148

Figure 11: Visualization of the latent space embedding
of drifting and poisoned points using CADE (Yang et al.,
2021). Drifting and Poisoned samples are distributed
through the entire latent space suggesting that distance met-
ric based detection schemes will not be able to accurately
classify samples.
Table 2: The four poisoned models we evaluated our tech-
nique against. Each model was poisoned with a trigger size
of 30 at a 2% poisoning rate, and the held out data consisted
of either any sample from a malware family with less than
or equal to 10 samples, or 1 sample (singleton).
Attack Type Held-out Test ASR
Data Accuracy
MinPopulation ≤ 10 98.38% 69.38%
MinPopulation Singleton 99.98% 59.31%
CountAbsSHAP ≤ 10 99.09% 67.16%
CountAbsSHAP Singleton 99.99% 73.25%
characteristics. Observing the distinct shift in logit
distributions at various magnitudes of noise allow us
to identify which samples are likely backdoored or
drifting.
In the network traffic modality, we were able to
correctly identify poisoned and drifting samples from
held out classes. Extending the approach to the An-
droid modality using the AndroZoo dataset, we show
that the approach is generalizable to new datasets and
can identify drifting samples from malware classes.
The deployment of neural network models in real-
world dynamic systems must take into account the
threat of a potential adversary while maintaining per-
formance on an ever-changing distribution of sam-
ples, and our approach provides an effective method
to differentiate between these two types of samples.
REFERENCES
Abaid, Z., Kaafar, M. A., and Jha, S. (2017). Quantifying
the impact of adversarial evasion attacks on machine
learning based android malware classifiers. In 2017
IEEE 16th international symposium on network com-
puting and applications (NCA), pages 1–10. IEEE.
Allix, K., Bissyand
´
e, T. F., Klein, J., and Le Traon, Y.
(2016). Androzoo: Collecting millions of android
apps for the research community. In Proceedings of
the 13th International Conference on Mining Software
Repositories, MSR ’16, pages 468–471, New York,
NY, USA. ACM.
Arp, D., Spreitzenbarth, M., Hubner, M., Gascon, H., and
Rieck, K. (2014). Drebin: Effective and explainable
detection of android malware in your pocket. In Net-
work and Distributed System Security Symposium.
Bu, L., Alippi, C., and Zhao, D. (2016). A pdf-free change
detection test based on density difference estimation.
IEEE Trans. Neural Networks Learn. Syst., PP(99):1–
11.
Carlini, N. and Wagner, D. (2017). Towards evaluating the
robustness of neural networks. In 2017 ieee sympo-
sium on security and privacy (sp), pages 39–57. IEEE.
Corona, I., Giacinto, G., and Roli, F. (2013). Adversar-
ial attacks against intrusion detection systems: Taxon-
omy, solutions and open issues. Information Sciences,
239:201–225.
Dasu, T., Krishnan, S., Venkatasubramanian, S., and Yi,
K. (2006). An information-theoretic approach to de-
tecting changes in multi-dimensional data streams. In
Proc. Symposium on the Interface of Statistics, Com-
puting Science, and Applications (Interface).
Gama, J., Medas, P., Castillo, G., and Rodrigues, P. (2004).
Learning with drift detection. In Proc. 17th Brazilian
Symp. Artificial Intelligence, pages 286–295.
Gu, T., Dolan-Gavitt, B., and Garg, S. (2017). Bad-
nets: Identifying vulnerabilities in the machine
learning model supply chain. arXiv preprint
arXiv:1708.06733.
Ho, S., Reddy, A., Venkatesan, S., Izmailov, R., Chadha,
R., and Oprea, A. (2022). Data sanitization approach
to mitigate clean-label attacks against malware detec-
tion systems. In MILCOM 2022 - 2022 IEEE Military
Communications Conference (MILCOM), pages 993–
998.
Hurier, M., Suarez-Tangil, G., Dash, S. K., Bissyand
´
e, T. F.,
Traon, Y. L., Klein, J., and Cavallaro, L. (2017). Eu-
phony: harmonious unification of cacophonous anti-
virus vendor labels for android malware. In Proceed-
ings of the 14th International Conference on Mining
Software Repositories, pages 425–435. IEEE Press.
Izmailov, R., Lin, P., Venkatesan, S., and Sugrim, S. (2021).
Combinatorial boosting of classifiers for moving tar-
get defense against adversarial evasion attacks. In
Proceedings of the 8th ACM Workshop on Moving
Target Defense, pages 13–21.
Korycki, L. (2022). Adversarial concept drift detection un-
der poisoning attacks for robust data stream mining.
Machine Learning, 112:4013–4048.
Lu, D. Traffic dataset USTC-TFC2016.
Nishida, K. and Yamauchi, K. (2007). Detecting concept
drift using statistical testing. In Corruble, V., Takeda,
M., and Suzuki, E., editors, Proc. 10th Int. Conf. Dis-
covery Science, pages 264–269. Springer Berlin Hei-
delberg.
Pendlebury, F., Pierazzi, F., Jordaney, R., Kinder, J., and
Cavallaro, L. (2019). TESSERACT: Eliminating ex-
Backdoor Attacks During Retraining of Machine Learning Models: A Mitigation Approach
149

perimental bias in malware classification across space
and time. In 28th USENIX Security Symposium
(USENIX Security 19), pages 729–746, Santa Clara,
CA. USENIX Association.
Reddy, A., Venkatesan, S., Izmailov, R., and Oprea, A.
(2023). An improved nested training approach to miti-
gate clean-label attacks against malware classifiers. In
MILCOM 2023-2023 IEEE Military Communications
Conference (MILCOM), pages 703–709. IEEE.
Severi, G. et al. (2021). Explanation-Guided backdoor poi-
soning attacks against malware classifiers. In 30th
USENIX security symposium (USENIX security 21).
Shafahi, A., Huang, W. R., Najibi, M., Suciu, O., Studer,
C., Dumitras, T., and Goldstein, T. (2018). Poison
frogs! targeted clean-label poisoning attacks on neural
networks. Advances in neural information processing
systems, 31.
Siva Kumar, R. S., Nystr
¨
om, M., Lambert, J., Marshall, A.,
Goertzel, M., Comissoneru, A., Swann, M., and Xia,
S. (2020). Adversarial machine learning-industry per-
spectives. In 2020 IEEE Security and Privacy Work-
shops (SPW), pages 69–75.
Song, X., Wu, M., Jermaine, C., and Ranka, S. (2007). Sta-
tistical change detection for multi-dimensional data.
In Proc. 13th ACM SIGKDD Int. Conf. Knowledge
Discovery and Data Mining, pages 667–676.
Szegedy, C., Zaremba, W., Sutskever, I., Bruna, J., Erhan,
D., Goodfellow, I., and Fergus, R. (2014). Intriguing
properties of neural networks. In International Con-
ference on Learning Representations.
Venkatesan, S., Sikka, H., Izmailov, R., Chadha, R., Oprea,
A., and De Lucia, M. J. (2021). Poisoning attacks
and data sanitization mitigations for machine learn-
ing models in network intrusion detection systems. In
MILCOM 2021-2021 IEEE Military Communications
Conference (MILCOM), pages 874–879. IEEE.
Wang, W. et al. (2017). Malware traffic classification using
convolutional neural network for representation learn-
ing. In 2017 International conference on information
networking (ICOIN).
Yang, L., Chen, Z., Cortellazzi, J., Pendlebury, F., Tu, K.,
Pierazzi, F., Cavallaro, L., and Wang, G. (2023a). Jig-
saw puzzle: Selective backdoor attack to subvert mal-
ware classifiers. In 2023 IEEE Symposium on Security
and Privacy (SP), pages 719–736. IEEE.
Yang, L. et al. (2023b). Jigsaw puzzle: Selective backdoor
attack to subvert malware classifiers. In 2023 IEEE
Symposium on Security and Privacy (SP).
Yang, L., Guo, W., Hao, Q., Ciptadi, A., Ahmadzadehand,
A., Xing, X., and Wang, G. (2021). Cade: Detect-
ing and explaining concept drift samples for security
applications. In Proc. of the USENIX Security Sympo-
sium.
Yudin, M. and Izmailov, R. (2023). Dubious: Detecting
unknown backdoored input by observing unusual sig-
natures. In MILCOM 2023-2023 IEEE Military Com-
munications Conference (MILCOM), pages 696–702.
IEEE.
SECRYPT 2024 - 21st International Conference on Security and Cryptography
150
