
A Cascade of Consequences: Improving an Accident Analysis Method by
Learning from a Real Life Telecommunications Accident
Hans C. A. Wienen
1
, Faiza A. Bukhsh
1
, Eelco Vriezekolk
2
and Luís Ferreira Pires
1
1
Faculty of Electrical Engineering, Mathematics and Computer Science, University of Twente, Netherlands
2
Dutch Authority for Digital Infrastructure, Netherlands
Keywords:
Telecommunications, Accident Analysis, Incident Analysis.
Abstract:
Telecommunications networks are vital enablers of modern society. Large accidents in these networks that
cause their unavailability can therefore have a severe impact on the functioning of society. Learning from
these accidents can help prevent them and thus make our society more resilient. In this paper, we present
an accident analysis method (TRAM) which we have developed by extending the AcciMap method and we
report on its application to analyse a severe accident in a telecommunications network. We validate notation
for representing and breaking positive feedback loops in a network breakdown, and we suggest a method to
enhance the prioritisation of recommendations derived from our analysis. Furthermore, our research reveals
that splitting the analysis based on the expertise of the method’s participants negatively impacts the efficiency
of the overall process.
1 INTRODUCTION
Telecommunications networks constitute one of the
critical infrastructures that make society work. Much
attention is therefore paid to the stability and re-
silience of these networks. When accidents
1
do oc-
cur, accident analysis yields insights that can help pre-
vent future accidents and improve the stability and re-
silience of telecommunications networks.
Our research aims to improve existing accident
analysis methods in the telecommunications sector. In
our previous case studies, we designed and validated
an accident analysis method called TRAM, which en-
ables the modelling and analysis of the distinctive fea-
tures associated with incidents in telecommunications
and cyberattacks (Wienen et al., 2019; Wienen et al.,
2024). Our investigation is carried out in real-world
corporate settings, characterized by time constraints
and limited collaboration opportunities in which these
companies operate. This precludes us from con-
ducting controlled experiments. Instead we apply
TAR (Technical Action Research) (Wieringa, 2014)
to identify new issues during the tests and validation
of our accident analysis method. We put our method
1
In the telecommunications domain, accidents are of-
ten referred to as ‘incidents’ . This paper will consistently
use the term ‘accident’ to align with the terminology in the
accident analysis field.
to the test in an uncontrolled environment, and as the
tests progress, the method is adapted to handle un-
expected issues encountered during those tests, hence
yielding an improved version of the method.
As outlined in our previous case study (Wienen
et al., 2024), we concluded that the current version
of TRAM lacks the ability to model positive feedback
loops, while these types of loops can play a crucial
role in telecommunications accidents. We also ob-
served that the number of recommendations for im-
provement TRAM yielded was large. Prioritising rec-
ommendations for implementation is not trivial, yet
TRAM originally did not give guidelines on how to
make these choices.
TRAM prescribes that subject matter experts
should discuss causes and consequences that lead to
the accident being analysed. We have seen in pre-
vious research (Wienen et al., 2019; Wienen et al.,
2024) that splitting the group according to different
phases in the accident can increase the efficiency of
the method, but we wanted to investigate if splitting
the group according to expertise yields a further in-
crease in efficiency. Together with a large telecom-
munications operator we performed a case study in
which we could analyse a large incident in a telecom-
munications network that led to the large scale un-
availability of telecommunications services in a West-
ern European country. In the analysis of this acci-
62
Wienen, H., Bukhsh, F., Vriezekolk, E. and Ferreira Pires, L.
A Cascade of Consequences: Improving an Accident Analysis Method by Learning from a Real Life Telecommunications Accident.
DOI: 10.5220/0012762800003756
Paper published under CC license (CC BY-NC-ND 4.0)
In Proceedings of the 13th International Conference on Data Science, Technology and Applications (DATA 2024), pages 62-70
ISBN: 978-989-758-707-8; ISSN: 2184-285X
Proceedings Copyright © 2024 by SCITEPRESS – Science and Technology Publications, Lda.

dent, we investigate these three questions (notation
for a feedback loop, prioritising recommendations
and splitting the group according to expertise).
This article makes the following contributions:
(i) it validates the new notation we introduced in
(Wienen et al., 2024); (ii) it suggests ways to priori-
tise the implementation of recommendations resulting
from TRAM; and (iii) it discusses the impact of split-
ting the analysis over two groups of experts according
to expertise.
The paper is further structured as follows: Sec-
tion 2 discusses accident analysis methods; Section 3
describes the TRAM method; Section 4 describes the
accident that we used to improve and validate TRAM.
Section 5 presents the results of the application of
TRAM to this accident and Section 6 discusses these
results. Section 7 concludes this paper.
2 ACCIDENT ANALYSIS
METHODS
Three different families of accident analysis methods
can be identified in the literature (Hollnagel, 2002;
Hollnagel and Goteman, 2004; Wienen et al., 2018):
Sequential Methods. Methods that represent an ac-
cident as the outcome of a sequence of events.
Epidemiological Methods. Methods that represent
an accident as the outcome of a sequence of events
that could take place in an environment in which
the measures that should have inhibited the se-
quence to result in an accident were malfunction-
ing or missing. They take the socio-technical
context into consideration, also discussing aspects
such as company culture, risk management, bud-
geting choices and safety regulations.
Systemic Methods. Methods that not only take the
socio-technical context into account, but try to
model the system in which the accident has devel-
oped, thus also looking at the tight links between
parts of the system, positive and negative feed-
back loops and discrepancies between the men-
tal model based on which operators take decisions
and the physical reality that they are influencing.
Some methods do not fall into one of the three afore-
mentioned families; these methods are mostly ad hoc
and the subject of very limited research (Wienen et al.,
2018).
The development of the three families is chrono-
logical. The sequential methods were developed
first. The Fault Tree Analysis method (Vesely et al.,
1981) is an example of such a method. Starting in
the 1990s, the relevance of the socio-technical con-
text became apparent, and the first epidemiological
methods were developed (Reason, 1990; Rasmussen,
1997). Finally, in the 2000s, system-theoretical as-
pects were introduced, resulting in the development
of systemic methods, such as STAMP (Leveson, 2004)
and FRAM (Hollnagel and Goteman, 2004). This evo-
lution was triggered by new accidents that could not
satisfactorily be analysed by the existing methods.
The relevance of the socio-technical context became
evident after, amongst others, the Bhopal disaster, the
Challenger explosion and the Chernobyl nuclear dis-
aster (Reason, 1990). The development of the sys-
temic methods started as software took a more promi-
nent role in both the design and the running of sys-
tems, thereby creating new vectors for disaster (Leve-
son, 2004).
In our research, we started with the most cited epi-
demiological method, namely AcciMap (Rasmussen,
1997; Branford et al., 2009), rather than a systemic
method. Systemic methods take more effort as they
typically include a data gathering and analysis phase
to model the context of the accident (Salmon et al.,
2012). This phase is too expensive, since it involves
an analysis of the organisation (including training
programs and company regulations), government pol-
icy and regulations, and regulatory bodies (Salmon
et al., 2012) which costs a considerable amount of ef-
fort. Systemic methods are therefore not appropriate
for most commercial companies.
When we performed our first case study with
AcciMap for an accident in telecommunications (a
DDOS-attack on a Western European telecommunica-
tions provider) (Wienen et al., 2019) we observed that
ICT aspects were given too little attention in the Ac-
ciMap methods described in literature. These aspects
form a critical part of any telecommunications opera-
tor and of the technology that also enables malicious
actions, such as cyberattacks. We introduced the ICT
layer to better analyse these aspects and we also de-
vised several ways to improve the efficiency of the
method. These changes gave rise to the Telecommu-
nications related AcciMap (TRAM) method.
3 TRAM
TRAM is an extension of the Generic AcciMap Method
by Branford (Branford et al., 2009), which is a way
to apply AcciMap and to make it practically useful.
In its essence, the Generic AcciMap Method maps a
graph of causes and consequences to a set of layers
that represent the organisation in which the accident
occurred, the external world, the physical world in
A Cascade of Consequences: Improving an Accident Analysis Method by Learning from a Real Life Telecommunications Accident
63

outdated
design
principles
ddos attack
misconfigured
firewall
unavailable
services
untrained staff
market
pressure
lower prices
insufficient
funds
External
Organisation
ICT
Physical / Actor
Outcomes
T
Figure 1: A constructed example of a TRAM diagram.
which actors perform actions and a layer that contains
the outcomes.
3.1 Method Overview
Figure 1 shows an example of a TRAM diagram. Our
additions to the Generic AcciMap Method are indi-
cated by T
l
in the figure and in the text that follows.
To apply TRAM, we organise workshops with sub-
ject matter experts from the organisation in which the
accident occurred. We then analyse the accident ac-
cording to the following steps:
1. Prepare the Analysis Workshop. Study avail-
able documentation to prepare the analysis
workshops and to draw up a list of participants.
2. T
l
Identify the Physical Path. Identify the tech-
nical failures that caused the accident and draw a
diagram representing these technical failures. In
this way, a common picture is formed among the
participants in neutral terms, helping avoid the
‘blame game’.
3. T
l
Split the Accident and the Group. The acci-
dent can sometimes be split into two distinct
phases, such as e.g. a short-lasting power outage
and a subsequent longer service outage, or the on-
set of the actual accident and the resolution of the
crisis situation caused by the accident. If this is the
case, split the group so that each phase of the acci-
dent is analysed by the staff involved in that phase.
4. Identify the Outcomes. Identify the conse-
quences of the accident. These may be detrimen-
tal, but also beneficial, such as using the crisis to
implement long-delayed improvements.
5. Identify the Causal Factors. Identify all causal
factors (these are the nodes in the causal chain of
events or the boxes in the diagram). In this step,
it is pertinent that the group does not limit itself to
actual events, but also takes into account measures
that were supposed to stop the development of the
accident or mitigate consequences, but failed.
6. T
l
Identify the Appropriate Layer. A TRAM di-
agram is layered, containing layers for External,
Organisational, ICT and Physical/Actor causal fac-
tors. Each causal factor is plotted in a layer.
7. T
l
Bring the Groups and the Diagrams To-
gether. If the group has been split in step 3, the
groups are now recombined, review each other’s
diagrams and combine the diagrams.
8. Fill Gaps and Check Logic. In this step, the
group walks through the whole causal chain, iden-
tifying missing causal factors and faulty links, fi-
nalising the diagram.
9. Formulate Recommendations. For each causal
factor, the group discusses how to prevent those
factors from happening, how to control them if they
are happening and how to compensate or mitigate
the consequences once the factor has happened.
These recommendations must be formulated in ac-
tionable form as they are the harvest of the analy-
sis.
When creating TRAM, we added steps and layers as
indicated above. We also defined additional nota-
tion to indicate positive feedback loops and heuris-
tics to discuss Crisis Management after the acci-
dent occurred. This resulted in a 25% more effi-
cient approach by splitting the group and avoiding
discussions about blame, as well as a more effective
approach by clearly indicating ICT aspects and by
adding Crisis Management to the analysis (Wienen
et al., 2024).
3.2 Positive Feedback Loops
TRAM diagrams are cause-and-effect diagrams, so
that in essence they are directional non-circular
graphs. In (Wienen et al., 2024) a positive feedback
loop was instrumental in causing the accident. Ade-
quately representing these loops in a strict cause-and-
effect diagram is hard, because it either requires a
repetitive string of actions, or the positive feedback
loop must be modelled as a single event. However,
in the latter case, the parts that make up the loop and
the way to break it are not represented. This is why
we introduced new notation to represent these loops.
We relaxed the non-circularity requirement, enabling
us to draw the feedback loop with adequate details to
show where the loop could be interrupted. The nota-
tion consists of a valve symbol (▷◁) to indicate where
DATA 2024 - 13th International Conference on Data Science, Technology and Applications
64

the loop was interrupted and which action interrupted
the loop. Figure 2 shows an example of this nota-
tion. This is the actual feedback loop that appeared in
our case study. The numbers in the boxes refer to the
numbers in Figure 3. The feedback loop is indicated
by the dashed red box; the action to break the feed-
back loop is indicated by the square with the arrow
pointing at the middle of the ▷◁ symbol, while the ▷◁
symbol itself indicates the link that is cut to break the
loop.
signalling storm
as signalling
volume
grows(#38)
4G subscribers
cannot attach to
network (#40)
phones keep
trying to
reconnect to 4G
service (#35)
block access to
network for all
phones
massive switch
to 2G and 3G
(#34)
complete stop of
HSS (#37)
Figure 2: Application of the notation we introduced
in (Wienen et al., 2024) to the feedback loop that was in-
strumental in the accident in this case study.
3.3 Prioritising Recommendations
Previous applications of the method (Wienen et al.,
2019; Wienen et al., 2024) yielded many recommen-
dations (136 recommendations in Case Study 1 and
63 recommendations in Case Study 2). Choosing
which recommendations to implement and in what or-
der is not trivial. For this reason, we wanted to inves-
tigate in the current case study if we could prioritise
the recommendations according to two methods: (i) a
cost-benefit analysis in which we use a scale from 1
to 5 on both axes and (ii) a maturity model.
Many maturity models are described in the litera-
ture (Smit, 2005; Mahal, 2008; Junttila, 2014; Reis
et al., 2017; Malone et al., 2020) and some mod-
els even describe how to build maturity models, such
as (Maier et al., 2012). (Junttila, 2014) identifies
six different maturity model development processes,
while(Malone et al., 2020) describes 21 different ma-
turity models for 6 different domains, such as Busi-
ness Intelligence, Human Resources and Software
Development / Technology. Maturity models typi-
cally have two dimensions (Lacerda and von Wangen-
heim, 2018): (i) one dimension that describes process
areas, capabilities or characteristics of the domain,
and (ii) one dimension that describes the maturity the
organisation has achieved in one of the process areas
or capabilities in the first dimension.
We chose to use discrete levels for the maturity
dimension instead of a continuous scale so that the
participants in the case study can more easily order
the different recommendations. The majority of the
maturity models in (Malone et al., 2020) (13 out of
21) and in (Lacerda and von Wangenheim, 2018) (8
out of 11) use 5 levels of maturity, so we also used 5
levels. By giving descriptions to the different levels,
the participants have heuristics to assign recommen-
dations to a level.
We took the description of the levels from a study
by (Lacerda and von Wangenheim, 2018). In this
study, the authors identify eleven models, of which
four use the same scales, while the other seven use
scales that are all distinct. Three models in (Malone
et al., 2020) use the same scales as the four in (Lac-
erda and von Wangenheim, 2018). These are all ma-
turity models in the Software Development / Technol-
ogy domain. All other maturity models in (Malone
et al., 2020) use distinct names for the levels. The
common scales are shown in Table 1; we adapted the
descriptions to make them more generic.
Table 1: Common scale in Maturity Models, adapted from
(Lacerda and von Wangenheim, 2018).
Stage Description
1 – Initial No processes exist; work is
done according to the individ-
ual’s own preferences and ap-
proaches differ between applica-
tions
2 – Repeatable Work is done according to a re-
peatable approach which exists
in the employee’s mind
3 – Defined Work is done according to a doc-
umented procedure
4 – Managed Work is done according to a doc-
umented procedure and the pro-
cedure is evaluated and adapted
on a frequent basis to improve
efficiency and adaptability to
changes in the environment of
the work
5 – Optimising Data is gathered and used to im-
prove the efficiency and effec-
tiveness of the procedures
To reduce the complexity of prioritising the rec-
ommendations even further, we decided to cluster the
recommendations and only prioritise the recommen-
dations inside a cluster. To this end, we planned to let
the researchers and the staff from the telecommunica-
tions operator cluster recommendations according to
their business function. We named the resulting clus-
ters according to the business function and we named
these functions capabilities, Our intention was for the
A Cascade of Consequences: Improving an Accident Analysis Method by Learning from a Real Life Telecommunications Accident
65

subject matter experts to prioritise the different rec-
ommendations, taking into account that some recom-
mendations require that other recommendations are
implemented first. The subject matter experts would
then map all recommendations on the maturity scale
in Table 1, and that would define the priority of each
recommendation.
3.4 Review of the Diagrams
Drawing up the diagram is a lot of work: in our
previous case studies (Wienen et al., 2019; Wienen
et al., 2024), it took 2 or 3 workshops to complete
all 9 steps. We observed that efficiency is improved
by documenting the diagrams using a drawing tool
(draw.io) and sending digital copies out for review
between the different workshops. This enhancement
improves quality by introducing an additional online
review round, while also boosting efficiency by al-
lowing remarks to be processed offline. This, in turn,
avoids consuming valuable time from the subject mat-
ter experts.
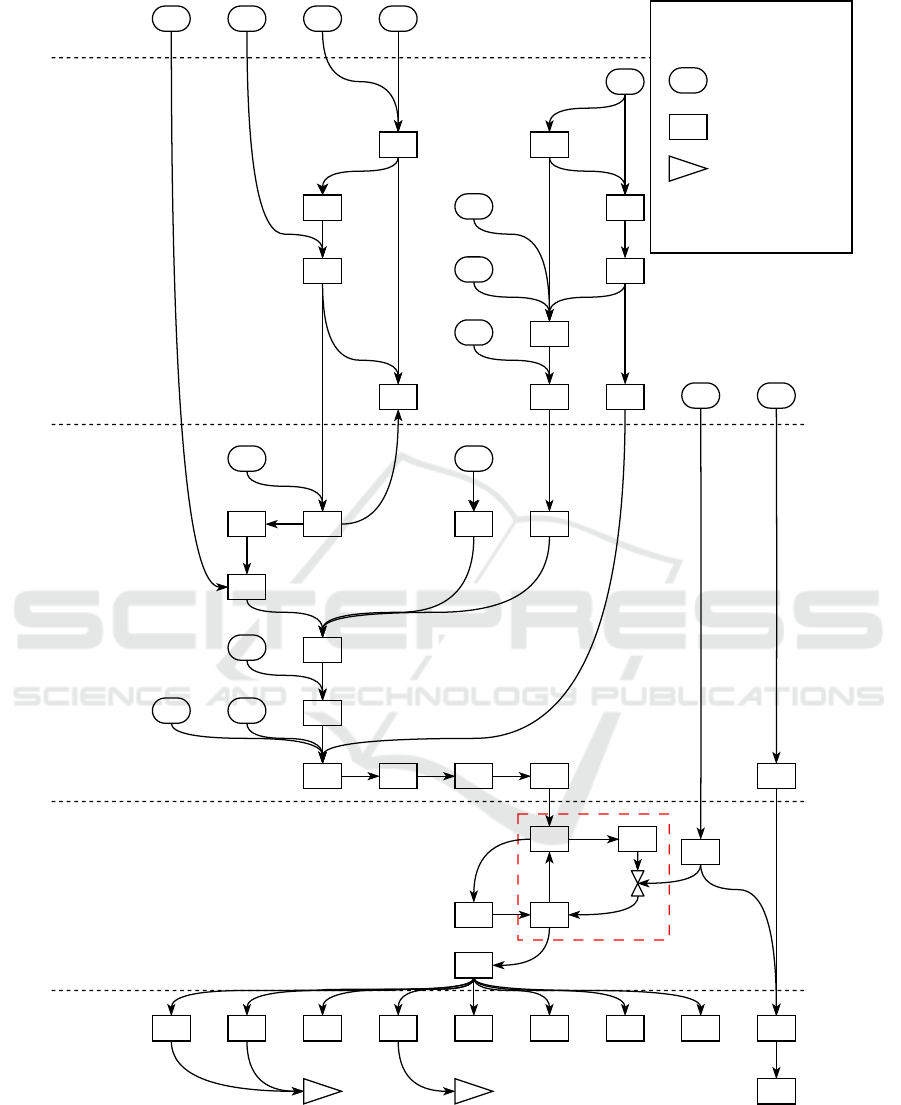
4 ACCIDENT
Due to the sensitive nature of the accident, we use
the pseudonym Gamma for the name of the com-
pany. Furthermore, some details have been left out
as they may reveal their identity. This is also the rea-
son why we use numbers instead of descriptive text in
the boxes in Figure 3.
4.1 Cause: Congestion
Sometime in 2018, Gamma virtualised a key com-
ponent of their network (an STP, or Signal Transfer
Point which is a routing device used to set up phone
calls). This device had been operational for a while
until Gamma needed to roll out a change in the de-
vice’s configuration. In preparation for this change,
Gamma created a snapshot (a backup) of the virtual
STP, so that a rollback could be executed in case any-
thing went wrong after the change.
During the creation of this snapshot, the virtual
STP became unresponsive for a few seconds. Dur-
ing this time, another network element (the HSS, or
Home Subscriber Server, which is the database that
contains information about subscribers and the ser-
vices they use) sent traffic to the STP that the STP
could not acknowledge. This caused a buffer over-
run in the HSS, resulting in a complete stop of the
HSS. Due to this stop, subscribers could no longer
access the network’s 4G service. Their devices then
switched to 2G and 3G all at the same time, while si-
multaneously trying to reach the 4G service, resulting
in a signalling storm that subsequently overloaded the
HSS and caused a complete loss of service.
Gamma resolved the issue by blocking access to
the network for all phones and then restarting the
HSS. By controlled release of the phones in small
batches, service could be restored. Figure 3 shows the
TRAM diagram of the accident. It includes the positive
feedback loop (# 40 – # 35 – # 38 – # 40) that caused
the congestion which resulted in the network break-
down (# 41). The triangles with A and B are connec-
tions to the diagrams that represent the consequences.
These diagrams are not included in this paper.
4.2 Consequence: Crisis
Gamma was not prepared for this crisis, since for bud-
getary reasons they had no centralised crisis commu-
nication organisation and no adequate tooling. Fur-
thermore, the Gamma staff only had Gamma sub-
scriptions for their phone, basically rendering the
whole organisation unable to communicate internally
during the first period of the crisis. The only available
channel for communication was a WhatsApp group,
severely hindering adequate communication during
the crisis.
Since company Gamma is the telecommunica-
tions service provider for the government and for
the hospitals of their country, communications within
the government broke down, and hospitals could no
longer be reached. The Ministry of Economic Affairs,
which was aware of the crisis before the company’s li-
aison was, held them to account. This led to further
reputation damage.
5 RESULTS OF THE ACCIDENT
ANALYSIS
We analysed the accident with TRAM in four work-
shops, namely two with technical staff and two with
communications staff, uncovering 91 causal factors,
leading to 65 outcomes. In the workshops, 265 rec-
ommendations the company could implement were
identified.
5.1 Feedback Loop
As shown in Figure 3, a feedback loop was instrumen-
tal in the breakdown of the network. Breaking that
loop enabled the company to restore service. Using
the notation we introduced in the previous case study
DATA 2024 - 13th International Conference on Data Science, Technology and Applications
66
External
Organisation
ICT
Physical / Actor
Outcomes
1 2 3 4
5
6 7
8
10
12
14
15
17
18
19 21
23
24 25
26
28
32
33
34
35
36 37
38
39
40
41
42
43
44 45 46 47 48 49 50 51 52
53A B
30
27
209
2922
16
13
11
31
Legend
x
y
start event - not
further analysed
event with
analysed cause
B
link to another
part of the
diagram (not
shown in this
paper)
Figure 3: TRAM diagram of the technical part of the accident.
(Wienen et al., 2024), we were able to model both the
feedback loop itself and the interruption of the feed-
back loop. The level of detail yielded recommenda-
tions for both the prevention and the interruption of
the feedback loop, thus validating and justifying the
notation.
A Cascade of Consequences: Improving an Accident Analysis Method by Learning from a Real Life Telecommunications Accident
67

5.2 Prioritisation by Maturity Level
After formulating the recommendations with the par-
ticipants of the workshops, we had a follow-up work-
shop with the company’s business continuity man-
agers. In this workshop, we clustered the recommen-
dations, as shown in Table 2.
Table 2: Clusters of recommendations.
Cluster description # recommen-
dations
Manage Communications 107
Manage Crisis 81
Manage Growth and Maturity 16
Manage Problem 10
Manage Reporting 1
Manage Resilience 44
Manage Resolution of Situation 6
We then asked the business continuity managers to
share the clustered recommendations with the partici-
pants in the workshops and ask them to order the rec-
ommendations according to dependence (which rec-
ommendations could be implemented right away, and
which were dependent on other recommendations that
needed to be implemented first) and according to ur-
gency (which recommendations needed to be imple-
mented as soon as possible and which could wait).
This information, together with the recommendation
itself, would enable us to plot them on the scale shown
in Table 1.
Unfortunately, the business continuity managers
were not able to incite the participants into complet-
ing this task, which prevented us from achieving these
specific results. For the same reason, we were not
able to formulate costs and benefits either. This il-
lustrates one of the difficulties frequently encountered
when applying TAR.
A way to circumvent this unresponsiveness of the
participants after the workshops are done is to en-
sure that the analysis has a sponsor at senior manage-
ment level. The results are aimed at improving the re-
silience of the company, thereby helping assure busi-
ness continuity. This is a responsibility of the board
and therefore senior management sponsorship can be
justified. Senior management can compel employees
to cooperate, while the business continuity managers
can only ask.
5.3 Splitting the Group According to
Expertise
The workshops started during the COVID-19 pan-
demic, when gatherings were prohibited, so we per-
formed our workshops online, using Microsoft Teams
and Excel to run the workshop. This had an impact on
efficiency, and the way the workshops were run was
not comparable to the previous workshops we con-
ducted, in which people gathered in a room around a
brown paper wall. This makes it impossible to draw
conclusions about efficiency with respect to splitting
the groups according to expertise.
We did notice, however, that in the workshops we
had a harder time making certain that ‘the other side’
(operations versus communications) was not blamed.
We did not observe the sharing of ideas between dif-
ferent areas of expertise in the workshops, unlike
what we saw in our previous case studies. In the
workshops of those case studies, the interaction led
to a common goal of learning from the accident on a
broader scale than just within individual departments.
6 DISCUSSION
In this section, we discuss the main lessons of our case
study.
Feedback Loop. Adding the notation for feedback
loops has two benefits:
1. It allows to represent one of the material causes of
the accident, giving more insight in the develop-
ment of the accident and possible ways to prevent
such a feedback loop from occurring at all.
2. It shows how the positive feedback loop can
be broken. Breaking the feedback loop gives
valuable recommendations for future accidents in
which this feedback loop plays a role. Identifying
its solution enables the organisation to draw up
step-by-step instructions for managing this type of
situation.
Prioritisation. We were not able to prioritise the
recommendations with company Gamma, as we never
received their feedback. We propose to involve se-
nior management to instruct staff to cooperate with
the analysis.
By identifying clusters of recommendation, we
were however able to formulate candidates for capa-
bilities that could be part of a maturity model. This
preliminary result needs to be validated in other case
studies.
DATA 2024 - 13th International Conference on Data Science, Technology and Applications
68

Splitting the Group According to Expertise. Al-
though we were not able to make a quantitative com-
parison of the efficiency of the meetings, we did ob-
serve that splitting the group along lines of expertise
removed a valuable aspect of the previous case stud-
ies: the sense of a common goal between different de-
partments and achieving an atmosphere in which the
principle of ‘no blame’ could be applied more easily.
However, due to the different circumstances in which
we conducted this case study as compared with our
previous study (Wienen et al., 2024), we cannot draw
general conclusions from this observation.
Threats to Validity. A threat to the validity of our
results is that these are the results of a single case
study (in the case of the notation for the positive feed-
back 2 case studies). The capabilities for telecom-
munications business continuity are drawn from the
recommendations, which, in turn, are a result of the
actual accident. Other accidents may yield different
capabilities.
Another threat to the validity is that the workshops
were conducted online due to COVID lock downs. It
is not possible to distinguish between the impact of
online working and the effect of splitting up the group
according to expertise.
7 FINAL REMARKS
In this paper, we discussed the application and en-
hancements of TRAM, which is a method for analysing
accidents initially targeted to the telecommunications
domain. In our research, we observed that by ex-
plicitly representing feedback loops we could identify
areas that run the risk of starting a cascade of con-
sequences in a positive feedback loop, causing even
more damage to the organisation.
We observed that splitting the group according to
expertise is counterproductive and we identified busi-
ness capabilities that may form a basis for a matu-
rity model for business continuity for telecommuni-
cations. Furthermore, we proposed to obtain a spon-
sor at senior management level to ensure cooperation
from the organisation.
Further research into capability maturity models
for Business Continuity Management can give new
insights into ways to prioritise recommendations. Fit-
ting the recommendations for crisis management to
a crisis management framework may also give new
insights into prioritisation. Our clustering of recom-
mendations can be seen as a first proposal for the ca-
pabilities needed for business continuity for telecom-
munication companies, both from the aspects of pre-
venting an accident that threatens business continu-
ity and from the aspect of crisis management. The
adequacy of the clusters and their applicability as a
means for prioritising recommendations also merits
further research. Future research can also apply ad-
vanced data analytics to the analysis of the recom-
mendations, such as clustering techniques based on
NLP for discovering new capabilities. Finally, future
research may show the effect of senior management
level involvement on the prioritisation of the recom-
mendations and staff involvement.
REFERENCES
Branford, K., Naikar, N., and Hopkins, A. (2009). Guide-
lines for accimap analysis. In Hopkins, A., editor,
Learning from High Reliability Organisations, chap-
ter 10. CCH Australia Ltd.
Hollnagel, E. (2002). Understanding accidents-from root
causes to performance variability. In IEEE 7th Human
Factors Meeting, pages 1–1 – 1–6. New Century, New
Trends. Proceedings of the 2002 IEEE 7th Conference
on Human Factors and Power Plants.
Hollnagel, E. and Goteman, O. (2004). The functional res-
onance accident model. Proceedings of cognitive sys-
tem engineering in process plant, 2004:155–161.
Junttila, J. (2014). A Business Continuity Management Ma-
turity Model. Master’s thesis, University of Turku.
Lacerda, T. C. and von Wangenheim, C. G. (2018). System-
atic literature review of usability capability/maturity
models. Computer Standards & Interfaces, 55:95–
105.
Leveson, N. (2004). A new accident model for engineering
safer systems. Safety Science, 42(4):237–270.
Mahal, A. (2008). Business Continuity Management Matu-
rity Model for Banks in U.A.E. Master’s thesis, The
British University in Dubai.
Maier, A. M., Moultrie, J., and Clarkson, P. J. (2012).
Assessing Organizational Capabilities: Reviewing
and Guiding the Development of Maturity Grids.
IEEE Transactions on Engineering Management,
59(1):138–159.
Malone, N., Hernandez, M., Reardon, A., and Liu, Y.
(2020). Advanced Distributed Learning Capability
Maturity Model. Technical report, US Department of
Defense — Defense Human Resource Activity.
Rasmussen, J. (1997). Risk management in a dynamic soci-
ety: a modelling problem. Safety science, 27(2):183–
213.
Reason, J. (1990). The contribution of latent human failures
to the breakdown of complex systems. Philosophical
Transactions of the Royal Society of London. B, Bio-
logical Sciences, 327(1241):475–484.
Reis, T. L., Mathias, M. A. S., and Oliveira, O. J. d. (2017).
Maturity models: identifying the state-of-the-art and
the scientific gaps from a bibliometric study. Sciento-
metrics, 110(2):643–672.
A Cascade of Consequences: Improving an Accident Analysis Method by Learning from a Real Life Telecommunications Accident
69

Salmon, P., Goode, N., Lenne, M., Finch, C., and Cassell,
E. (2012). Understanding accident causation in led
outdoor activities: development of an accident anal-
ysis framework. Injury Prevention, 18(Supplement
1):A240–A240.
Smit, N. (2005). Business Continuity Management - a Ma-
turity Model. Master’s thesis, Erasmus University
Rotterdam.
Vesely, W. E., Goldberg, F. F., Roberts, N. H., and Haasl,
D. F. (1981). Fault tree handbook. Technical Report
0492, U.S. Nuclear Regulatory Commission.
Wienen, H. C. A., Bukhsh, F. A., Vriezekolk, E., Fer-
eira Pires, L., and Wieringa, R. J. (2024). Squeez-
ing the lemon: Using accident analysis for recom-
mendations to improve the resilience of telecommu-
nications organizations. Accepted for publication in
ICEIS 2024.
Wienen, H. C. A., Bukhsh, F. A., Vriezekolk, E., and
Wieringa, R. J. (2018). Learning from accidents: A
systematic review of accident analysis methods and
models. International Journal of Information Systems
for Crisis Response and Management (IJISCRAM),
10(3):42–62.
Wienen, H. C. A., Bukhsh, F. A., Vriezekolk, E., and
Wieringa, R. J. (2019). Applying generic AcciMap to
a DDoS attack on a Western-European telecom oper-
ator. In Proceedings of the 16th ISCRAM Conference,
pages 528–535.
Wieringa, R. J. (2014). Design Science Methodology
for Information Systems and Software Engineering.
Springer.
DATA 2024 - 13th International Conference on Data Science, Technology and Applications
70
