
Artificial Intelligence-Based Detection and Prediction of Giant African
Snail (Lissachatina Fulica) Infestation in the Gal
´
apagos Islands
Jonathan Loor
1 a
, Ariana Jim
´
enez
1 b
, Juan David Moromenacho Aguirre
2 c
, Grace Rodr
´
ıguez
3 d
,
Iv
´
an Reyes
2 e
, Paulina Vizcaino-Imaca
˜
na
2 f
and Manuel Eugenio Morocho-Cayamcela
1,2 g
1
Yachay Tech University, School of Mathematical and Computational Sciences, DeepARC Research Group,
Hda. San Jos
´
e s/n y Proyecto Yachay, Urcuqu
´
ı, 100119, Ecuador
2
Universidad Internacional del Ecuador, Faculty of Technical Sciences, School of Computer Science,
Quito, 170411, Ecuador
3
Pontificia Universidad Cat
´
olica del Ecuador, Faculty of Exact and Natural Sciences Sciences, Biology,
Quito, 170525, Ecuador
Keywords:
Pest Management, Invasive Species Detection, Biodiversity Conservation, Gal
´
apagos Islands, Artificial
Intelligence, Transformer time-series, Mobile Application Development.
Abstract:
The Gal
´
apagos Archipelago are confronting a significant threat from invasive species, notably L. fulica, which
disrupts the delicate balance of their natural ecosystem. An innovative solution is proposed, employing mobile
application technology and artificial intelligence (AI) to streamline the collection, analysis, and prediction of
L. fulica movements. The mobile application facilitates efficient recording of L. fulica sightings by field teams,
including Global Positioning System (GPS) coordinates, type, condition, and quantity. Data collected is trans-
mitted to a cloud-based server for storage and analysis, where machine learning algorithms process time-series
data to generate predictive models of L. fulica movement patterns. Results underscore the effectiveness of AI
in enhancing the efficiency and accuracy of Giant African Snail (GAS) detection and movement estimation,
facilitating informed decision-making by administrators and managers. By safeguarding the native flora and
fauna of the archipelago, this solution represents a significant stride towards mitigating the impact of invasive
species and preserving the unique biodiversity of the Galapagos Islands.
1 INTRODUCTION
The Gal
´
apagos Archipelago, renowned for its unpar-
alleled biodiversity and unique ecosystems, faces an
ongoing challenge in the form of invasive species
that threaten its delicate ecological balance (Khatun,
2018), (Collins et al., 2019). Among these invaders,
Lissachatina fulica, the giant African snail stands out
as a particularly serious threat (Miquel and Herrera,
2014). This mollusk ranks high on the list of the
100 most harmful alien species in the world due to its
rapid proliferation and devastating impact on native
a
https://orcid.org/0009-0003-0802-0858
b
https://orcid.org/0009-0002-4838-1538
c
https://orcid.org/0009-0007-6014-8911
d
https://orcid.org/0009-0006-8380-1306
e
https://orcid.org/0009-0002-2731-5531
f
https://orcid.org/0000-0001-9575-3539
g
https://orcid.org/0000-0002-4705-7923
flora and fauna (Simberloff and Rejmanek, 2020)-
Traditional methods of monitoring and controlling L.
fulica infestations rely heavily on manual data collec-
tion processes, which are often labor-intensive, time-
consuming, and prone to errors (Elias, 2022). In re-
sponse to these limitations, there is an urgent need
for innovative approaches that leverage technology to
enhance the efficiency and effectiveness of pest detec-
tion and management efforts.
In this paper, we present a novel solution aimed
at automating the detection and prediction of L. fulica
infestations in the Gal
´
apagos Archipelago through the
integration of mobile application technology and arti-
ficial intelligence (AI). Our proposed system seeks to
revolutionize the way L. fulica sightings are reported,
recorded, and analyzed, thereby facilitating proactive
and data-driven decision-making in pest control oper-
ations.
Our solution leverages mobile devices and AI
algorithms to empower field squads conducting L.
Loor, J., Jiménez, A., Aguirre, J., Rodríguez, G., Reyes, I., Vizcaino-Imacaña, P. and Morocho-Cayamcela, M.
Artificial Intelligence-Based Detection and Prediction of Giant African Snail (Lissachatina Fulica) Infestation in the Galápagos Islands.
DOI: 10.5220/0012763200003753
Paper published under CC license (CC BY-NC-ND 4.0)
In Proceedings of the 19th International Conference on Software Technologies (ICSOFT 2024), pages 403-410
ISBN: 978-989-758-706-1; ISSN: 2184-2833
Proceedings Copyright © 2024 by SCITEPRESS – Science and Technology Publications, Lda.
403

fulica surveillance by enabling real-time data collec-
tion and transmission directly from the field. The mo-
bile app streamlines data collection and automatically
extracts temperature and humidity data using Google
APIs, aiding in pest classification and seasonal anal-
ysis. This reduces the workload on field personnel
while enhancing data accuracy and timeliness. The
centralized server hosted in the cloud receives and
analyzes collected data using sophisticated machine
learning algorithms to generate predictive models of
L. fulica movement patterns. These models, based
on historical data and environmental variables, allow
stakeholders to anticipate and proactively respond to
potential outbreaks, minimizing the impact on native
ecosystems.
This represents a significant advancement in the
field of pest management, offering a scalable and
cost-effective approach to monitoring and controlling
invasive species in sensitive ecological environments.
Through the synergistic integration of mobile technol-
ogy, machine learning, and deep learning, we aim to
empower conservationists and policymakers with the
tools and insights needed to safeguard the unique bio-
diversity of the Gal
´
apagos Islands for generations to
come.
2 RELATED WORKS
2.1 Plagues and the Gal
´
apagos
Ecosystem
Pests pose a multifaceted threat by interfering with the
normal development of ecosystems, affecting agricul-
ture, public health, ecology, economy and food secu-
rity (Warner, 2019). This challenge is especially evi-
dent in the Galapagos Islands, where invasive species
pose a crucial threat to the conservation of the biodi-
versity of this natural laboratory. The introduction of
exotic species can lead to the extinction of endemic
species and affect key economic sectors, highlight-
ing the urgency of preventive measures and effective
management. The uniqueness of the Galapagos as an
evolutionary laboratory underscores the need for in-
ternational cooperation and continued research to ad-
dress the emerging dynamics of biological invasions.
One example of this problem is the snail L. fulica,
whose impact on native biodiversity has been docu-
mented. Studies have documented the impact of the
snail L. fulica on native biodiversity, causing the dis-
appearance of endemic snails in the Hawaiian Islands
and economic problems in Nepal due to crop invasion
(Budha and Naggs, 2008)(Cowie, 1998). The high re-
productive rate of L. fulica, with the ability to lay up
to 1000 eggs during its life cycle and reach the repro-
ductive stage in six months, contributes to its invasive
success (Miquel and Herrera, 2014).
Control strategies for L. fulica include methods
such as manual removal, trapping, physical barriers
and the use of chemicals or predators such as Eug-
landina rosea (Gerlach et al., 2021). However, these
methods may have limitations and compromise local
biodiversity (Gerlach et al., 2021). The choice of
strategies must be carefully considered for effective
and sustainable pest management.
2.2 Traditional Human-Based Methods
of Pest Surveillance
Historically, pest surveillance and monitoring in eco-
logical environments have relied on manual methods
such as visual inspections, trapping, and field surveys.
While these approaches have provided valuable in-
sights into pest populations and distributions, they are
often labor-intensive, time-consuming, and prone to
human error. Moreover, they may lack the scalability
and real-time data acquisition capabilities needed to
effectively address dynamic pest threats.
Traditional pest surveillance methods, such as vi-
sual inspections, trapping and field surveys, have
evolved over time (McCallum et al., 2021). Although
they provide valuable information on pest popula-
tion dynamics and distribution, they face significant
challenges, such as labor intensity, time required and
susceptibility to human error(Awuor et al., 2019).
In the Galapagos Islands, visual monitoring, search
and egg collection with subsequent incineration, and
controlled fire are used to address these challenges
(Correoso, 2006). These limitations have led to the
exploration of innovations in pest monitoring, with
the aim of improving efficiency and providing a sound
basis for preventive management and pest control in
sensitive environments such as the Galapagos Islands.
2.3 Mobile Applications for Pest
Management
The integration of mobile technology into pest man-
agement practices has emerged as a promising ap-
proach to overcome the limitations of traditional
surveillance methods. Several studies have explored
the development and deployment of mobile applica-
tions for the collection, storage, and analysis of pest-
related data. For example, apps such as PestMapper
and EDDMapS allow users to report sightings of in-
vasive species and contribute to crowd-sourced moni-
toring efforts. Similarly, in Kenya, an innovative pest
ICSOFT 2024 - 19th International Conference on Software Technologies
404

management solution is proposed, focusing on farm-
ers. This solution utilizes mobile devices to process
images and leverages crowdsourcing to assist farm-
ers in effectively identifying and controlling pest inva-
sions in their crops (Vanegas et al., 2018). While these
applications have demonstrated the potential to en-
hance data accessibility and community engagement,
they often lack advanced features for automated im-
age analysis and predictive modeling.
2.4 Transformer time-series in Pest
Detection
Recent advances in transformer-based architectures
have paved the way for automated pest detection us-
ing prognostic analysis techniques. Researchers have
developed algorithms capable of knowing the behav-
ior of an agent and predicting the next destination.
The model is trained for the exact coordinates of lon-
gitude and latitude to predict, allowing for rapid and
accurate identification of invasive species. For exam-
ple, by knowing the timing of pests, resources could
be provided to prevent their increase and subsequent
elimination from the environment. However, the ap-
plication of these techniques to real-world pest man-
agement scenarios, particularly in remote or resource-
limited environments, remains relatively unexplored
due to missing data (Abideen et al., 2021).
In this scenario, the team utilizes the PyTorch frame-
work for their project, and they are tasked with cal-
culating position encoding. To define this mathemat-
ically, they first establish the concept of position en-
coding within the context of neural network architec-
tures. Position encoding is a technique commonly
employed in sequence modeling tasks, such as nat-
ural language processing and time series analysis, to
incorporate positional information into the input em-
bedding. Mathematically, the position encoding func-
tion can be defined as follows:
For a given position p in the sequence and dimension
d of the embedding, the positional encoding is com-
puted as:
PE(2, i) = sin
p
10000
2i
d
(1)
PE(2, i + 1) = cos
p
10000
2i
d
(2)
Where i is the dimension index. These sinusoidal
functions generate values between -1 and 1 and en-
sure a unique and repeatable pattern for each position.
Also, the model is constructed to accept the following
parameters.
• The dimension of the input data, in this case, we
use only one input for each of the coordinates for
the latitude and longitude.
• The number of features in the transformer model’s
internal representations (also the size of embed-
dings). This controls how much a model can re-
member and process.
• The number of attention heads in the multi-head
self-attention mechanism.
• The number of transformer encoder layers.
dropout: The dropout probability.
In the training step batched training ensures that
the model updates its weights based on the aver-
age gradient over several data points, rather than be-
ing excessively influenced by any single instance.
Also, we can define early stopping to avoid overfit-
ting.Thus, while transformer architectures introduce
novel mechanisms and complexities, the foundational
principles of training deep learning models in Py-
Torch remain consistent. (Heaton, 2024)
2.5 Integrated Approaches to Pest
Management
A growing body of research advocates for integrated
pest management (IPM) strategies that combine mul-
tiple techniques and technologies to achieve more ef-
fective and sustainable pest control outcomes. These
approaches often incorporate elements of biologi-
cal control, cultural practices, and chemical inter-
ventions, supplemented by data-driven decision sup-
port systems. By integrating mobile applications,
deep learning, and machine learning into existing
IPM frameworks, researchers aim to enhance the effi-
ciency, precision, and ecological sustainability of pest
management efforts.
3 METHODOLOGY
The methodology employed in this study aimed to de-
velop and implement an automated detection and pre-
diction system for Lissachatina fulica infestations in
the Gal
´
apagos Archipelago.
3.1 In-situ Collection and Perimeter
Delimitation for Pest Control
The pest surveillance and management process be-
gins with users reporting snail sightings both in-
side and outside the Biodiversity and Management
Area (ABG). Teams then commence the collection
Artificial Intelligence-Based Detection and Prediction of Giant African Snail (Lissachatina Fulica) Infestation in the Galápagos Islands
405

of snails, starting with perimeter delineation or prop-
erty cleaning, followed by manual collection during
the day shift. Weeds are removed, and the area is
made debris-free to aid in snail detection. Poison is
dispersed to control snail spread before the shift ends.
During the night shift, teams focus on reducing the
snail population without live sample collection. They
patrol perimeters and interiors, marking snail sight-
ings on maps and collecting them in jars for later anal-
ysis. Snails are categorized by age and vitality, then
sent to the laboratory as deceased samples. Data from
the day’s activities, including photos and coordinates,
are recorded and organized for analysis.
The final step involves verifying snail eradication
through repeated inspections with trained dogs. This
thorough process ensures the complete removal of
snail infestations from the property. Additionally, a
requirement analysis was conducted with input from
field personnel, management, and administrative staff
to design a system tailored to their needs, including
daily report sheets.
In the requirement gathering stage, field personnel
identified the need for a database to store detailed in-
formation for making informed decisions. Key data
fields for each collection of the giant African snail
were specified:
• Date and time are mandatory fields, automatically
filled or selected.
• Latitude and longitude are automatically filled us-
ing the phone’s GPS.
• Comments, picture, and substrate are optional
fields.
Following this, the system design phase focused
on conceptualizing and architecting the solution com-
ponents. This involved designing a mobile applica-
tion interface for efficient data collection and devel-
oping a cloud-based server infrastructure for storage
and processing. Additionally, algorithms for predict-
ing giant African snail movement patterns were de-
veloped during this phase.
3.2 Flow of Data Extraction from the
Application
The development of the mobile application in-
volved utilizing cross-platform development frame-
works such as Flutter or React Native to ensure com-
patibility with both Android and iOS platforms. Key
features including real-time data collection, GPS lo-
cation tracking, image capture, and offline data stor-
age were integrated into the application. Iterative user
testing and feedback sessions were conducted to re-
Figure 1: The application collects the tracking, which is
stored locally so that when a pest is found, the tracking
field in the form can be filled out. When a pest is found
(L. fulica), it is mandatory to fill in the information on the
context in which it was found. You can also add photos of
the pest. The form data is stored in the Google Firebase
cloud to finally have a report stored in the cloud.
fine the application’s design and functionality based
on user preferences and usability considerations.
3.3 Dataset
Due to the recent development of the application and
the limited availability of data for model training, our
team had to find alternative methods to gather data.
This led us to utilize an online platform that offers
geographical coordinates for shared routes. These
coordinates, which include latitude and longitude,
are employed to map routes on interactive interfaces
and provide accurate information about notable points
along the route. Users who contribute routes on Wik-
iloc can mark their paths using the platform’s interac-
tive map and identify significant points along the jour-
ney. These points are recorded alongside their cor-
responding geographical coordinates, enabling other
users to precisely follow the route using GPS devices
or online mapping tools. In our quest to focus on
our specific area of interest, namely the Galapagos
Islands, we followed patterns to ensure that the rela-
tionships between coordinates were meaningful. We
collected data spanning five months and consolidated
it, adjusting field titles and retaining only the essential
data fields required for training our model. This pro-
cess resulted in a dataset containing 56,000 entries.
3.4 Application of the K-Means
Clustering Model
After conducting the exploratory analysis of the data,
they proceeded to find the best k or the number of
clusters by analyzing the graph, where they selected
k=3. This was chosen because, upon analyzing the
data using the elbow method, a clear inflection point
was observed at 3, indicating that it is the optimal
number for creating the clusters. The final result of
the k-means algorithm is a partition of the data into k
clusters, where each cluster is represented by its cen-
ICSOFT 2024 - 19th International Conference on Software Technologies
406

troid. In this case, there are 3 clusters: the first one
with 13,770 geographical positions, the second one
with 27,232 geographical positions, and the third one
with 15,009 geographical positions. In our case, we
selected the first cluster of these clusters for the anal-
ysis of the results.
3.5 Predictions with Transformer Time
Series
Transformer time series models predict L. fulica
movement patterns using historical data and environ-
mental variables. The Transformer algorithm oper-
ates as follows:
1. Tokenization of Time Series: The time series
data is converted into a sequence of tokens.
2. Embedding Tokens: These tokens are embedded
into a higher-dimensional space to capture com-
plex data relationships.
3. Transformer Blocks Application: Transformer
blocks process the token sequence, capturing
long-term dependencies in the data.
4. Future Value Prediction: The output of the last
transformer block is used to predict future values,
typically through a linear layer.
The pseudo-code of the transformer is as simple
as the following:
3.5.1 Time Series Analysis and Model
Deployment
In addition to the implementation of the Transformer
algorithm, additional activities were performed to en-
sure the effectiveness and successful deployment of
the predictive model. This involved the use of time
series analysis techniques to incorporate time depen-
dencies and seasonality into the predictive model.
Next, integration and deployment activities were
carried out to implement the developed model into a
cohesive system. This included integration of the mo-
bile application with cloud-based server infrastructure
to enable seamless data transmission and storage. Im-
plementation of computer vision and machine learn-
ing models on the server enabled real-time processing
of data collected from the mobile application. Exten-
sive end-to-end testing was performed to ensure the
reliability, scalability, and security of the integrated
system.
3.5.2 Performance Evaluation and Validation
The final phase of this research involved thorough
evaluation and validation studies to gauge the effec-
tiveness and practicality of the implemented system
Require: Input lookback time series X ∈ R
T ×N
; input
Length T ; predicted length S; variates number N; token
dimension D; Transformer block number L.
1. X = X
T
.
▷X ∈ R
N×T
2. ▷ Multi-layer Perceptron works on the last dimension to
embed series into variate tokens.
3. H
0
= MLP(X)
▷H
0
∈ R
N×D
4. for l in {1, ··· , L}:
• ▷ Run through Transformer blocks.
• ▷ Self-attention layer is applied on variate tokens.
H
l−1
= LayerNorm
H
l−1
+ Self-Attn
H
l−1
▷H
l−1
∈ R
N×D
• ▷ Feed-forward network is utilized for series
representations, broadcasting to each token.
H
l
= LayerNorm
H
l−1
+ Feed-Forward
H
l−1
▷H
l
∈ R
N×D
• ▷ LayerNorm is adopted on series representations to
reduce variates discrepancies.
5. End for
ˆ
Y = MLP
H
L
▷ Project tokens back to predicted
series,
ˆ
Y ∈ R
N×S
(Liu et al., 2023)
Algorithm 1: Transformer Architecture.
in real-world scenarios. Through rigorous trials and
validation exercises, feedback was gathered from end-
users and stakeholders to identify areas for improve-
ment and assess the system’s impact on key pest man-
agement outcomes, including detection efficiency, re-
sponse time, and resource allocation.
Controlled experiments and carefully constructed
case studies were conducted to compare the perfor-
mance of the automated detection and prediction sys-
tem with alternative methods. These efforts provided
further validation, confirming the usefulness and ef-
fectiveness of the developed solution through empiri-
cal examination and comparative analysis.
4 RESULTS AND DISCUSSION
The implementation of the automated detection and
prediction system yielded promising results in ef-
fectively addressing L. fulica infestations in the
Gal
´
apagos Archipelago.
Artificial Intelligence-Based Detection and Prediction of Giant African Snail (Lissachatina Fulica) Infestation in the Galápagos Islands
407
4.1 Mobile Application Performance
The developed mobile application demonstrated
strong performance in facilitating real-time data col-
lection and transmission from field staff to cloud-
based servers . Field testing indicated that the app’s
easy-to-use interface and intuitive design significantly
improved the efficiency and accuracy of L. fulica
surveillance efforts. Additionally, the addition of fea-
tures such as GPS location tracking and offline data
storage ensured seamless operation in remote and
resource-constrained environments. Here we have
two of the main tabs of the User Experience of the ap-
plication. The incorporation of these user-centric de-
sign elements contributes to the application’s success
in optimizing data collection processes and enhancing
surveillance efforts.
4.2 Machine Learning Model
As previously noted, a clustering approach was em-
ployed to initialize the training process for the trans-
formers. Please refer to Fig. 2 for visual representa-
tion.
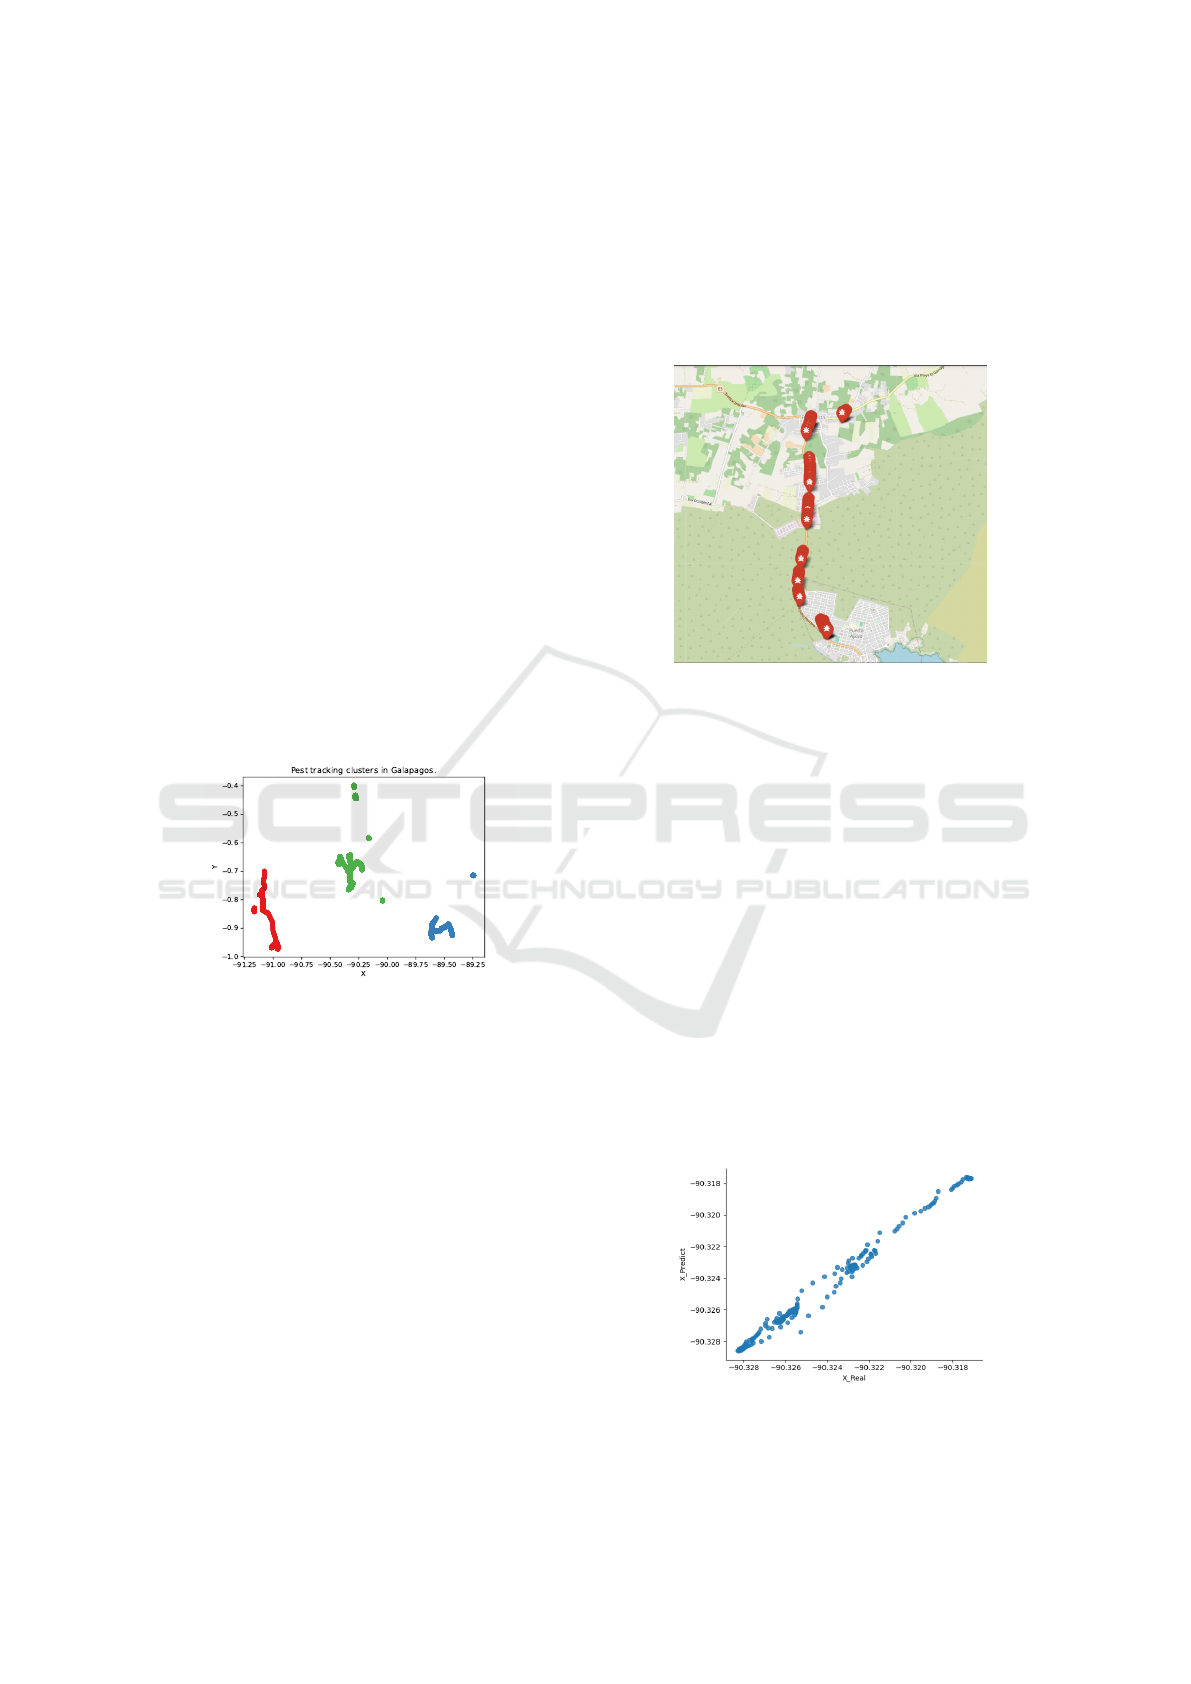
Figure 2: This image represents the different clusters given
the position of the pests found. They are the key to im-
proving the number of correct positions, as they prevent the
transformer model from better modeling the phenomenon
in a specific area.
The machine learning models deployed for pre-
dicting L. fulica movement patterns demonstrated
considerable predictive accuracy and robustness.
Time-series analysis techniques effectively captured
temporal dependencies and seasonal variations in L.
fulica populations, enabling the generation of reliable
predictive models. These models provided valuable
insights for proactive pest management strategies, al-
lowing stakeholders to anticipate and preemptively
respond to potential L. fulica outbreaks. The model
produced these predictions with remarkable accuracy
as is shown in Fig 3.; the error rate in longitude (x)
and latitude (y) inside the geographic system was
only 0.001. Every spot on the picture represents a
place where the model predicted there would be pests,
which is quite similar to what was observed. This
high degree of accuracy highlights how well the pre-
dictive model predicts the existence of pests, offer-
ing insightful information for preventive pest manage-
ment plans and facilitating prompt responses to stop
possible outbreaks.
Figure 3: This image represents 112 predicted points where
plagues were indeed found in the first days of the 16th
month, with an error of 0.001 in the geographic system in
both x (longitude) and y (latitude).
4.3 Real and Prediction Positions with
Transformer Model
For a better understanding of the effectiveness of the
employed model, Fig. 4 illustrates the relationship
between actual x coordinates (X-axis) and predicted
coordinates using a Transformer model (Y-axis). Ac-
tual coordinates are depicted as blue dots, while the
blue line represents the trend predicted by the model.
It is evident that the model accurately predicts the ac-
tual x coordinates, as most blue dots cluster closely
around the blue line, indicating precise model predic-
tions. However, some points deviate from the blue
line, suggesting that the model predictions have a few
problems in all cases, indicating room for improve-
ment through parameter optimization.
Figure 4: Relationship between the actual X coordinates
and the coordinates predicted with our model.
ICSOFT 2024 - 19th International Conference on Software Technologies
408
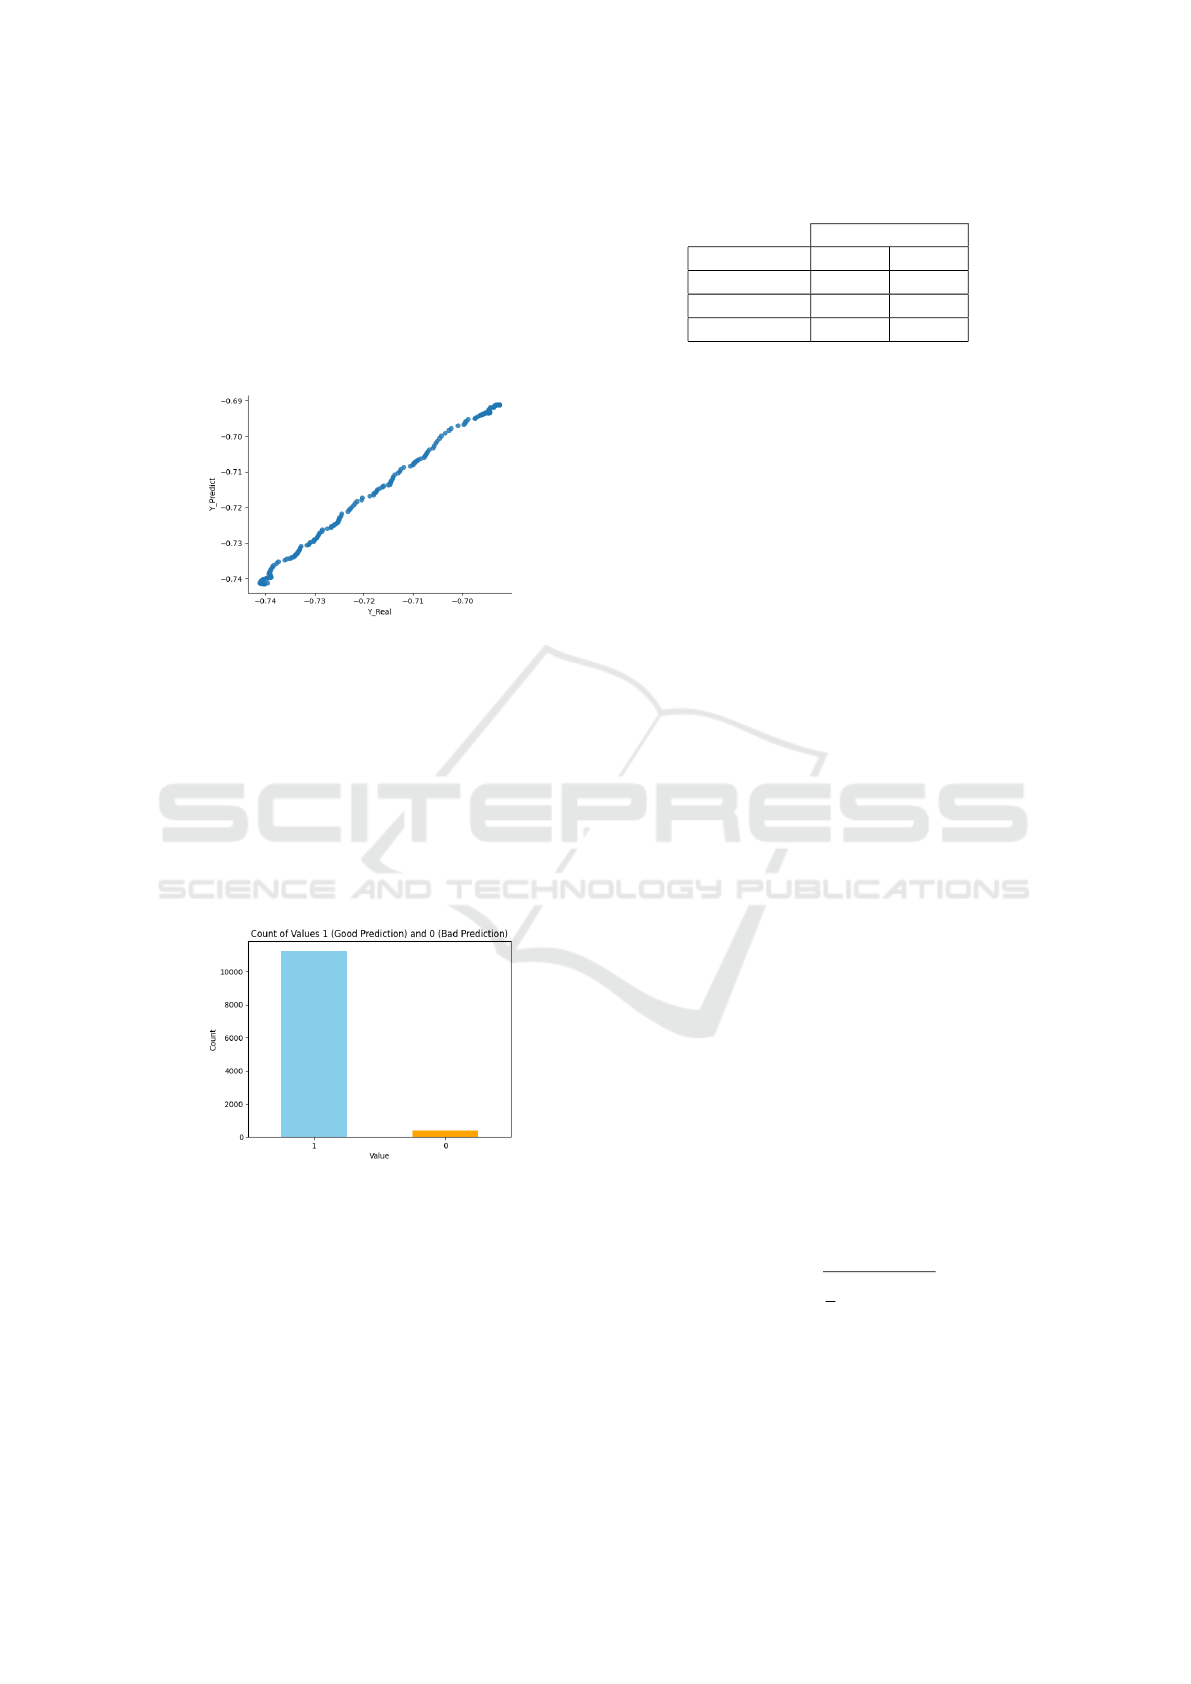
Similarly, Fig. 5 illustrates the relationship be-
tween actual y-values and predicted y-values. The
model performs better for y-values compared to x-
values, indicating its stronger predictive capability for
this coordinate. However, discrepancies between ac-
tual and predicted values still exist, suggesting the
need for adjustments or modifications to enhance the
model’s accuracy, particularly for x-values. With
Figure 5: Relationship between the actual y coordinates and
the coordinates predicted with our model.
a precision of 0.001 in geographic coordinates, the
study distinguished between correctly predicted (1)
and incorrectly predicted (0) x and y coordinates in
the Fig 6. Notably, the predominant distribution
within class 1 suggests the accuracy of both the train-
ing process and the resulting outcomes. This distri-
bution underscores the effectiveness of the model in
accurately predicting geographic coordinates, thereby
instilling confidence in its overall performance and re-
liability.
Figure 6: This bar chart represents the total positions from
month 16 to month 24 which are the test positions in graph 1
are the correct positions and 0 are the incorrect coordinates
which were predicted with a value of 0.001 in geographic
coordinates.
4.4 Integration and Deployment
The integration of mobile application, computer vi-
sion, and machine learning components into a co-
hesive system facilitated seamless data transmission,
processing, and storage. End-to-end testing con-
firmed the reliability, scalability, and security of the
Table 1: Metrics obtained from the three methods.
RMSE
Model X Y
Prophet 0.6734 0.1393
LSTM 0.0599 0.0121
Transformer 0.0118 0.0111
integrated system, ensuring its suitability for opera-
tional deployment in real-world scenarios. Addition-
ally, user feedback and validation studies highlighted
the system’s practical utility and ease of adoption by
field personnel and stakeholders.
4.5 Comparison with Traditional
Methods
Comparing the automated detection system with tra-
ditional methods showed significant improvements
in efficiency, response time, and resource allocation.
The automated system excelled in accuracy, speed,
and scalability, mitigating the impact of L. fulica in-
festations in the Gal
´
apagos Archipelago.
The section analyzes LSTM, Prophet, and Trans-
former models with 56,000 data points. While
Prophet is specialized for time series with strong sea-
sonal patterns, LSTM and Transformer models are
more versatile.
Results show that the proposed model consistently
outperforms others, as shown in Table 1.
4.6 Discussion
The results demonstrate the effectiveness of integrat-
ing mobile technology, computer vision, and machine
learning into pest management practices to achieve
more sustainable and efficient outcomes. By leverag-
ing real-time data collection, automated image anal-
ysis, and predictive modeling capabilities, the devel-
oped system empowers stakeholders with timely and
actionable insights for proactive pest control strate-
gies. Moreover, the scalability and adaptability of the
system enable its potential application in other eco-
logical settings facing similar pest management chal-
lenges.
In predictions of destinations, the team uses root
mean square error (RMSE).
RMSE =
s
1
n
n
∑
i=1
(y
i
− ˆy
i
)
2
(3)
Where:
• n is the total number of observations.
• y
i
are the observed values.
• ˆy
i
are the predicted values.
Artificial Intelligence-Based Detection and Prediction of Giant African Snail (Lissachatina Fulica) Infestation in the Galápagos Islands
409

5 CONCLUSIONS
In conclusion, this study introduces an innovative so-
lution for detecting and predicting L. fulica infes-
tations in the Gal
´
apagos Archipelago using mobile
app technology and AI. By combining real-time data
collection, automated image analysis, and predictive
modeling, our system offers a scalable and efficient
approach to pest management in sensitive ecosys-
tems. This research demonstrates improved surveil-
lance efficiency and accuracy, enabling rapid report-
ing and proactive response to potential outbreaks.
This integration of mobile tech and AI provides ac-
tionable insights for targeted control measures, con-
tributing to the preservation of the Gal
´
apagos’ eco-
logical integrity.
6 FUTURE WORK
Moving forward, further research is necessary to re-
fine the solution, validate predictive models, and inte-
grate additional data sources. Ongoing collaboration
with local stakeholders is crucial for successful im-
plementation and sustainability. Additionally, com-
puter vision technology will enhance efficiency by ac-
curately classifying L. fulica specimens from field im-
ages, reducing manual workload and expediting data
collection.
REFERENCES
Abideen, Z. U., Sun, H., Yang, Z., Ahmad, R. Z., Iftekhar,
A., and Ali, A. (2021). Deep wide spatial-temporal
based transformer networks modeling for the next des-
tination according to the taxi driver behavior predic-
tion. Applied Sciences, 11(1):17.
Awuor, F., Otanga, S., Kimeli, V., Rambim, D., and Abuya,
T. (2019). E-pest surveillance: Large scale crop pest
surveillance and control.
Budha, P. B. and Naggs, F. (2008). The giant african land
snail lissachatina fulica ( bowdich ) in nepal. The
Malacologist, 50.
Collins, K., Keith, I., and Dawson, T. P. (2019). Countering
the threat of invasive species to the galapagos marine
reserve.
Correoso, M. (2006). Estrategia preliminar para evaluar y
erradicar achatina fulica gastroda: Achatineaceae) en
ecuador. E-RevSerZoologica, 2:6.
Cowie, R. H. (1998). Patterns of introduction of non-
indigenous non-marine snails and slugs in the hawai-
ian islands. Biodiversity and Conservation, 7.
Elias, S. A. (2022). Conservation Status of Gal
´
apagos En-
demic Naesiotus Land Snails, volume 1-3, pages 422–
435. Elsevier.
Gerlach, J., Barker, G. M., Bick, C. S., Bouchet, P., Brodie,
G., Christensen, C. C., Collins, T., Coote, T., Cowie,
R. H., Fiedler, G. C., Griffiths, O. L., Florens, F. B.,
Hayes, K. A., Kim, J., Meyer, J. Y., Meyer, W. M.,
Richling, I., Slapcinsky, J. D., Winsor, L., and Yeung,
N. W. (2021). Negative impacts of invasive predators
used as biological control agents against the pest snail
lissachatina fulica: the snail euglandina ‘rosea’ and
the flatworm platydemus manokwari.
Heaton, J. (2024). Transformer timeseries. GitHub.
Khatun, K. (2018). Land use management in the galapagos:
A preliminary study on reducing the impacts of inva-
sive plant species through sustainable agriculture and
payment for ecosystem services. Land Degradation
and Development, 29.
Liu, Y., Hu, T., Zhang, H., Wu, H., Wang, S., Ma, L., and
Long, M. (2023). itransformer: Inverted transformers
are effective for time series forecasting. arXiv preprint
arXiv:2310.06625.
McCallum, B. D., Geddes, C. M., Chatterton, S., Peng, G.,
Carisse, O., Turkington, T. K., Olfert, O., Leeson, J.,
Sharpe, S., Stephens, E., Hervet, V., Aboukhaddour,
R., and Vankosky, M. (2021). We stand on guard for
thee: A brief history of pest surveillance on the cana-
dian prairies.
Miquel, S. E. and Herrera, H. W. (2014). Catalogue
of terrestrial gastropods from gal
´
apagos (except bu-
limulidae and succineidae) with description of a new
species of ambrosiella odhner (achatinellidae) (mol-
lusca: Gastropoda). Archiv fur Molluskenkunde, 143.
Simberloff, D. and Rejmanek, M. (2020). 100 of the World’s
Worst Invasive Alien Species: A Selection From The
Global Invasive Species Database.
Vanegas, F., Bratanov, D., Powell, K., Weiss, J., and Gon-
zalez, F. (2018). A novel methodology for improv-
ing plant pest surveillance in vineyards and crops us-
ing uav-based hyperspectral and spatial data. Sensors
(Switzerland), 18.
Warner, K. (2019). Pest Control, pages 1953–1960.
Springer Netherlands, Dordrecht.
ICSOFT 2024 - 19th International Conference on Software Technologies
410
