
Risk-Stratified Multi-Objective Resource Allocation for Optimal
Aviation Security
Eva K. Lee
1,2,3
a
, Taylor J. Leonard
2,4
b
and Jerry C. Booker
5
1
The Data and Analytics Innovation Institute, Atlanta GA 30309, U.S.A.
2
Georgia Institute of Technology, Atlanta GA 30322, U.S.A.
3
Accuhealth Technologies, Atlanta GA 30310, U.S.A.
4
The United States Department of Air Force, Pentagon,
Washington
D.C. 20330, U.S.A.
5
The Transportation Security Administration, The United States Department of Homeland Security, U.S.A.
Keywords: Data-Driven Enterprise Risk Assessment, Aviation Security, Transportation Security, Border Security,
Security Measures, Multi-Objective Portfolio Optimization, Resource Allocation, Risk-Informed Decision,
Mixed Integer Program.
Abstract: This study aims to establish a quantitative construct for enterprise risk assessment and optimal portfolio
investment to achieve the best aviation security. We first analyze and model various aviation transportation
risks and establish their interdependencies via a topological overlap network. Next, a multi-objective portfolio
investment model is formulated to optimally allocate security measures. The portfolio risk model determines
the best security capabilities and resource allocation under a given budget. The computational framework
allows for marginal cost analysis which determines how best to invest any additional resources for the best
overall risk protection and return on investment. Our analysis involves cascading and inter-dependency
modeling of the multi-tier risk taxonomy and overlaying security measures. The model incorporates three
objectives: (1) maximize the risk posture (ability to mitigate risks) in aviation security, (2) minimize the
probability of false clears, and (3) maximize the probability of threat detection. This work presents the first
comprehensive model that links all resources across the 440 federally funded airports in the United States.
We experimented with several computational strategies including Dantzig-Wolfe decomposition, column
generation, particle swarm optimization, and a greedy heuristic to solve the resulting intractable instances.
Contrasting the current baseline performance to some of the near-optimal solutions obtained by our system,
our solutions offer improved risk posture, lower false clear, and higher threat detection across all the airports,
indicating a better risk enterprise strategy and decision process under our system. The risk assessment and
optimal portfolio investment construct are generalizable and can be readily applied to other risk and security
problems.
1 INTRODUCTION
In the aftermath of the September 11, 2001, terrorist
attacks, the President of the United States signed the
Aviation and Transportation Security Act into law
requiring screening conducted by federal officials,
100 percent checked baggage screening, and
expansion of the Federal Air Marshal Service and
reinforced cockpit doors. The Transportation Security
Administration (TSA) was subsequently created to
oversee security in all modes of transportation.
Specifically, a computer-assisted passenger pre-
a
https://orcid.org/0000-0003-0415-4640
b
https://orcid.org/0000-0002-6753-9743
screening system, Computer-Assisted Passenger Pre-
screening System (CAPPS) was developed to
evaluate all passengers. The current generation,
Secure Flight, is a risk-based passenger pre-screening
program that matches passengers' names against
trusted traveler lists and watchlists and categorizes
them as high or low-risk (Administration, n.d.). Based
on information derived from both government and
commercial databases, Secure Flight conducts risk
assessments to determine which passengers might be
eligible for TSA precheck screening or standard
screening. The results also prevent potential
104
Lee, E., Leonard, T. and Booker, J.
Risk-Stratified Multi-Objective Resource Allocation for Optimal Aviation Security.
DOI: 10.5220/0012769000003756
Paper published under CC license (CC BY-NC-ND 4.0)
In Proceedings of the 13th International Conference on Data Science, Technology and Applications (DATA 2024), pages 104-117
ISBN: 978-989-758-707-8; ISSN: 2184-285X
Proceedings Copyright © 2024 by SCITEPRESS – Science and Technology Publications, Lda.

passengers on the No-Fly List and Centers for
Disease Control and Prevention Do Not Board List
from boarding an aircraft (Sadler, 2016).
Security constructs have been designed as multi-
layered systems to incorporate several security
measures for effective screening. Although numerous
optimization models have been proposed for aviation
security prior to 9/11, the first screening models were
developed post 9/11. These models target checked
baggage for high-risk passengers screened for
explosives, selectee, and non-selectee screening,
where the objectives determine how to deploy and use
limited baggage screening devices optimally.
Subsequently, multiple baggage security models were
developed (McLay, 2011). Other models tackle how
to match the limited security measures to the number
of passengers who need to be screened (Poole &
Passantino, 2003), where findings reveal that a risk-
based system might be more effective than the system
where all passengers and bags receive equal scrutiny.
Multilevel allocation criteria where every
would-be passenger is assigned an assessed threat
value, which quantifies the risk associated with the
characteristics of the passenger was also explored
(McLay, 2011). A similar approach considers how to
allocate explosive-screening devices for checked
baggage in multiple airports settings where
passengers are divided into classes according to their
perceived risk levels were also studied (Sewell et al.,
2012). For device allocation, Sewell et al. modelled
the inherent trade-off decision between using faster,
more accurate, and expensive devices versus slower,
less reliable, but less expensive devices, or some
combination of the two. And Nie et al. modelled the
fraction of passengers who are assigned to threat class
and the staffing needs at each check station within
each screening group.
Stewart and Mueller (Stewart & Mueller, 2017)
are the only publication/s that include all security
measures, though no mathematical analyses and
tradeoffs have been performed. There exists no
mathematical models developed that integrate all
screenings (Checked baggage, Carry-on baggage, and
Passenger) into a comprehensive risk-based system.
In this paper, we integrate passenger, baggage,
and cargo screening operations to model complex
airport security paths. The work adds new
contributions towards the Department of Homeland
Security (DHS)’s on-going risk enterprise
management (ERM) efforts and its desire to
implement an all-encompassing model. This new
system allows TSA to perform risk-aware decisions
to better allocate new resources to benefit overall
aviation security. It maximizes the policymakers’
ability to protect against risks and helps organizations
to utilize their resources in a smart way to achieve
their organizational and strategic objectives.
2 METHODS AND DESIGN
Contribution: In this study, we establish a
comprehensive enterprise risk management-based
resource allocation model that expands upon previous
research and combines all models and security
measures into a single multi-objective portfolio
investment optimization model framework. We also
introduce the concept of “Risk Posture” to measure
the TSA’s resilience and capabilities against any
potential risks. By integrating various aviation
transportation risks and modeling their
interdependencies, the ERM-based model provides a
robust framework for allocating security measures
efficiently across the U.S. aviation sector. The biggest
knowledge gap in previous research is that any type
of optimization model concerning enterprise risk
management was performed only at an operational
level. This work represents the first model that
encompasses a full multi-tier enterprise risk
management approach across strategic, tactical, and
operational levels. It is also the first model to
establish and focus in depth on risk posture. The
security measure and device allocation problem,
combined with a passenger risk assessment policy,
can be used to structure a risk-based screening
strategy to use limited screening resources
effectively. The model is generalizable and can
accommodate additional / different measures, new
technology, or new airport setup.
2.1 Risk Quantification
The Department of Homeland Security defines risk as
“the potential for an unwanted outcome resulting
from an incident, event, or occurrence, as determined
by its likelihood and the associated consequences”
(Council, 2010). By incorporating enterprise risk
management into its strategy, TSA can use a
consistent analytic framework to balance risk and cost
on a common basis across the enterprise (Minsky,
2013). Risk assessments must be connected to goals
and activities within a risk taxonomy to give purpose
and measurement of effectiveness. Only by
quantifying risks and tolerances upfront and using a
common framework can the allocation of resources
be applied to the methods that manage them
effectively.
Risk-Stratified Multi-Objective Resource Allocation for Optimal Aviation Security
105
We will apply network topology to quantify and
correlate risks. The topological overlap matrix
(TOM) is a similarity measure for biological
networks. TOM was first introduced to analyze
metabolic networks with distinct organisms that are
organized into connected topological modules that
combine in a hierarchical manner (Ravasz, 2002).
The generalized topological overlap measure
(GTOM) introduces a general class of node
dissimilarity measures. It can be used to identify
network modules (sets of tightly connected nodes)
(Yip, 2007), or define novel measures of node
connectivity. These GTOM-based connectivity
measures go beyond the usual nodal degree (number
of connections) by considering higher-order
connections. They are useful in the context of gene
co-expression network analysis.
A topological representation of the TSA risk
factors became a natural fit. GTOM provides a means
to detail the interdependencies and hierarchy for a
correlated risk network that operates without
quantitative values. The resulting risk expressions
will then be integrated into an objective function
within the portfolio optimization problem.
2.1.1 Risk Correlation
Risk correlation influences the overall risk of projects
within an organization. Developing the
interdependencies in enterprise risk for TSA is an
intricate process. It requires an understanding of the
TSA enterprise, their risk appetite, and the associated
risks. Although TSA is a governmental organization
that does not ascribe to a capitalist set of objectives,
ERM is still a very critical tool for the organization to
implement. We proceed by reviewing all current TSA
enterprise risks, tracking their associated risk
appetites, and then defining interdependence
relationships between all the risk factors. Due to
sensitivity issues, we use generic names to discuss the
evolution of a risk interdependency mapping for
TSA, without naming the precise risk terminologies.
Let 𝐴= 𝐴
be a symmetric adjacency matrix
with entries in [0,1]. For an unweighted network, the
entries take on binary values of 0 or 1 depending on
whether the two nodes are adjacent (connected). A
more complex network might depend on the degree
of interaction between nodes. The matrix is then
normalized such that the diagonals are equal to 1. The
off diagonals are scaled values, thereby extending the
adjacency matrix from the binary case to values in the
range of [0,1]. In a hierarchical network, nodes can be
connected by links carrying a weight 𝐽
. The
weighted degree of node i is defined as: 𝑤
=
∑
:
𝐽
.
The original TOM does not account for the
presence of weights 𝑂
=
|
∩
|
|
|,|
|
.
The presence of weights can be accounted for by
replacing the unweighted adjacency matrix with the
normalized coupling matrix (𝐽
/𝐽
) 𝑂
=
×
∑
{
,
}
. If 𝑂
=1 then the node with
fewer connections satisfies the conditions that all its
neighbors are also neighbors of the other node, and it
is connected to the other node. Alternatively, 𝑂
=0
if 𝑖 and 𝑗 are unconnected and the two nodes do not
share any neighbors. Table 1 shows the weighted
topological overlap matrix established for 17 TSA-
identified enterprise risk factors.
Table 1: The Weighted Topological Overlap Matrix for 17
TSA-identified enterprise risk factors.
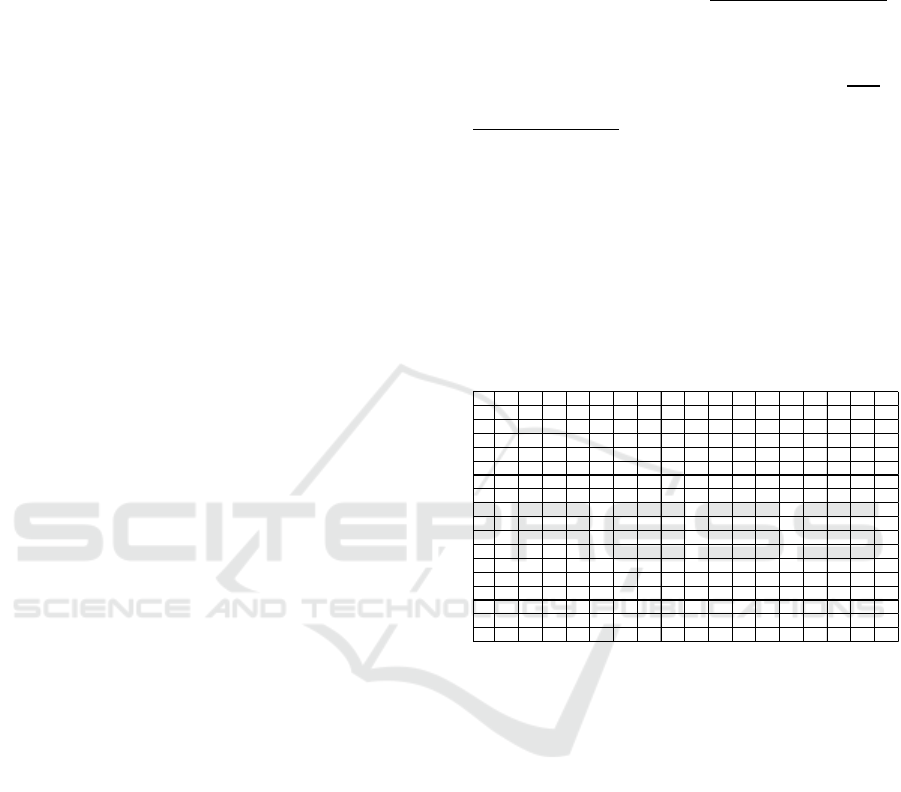
TSA employs a system of interconnected security
layers to deter, detect, and prevent the exploitation of
commercial aviation by terrorists. Figure 1 shows an
example of layers of U.S. aviation security (Kean et
al., 2004). The analysis herein incorporates all current
and newly tested measures but is not a comprehensive
list of security measures employed. Each security
measure has an interdependent relationship with the
enterprise risk factors identified by TSA risk
management leaders. Table 2 shows a security
measure assignment (SMA) matrix that shows the
direct relationships between 26 security measures
against the 17 TSA-identified enterprise risk factors.
The assignment matrix allows us to relate the risk
taxonomy to the security measures put in place.
Depending on the security measure, a failure to detect
a threat could impact multiple risk elements of the
taxonomy.
R1 R2 R3 R4 R5 R6 R7 R8 R9 R10 R11 R12 R13 R14 R15 R16 R17
R1 1.00 0.22 0.13 0.17 0.07 0.07 0.07 0.13 0.00 0.00 0.00 0.00 0.00 0.00 0.00 0.00 0.00
R2 0.17 1.00 0.17 0.07 0.07 0.00 0.00 0.00 0.00 0.00 0.00 0.00 0.00 0.00 0.00 0.00 0.00
R3 0.07 0.17 1.00 0.00 0.17 0.07 0.00 0.00 0.00 0.00 0.00 0.00 0.00 0.00 0.00 0.00 0.00
R4 0.11 0.14 0.14 1.00 0.14 0.11 0.33 0.21 0.00 0.00 0.00 0.00 0.17 0.00 0.17 0.00 0.00
R5 0.00 0.07 0.17 0.00 1.00 0.17 0.00 0.00 0.00 0.00 0.00 0.00 0.00 0.00 0.00 0.00 0.00
R6 0.00 0.00 0.08 0.00 0.20 1.00 0.00 0.00 0.00 0.00 0.00 0.00 0.00 0.00 0.00 0.00 0.00
R7 0.06 0.06 0.06 0.33 0.06 0.06 1.00 0.33 0.00 0.00 0.00 0.00 0.22 0.00 0.22 0.00 0.00
R8 0.24 0.24 0.24 0.30 0.24 0.24 0.33 1.00 0.19 0.00 0.00 0.00 0.20 0.00 0.20 0.11 0.00
R9 0.33 0.33 0.33 0.00 0.33 0.33 0.00 0.33 1.00 0.14 0.00 0.00 0.20 0.00 0.20 0.11 0.00
R10 0.18 0.26 0.22 0.10 0.22 0.18 0.00 0.00 0.00 1.00 0.00 0.00 0.00 0.00 0.00 0.00 0.00
R11 0.00 0.00 0.00 0.00 0.40 0.40 0.00 0.00 0.00 0.00 1.00 0.00 0.00 0.29 0.00 0.00 0.00
R12 0.27 0.21 0.27 0.19 0.27 0.33 0.22 0.22 0.30 0.33 0.29 1.00 0.41 0.33 0.41 0.24 0.22
R13 0.00 0.00 0.00 0.19 0.00 0.00 0.22 0.22 0.22 0.11 0.00 0.00 1.00 0.00 0.38 0.00 0.00
R14 0.00 0.00 0.11 0.00 0.33 0.33 0.00 0.00 0.00 0.00 0.00 0.00 0.00 1.00 0.00 0.00 0.00
R15 0.26 0.36 0.30 0.33 0.30 0.23 0.22 0.13 0.00 0.00 0.00 0.00 0.17 0.00 1.00 0.14 0.07
R16 0.21 0.18 0.26 0.14 0.26 0.26 0.00 0.00 0.00 0.00 0.00 0.00 0.00 0.00 0.00 1.00 0.17
R17 0.25 0.18 0.25 0.14 0.23 0.25 0.00 0.00 0.00 0.00 0.00 0.00 0.00 0.00 0.00 0.14 1.00
DATA 2024 - 13th International Conference on Data Science, Technology and Applications
106
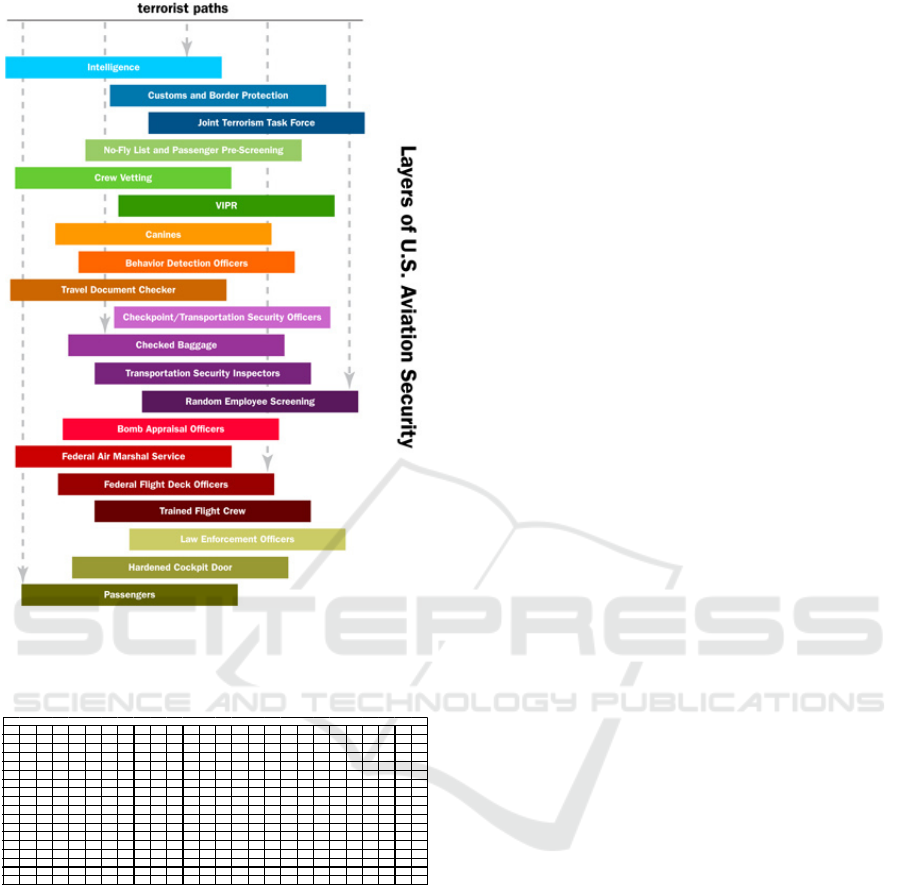
Figure 1: Layers of U.S. Aviation Security (Kean et al.,
2004).
Table 2: Security Measure Assignment (SMA) Matrix.
2.1.2 Risk Posture
We introduce the term “Risk Posture” to describe the
overall readiness to take risks, which is an accurate
description of TSA’s strategy to always be prepared.
We develop a method to calculate the risk posture
evaluation metric as a means to integrate the risk
factors and security measures that are put in place by
TSA. Our goal is to maximize the overall risk posture.
This allows us to utilize the probability of detection
versus the probability of attack. While the exact
values for the probability of detection are unknown,
there are estimated values of the conditional
probability of detection for device type
d given a
particular type of threat, 𝑝
∀ 𝑑∈𝐷, that are derived
from manufacturer capability tests.
The risk posture is calculated by multiplying the
adjusted risk values by the selected security
measures, as summarized below:
Risk Impact Values (RIV) = TOM*SMA
Adjusted Risk Values (ARV) = 𝑝
× 𝑅𝐼𝑉
Risk Posture =
∑
𝑥
× 𝐴𝑅𝑉
(OBJ1)
2.2 Data Collection and Inclusion
In the context of the type of passenger prescreening
system exemplified by Secure Flight, we want to
determine an optimal allocation of threat detection
devices and measures for screening checked baggage,
carry-on baggage, and passengers across a set of
airports so as to maximize the risk posture, maximize
the number of threats to be detected, and minimize the
overall false clear rate while considering passenger
threat classification. We impose constraints on time
available at each check station, flow capacity at
security stations, budget, as well as staffing needs at
each check station.
At airports, all passengers and items pass through
various check stations, with each outfitted with
several security measures for threat detection. It is
standard practice that all passengers and items are
subjected to a series of screenings at mandatory
check-ins. For example, document verification, walk
through metal detectors/body scanners, baggage
scanners, etc. After inspection of a passenger/item,
the screening measure or personnel will give a clear
signal (No Threat) or an alarm signal (Threat). There
are four types of alarms, and while all four are
critically important, the two alarms that we are most
concerned with are true alarms and false clears. True
alarms correctly detect existing threats, and false
alarms give an alarm when no threat exists.
False alarm and false clear probabilities are
performance measures for the screening system.
Higher performance means lower values of these
probabilities. False alarms increase inspection delays
and mean that the system is not as reliable as we hope,
while false clears can be potentially fatal for allowing
threats to go undetected.
Risk-based security paradigms classify
passengers into different security classes based on the
perceived risk of each passenger, where the
passengers and their checked and carry-on baggage
are screened using pre-specified combinations of
detection devices (e.g., magnetometer, x-ray
machine) and procedures (e.g., hand search, pat-
down). Within each security class, a passenger or bag
may undergo screening from multiple devices or
procedures. A passenger or bag clears the security
SM1 SM2 SM3 SM4 SM5 SM6 SM7 SM8 SM9 SM10 SM11 SM12 SM13 SM14 SM15 SM16 SM17 SM18 SM19 SM20 SM21 SM22 SM23 SM24 SM25 SM26
11111111111111111111111111
00000000111111111111111111
11111111111111111111111111
11111111000111101100011111
00011000111111111111111111
11111111111111111111111111
00000000000111101100000000
00111110000000100100001001
00000000111111100000000000
00000000111111100000000000
11001111111111011111100000
00000000111111100000000000
11111111111111111111111111
11000011011000011111100000
00111110000000000100001111
10111111000000101111111111
11110000000000000000000000
Security Measure
Risk-Stratified Multi-Objective Resource Allocation for Optimal Aviation Security
107

checkpoint only if all devices and procedures used in
this class detect no threat. If a threat is detected or if
reasonable suspicion of a threat arises, then the
passenger or bag undergoes additional screening,
usually through a more threat-specific, time-
consuming process. The use of devices as part of the
security operations endures costs associated with
installing, operating, and maintaining the devices.
The preponderance of costs associated with screening
procedures is associated with employing personnel
and implementing these procedures. The fixed costs
are associated with installing devices and maintaining
the devices for screening procedures. The costs
associated with operating the devices are based on the
expected life and time in the operation of each device,
while the implementation costs of screening
procedures are based on the employee compensation
of security personnel. In addition to these cost
restrictions, each device is manufactured to provide a
maximum throughput capacity. Thus, the expected
number of passengers in each security class aids in
determining the capacity requirements for deploying
existing and new detection devices at each airport.
These decisions are highly influenced by resource
constraints, including cost, personnel, and space
availability, hence the decision as to the type and
number of devices and procedures to use for
screening high-risk and low-risk passengers to
maximize the total security (probability of threat
detection) can be very challenging. This is especially
so when considering a limited number of devices
available to deploy across a set of airports, each with
its own individual resource constraints.
2.3 Multi-Objective Mixed Integer
Program Portfolio Investment
Model
Several assumptions are made when formulating our
mathematical model for this problem.
A passenger pre-screening system (Secure Flight)
is used in a risk-based security screening approach
to quantify the perceived risk of each passenger.
The resulting threat assessment is viewed as an
accurate representation of the passenger’s true
risk to the air transportation system, based on
intelligence gathered by the TSA pertaining to
prior travel history, origin and destination
itinerary, ticket purchase method, current
behavioral attributes, and other security-sensitive
information.
The detection devices used to screen passengers
and their baggage operate independently of one
another, such that the use of one type of device
does not affect the cost or threat detection
performance associated with any other device
under consideration.
There is no cost associated with removing existing
devices from an airport security checkpoint.
In the context of the type of passenger
prescreening system exemplified by Secure Flight,
we want to determine an optimal allocation of threat
detection devices and measures for screening checked
baggage, carry-on baggage, and passengers across a
set of airports so as to (1) maximize risk posture, (2)
minimize the overall false clear rate, and (3)
maximize the number of threats to be detected while
considering passenger threat classification. We
impose constraints on time available at each check
station, flow capacity at security stations, local and
overall budget, as well as staffing needs at each check
station.
The parameters and decision variables used in the
model are summarized as follows.
Parameter Description
T The total number of airports under consideration
k Index for airport k=1, 2,…,T
D The number of screening device types
d Detection device type d=1, 2,…,D
J Number of screening groups (e.g., checked bags,
carry-on bags, passenger ID check, passenger
screening)
j Screening group j = 1,…, J
D(j) Detection devices d within screening group j
M
k
Number of passenger classes at airport k
C Index for passenger class c=1, 2,…,M
k
(e.g., high-
risk, regular, precheck)
A
ck
Average value of perceived risk for passengers
assigned to class c at airport k
B
ck
Number of checked bags per hour screened in
class c at airport k
G
ck
Number of carry-on bags per hour screened in
class c at airport k
H’
ck
Number of passengers (ID) per hour screened in
class c at airport k
H
ck
Number of passengers (body) per hour screened
in class c at airport k
Cj Maximum throughput (passengers or bags/hour)
within screening group j
E
dk
Number of existing devices of security measure
type d at airport k
F
d
Fixed Cost ($/device) associated with device type d
K
dk
The capacity of device d at airport k
I
d
Installation cost ($/device) associated with device
type d
O
d
Operating cost ($/device) associated with device
type d
P
d
Conditional probability of detecting a threat given
there is a threat for device type d
cp
c
Probability of a passenger belonging to passenger
DATA 2024 - 13th International Conference on Data Science, Technology and Applications
108

class c
𝛼
The conditional probability that passenger carries
a threat given they belong to class c carries a
threat
𝛽
The conditional probability that there is a threat
in screening group j given a class c
q
d
Conditional probability of clearing a non-threat
item given there is no threat for device type d
TB
k
Total hourly budget ($) available at airport k
t
d
Time taken to check one passenger or bag at
device d
U
d
Number of device type d available for installation
z
d
Time multiplier to verify any alarm at any device
Decision Variables Description
x
cdk
Binary variable where x
cdk
= 1(0), if security
measure type d is (not), used to screen class c
passenger at airport k
y
dk
Number of security measure type d to be used at
airport k (integer)
s
dk
Number of security measure type d to be installed
at airport k (integer)
The number of devices of type 𝑑 to be installed at
each airport, 𝑠
, Equation (M1), is found by
subtracting the number of devices of type 𝑑 currently
existing from the number of devices of type 𝑑 used in
total at each airport.
𝑠
= 𝑦
−𝐸
Device Installation Constraint
(M1)
provided 𝑦
≥𝐸
(and 0 otherwise), for 𝑑=
1,2, … , 𝐷 and 𝑘=1,2,…,𝑇.
Using the notation provided, the installation,
operating, and total fixed costs at each airport 𝑘 can
be found such that the combined installation,
operating, and fixed costs satisfy the total hourly
budget, 𝑇𝐵
, for airport 𝑘= 1,2,...,𝑇.
For discussion, let {B, G, H’, H} denote the four
screening groups: checked bag, carry-on bag,
passenger ID check, and passenger screening,
respectively. In what follows, we use checked bag,
group B, as an example.
We next consider the number of new devices (for
each screening group) to be installed at each airport,
𝑦
()
, Equation (M2). This relies on the capacity
performance of the screening devices, captured by the
number of checked bags (screening group B) each
device type can handle per hour, 𝐶
, and the number
of bags screened in each class within a particular
airport, 𝐵
. Dividing the hourly rate of bags screened
in class c at airport k by the maximum throughput of
device type 𝑑 yields the number of security devices
of type 𝑑=1,2,…,𝐷 necessary to screen all checked
bags using this particular device,
𝑦
(
)
=
𝐵
𝑥
/𝐶
𝑑=1,2,…,𝐷,
𝑘=1,2,…,𝑇
(M2)
(
Resource Capacity Constraint
)
Lastly, Constraint (M3) reflects device resource
availability, namely the number of new devices
installed at all airports must be less than or equal to
the total number of new devices available.
𝑠
≤𝑈
, ∀𝑑=1,2,…,𝐷 (M3)
(
Resource Availability Constraint
)
We next model the expectation of false alarms,
time logistics and staffing needs at each check station
within each screening group.
(
1 −𝛼
)
𝑐𝑝
1 −
∈()
𝑞
𝑥
≤𝛿 𝑘
=1,2,…,𝑇
(
M4
)
𝐻′
𝑐𝑝
∈
(
)
𝑥
×
⎝
⎜
⎜
⎜
⎛
1+𝑧
⎝
⎜
⎜
⎛
𝑝
𝛽
𝛼
𝑐𝑝
+
(
1 −𝑞
)
(
1 −𝛼
)
𝑐𝑝
⎠
⎟
⎟
⎞
⎠
⎟
⎟
⎟
⎞
𝑡
≤𝐶
∈
(
)
𝐾
𝑘=1,2,…,𝑇
(
M5
)
𝐵
𝑐𝑝
∈
(
)
𝑥
×
⎝
⎜
⎜
⎜
⎛
1+𝑧
⎝
⎜
⎜
⎛
𝑝
𝛽
𝛼
𝑐𝑝
+
(
1 −𝑞
)
(
1 −𝛼
)
𝑐𝑝
⎠
⎟
⎟
⎞
⎠
⎟
⎟
⎟
⎞
𝑡
≤𝐶
∈
(
)
𝐾
𝑘=1,2,…,𝑇
(
M6
)
𝐺
𝑐𝑝
∈
(
)
𝑥
×
⎝
⎜
⎜
⎜
⎛
1+𝑧
⎝
⎜
⎜
⎛
𝑝
𝛽
𝛼
𝑐𝑝
+
(
1 −𝑞
)
(
1 −𝛼
)
𝑐𝑝
⎠
⎟
⎟
⎞
⎠
⎟
⎟
⎟
⎞
𝑡
≤𝐶
∈
(
)
𝐾
𝑘=1,2,…,𝑇
(
M7
)
𝐻
𝑐𝑝
∈
(
)
𝑥
×
⎝
⎜
⎜
⎜
⎛
1+𝑧
⎝
⎜
⎜
⎛
𝑝
𝛽
𝛼
𝑐𝑝
+
(
1 −𝑞
)
(
1 −𝛼
)
𝑐𝑝
⎠
⎟
⎟
⎞
⎠
⎟
⎟
⎟
⎞
𝑡
≤𝐶
∈
(
)
𝐾
𝑘=1,2,…,𝑇
(
M8
)
Risk-Stratified Multi-Objective Resource Allocation for Optimal Aviation Security
109

Here, Constraint (M4) ensures that the false alarm
probability is within the upper bound, 𝛿, set by the
appropriate security authority. Constraints (M5) –
(M8) guarantee that checking of baggage or
passengers at each screening group is completed
within the allotted time.
Both false alarms and false clears at airport
screening can pose significant challenges and risks,
but they have different implications. While false
alarms take up unnecessary resources, slow down
airport operations, and lead to delays, inconvenience
and stress for travellers, false clears typically are
considered more serious as they can potentially allow
dangerous items or individuals to bypass security
measures, compromising safety. Our model
emphasizes on maximizing safety. The objective
function, Equation (OBJ2), describes the probability
of false clear across each airport.
𝑐𝑝
𝛼
𝛽
∈()
(
1 −𝑝
)
𝑥
∀𝑘∈𝑇 (𝐎𝐁𝐉𝟐)
Equation (M9) formulates the probability of
detecting a threat within security class 𝑐 at airport 𝑘,
𝐿
, and is calculated as the probability that at least
one of the device types used in that class detects the
threat correctly.
𝐿
(
)
=1−
∏
∈
(
)
(
1 −𝑃
)
𝑥
(M9)
∀ 𝑐=1,2,…,𝑀
, 𝑘=1,2,…,𝑇, 𝑗∈
{
𝐵, 𝐺, 𝐻
, 𝐻
}
The risk level of each class, 𝑅
, is defined as the
average perceived risk value of the passengers in
security class 𝑐 at airport 𝑘 times the rate of baggage
/ passenger screened within that class. This value is
normalized between zero and one by dividing over
the total risk associated with all security classes
within airport 𝑘 , as shown in Equation (M10):
𝑅
()
=
𝐴
𝐵
∑
𝐴
𝐵
(
M10
)
The risk level of each security class relies heavily
on the assumption that the prescreening system
provides an accurate (estimation of) risk perception
of the passenger population.
The threat detection objective function for the
allocation model is obtained by weighting each
airport by the rate at which passengers/checked
bags/carry-on bags must be screened at that airport
and the risk level associated with screening these
groups using either new or existing detection devices.
Using Equations (M9) and (M10), the objective
function value at each airport for checked bag
screening is defined as the expected number of
detected threats in Equation (M11),
𝑆𝐿
()
=
𝐿
()
𝐵
𝑅
()
(
M11
)
By summing over all the screening groups and
airports under consideration, the total security level
captures the expected total number of detected
threats, as given by Equation (OBJ3):
∑
𝑆𝐿
=
∑
∑
𝑆𝐿
()
=
∑∑
𝐿
(
)
𝐻′
𝑅
(
)
+ 𝐿
()
𝐵
𝑅
()
+
𝐿
()
𝐺
𝑅
()
+𝐿
()
𝐻
𝑅
()
.
(
𝐎𝐁𝐉𝟑
)
Combining the three objectives Equations
(OBJ1), (OBJ2), and (OBJ3), the security measure
allocation problem for multiple airports can be
formulated as a nonlinear multi-objective integer
program.
Nonlinear Multi-Objective Portfolio Optimization
for Security Measures Allocation
Maximize
𝑥
𝑝
× 𝑅𝐼𝑉
𝑘=1,2,…,𝑇 (𝐎𝐁𝐉𝟏)
−
𝑐𝑝
𝛼
𝛽
∈
(
)
(
1 −𝑝
)
𝑥
𝑘
=1,2,…,𝑇 (𝐎𝐁𝐉𝟐)
𝑆𝐿
𝑥
𝑘=1,2,…,𝑇 (𝐎𝐁𝐉𝟑)
Subject to
𝑠
≥𝑦
−𝐸
, 𝑑=1,2,…,𝐷, 𝑘=1,2,…,𝑇
(M1)
𝑦
=
𝑗
𝑥
/𝐶
, 𝑑=1,2,…,𝐷
(
𝑗
)
,
𝑗∈
{
𝐵, 𝐺, 𝐻
, 𝐻
}
, 𝑘=1,2,…,𝑇 (M2)
𝑠
≤𝑈
𝑑=1,2,…,𝐷. (M3)
(
1 −𝛼
)
𝑐𝑝
1 −
∈
(
)
𝑞
𝑥
≤𝛿
𝑘=1,2,…,𝑇 (M4)
DATA 2024 - 13th International Conference on Data Science, Technology and Applications
110

𝑗
𝑐𝑝
∈
(
)
𝑥
×
⎝
⎜
⎜
⎜
⎛
1+𝑧
⎝
⎜
⎜
⎛
𝑝
𝛽
𝛼
𝑐𝑝
+
(
1 −𝑞
)
(
1 −𝛼
)
𝑐𝑝
⎠
⎟
⎟
⎞
⎠
⎟
⎟
⎟
⎞
𝑡
≤𝐶
∈
(
)
𝐾
, 𝑗∈
{
𝐵, 𝐺, 𝐻
, 𝐻
}
, 𝑘=1,2,…,𝑇
(
M5
)
−(M8)
(
𝑦
𝐹
+ 𝑠
𝐼
)
+
𝑥
𝑂
𝐵
≤𝑇𝐵
,
𝑘=1,2,…,𝑇 (M12)
𝑥
∈{0,1}, 𝑦
∈𝑍
, 𝑠
∈𝑍
Constraint (M1) is the device installation
constraint, and Constraint (M2) reflects the resource
capacity based on the screening rates for each of the
four screening groups. Constraint (M3) models the
overall resource availability. Constraint (M4) ensures
that the false alarm probability is within an upper
bound, 𝛿, set by the appropriate security authority.
Constraints (M5) - (M8) guarantee that screening for
each group at each station is completed within the
allotted time. Constraint (M12) describes the budget
at each airport.
The resulting integer program is nonlinear due to
the product of the 𝑥
decision variables contained
in the false alarm constraint in (M4), and in the threat
detection term, 𝐿
, in (M9). Constraint (M3)
effectively ties together the decision variables across
all airports, potentially impacting the ability to
decouple the problem and solve for each individual
airport.
2.4 Computational Challenges
Computationally, the formulated nonlinear MIP
instance (with 45,760 decision variables and 35,666
constraints) is intractable by existing commercial or
research solvers. To linearize the risk structures, a
decomposition is necessary. Dantzig-Wolfe
decomposition can be applied to reduce the original
decision variables to a single composite binary
decision variable representing whether or not a
specific security measure combination for the threat
classes at airport 𝑘 is applied. This changes the
problem structure and looks at a full enumerated
security measure combination list for all 440 airports.
There are 1,048,576 possible security measure
combinations for two classes of passengers and 26
security measures. The resulting decomposed model
has 461,373,440 binary and integer decision variables
and 466 constraints.
We apply sensible and knowledge-based
preprocessing to reduce the number of decision
variables to 128,480,000. Decomposition increases
the number of decision variables, but drastically
decreases the number of constraints, hence reducing
the size of the Simplex basis. However, the model
remains intractable. We derive fast heuristics to
obtain near-optimal solutions that offer the best set of
security measures (with respect to the objectives) for
each airport.
2.4.1 Optimization Strategies
Numerous studies have been conducted to compare
and contrast various optimization approaches for
solving multi-objective models. Sawik provides a
comprehensive analysis of weighting, lexicographic,
and reference point approaches to multi-objective
portfolio optimization (Sawik, 2011). A hierarchical
or lexicographic approach assigns a priority to each
objective and optimizes the objectives in decreasing
priority order. At each step, the best solution is found
for the current objective, but only from the solutions
that do not degrade the solution quality for higher-
priority objectives. Lexicographic optimization
generates efficient solutions by sequential
optimization of the objectives. For our
implementation, we normalize the three objectives
into comparable values and weigh them equally for
unbiased analyses.
Multi-Swarm Particle Swarm Optimization
Particle swarm optimization (PSO) is a fast heuristics
that works by having a population of candidate
solutions (particles) and moving the particles around
in the search space based on the particles’ position
and velocity.
The PSO is initialized with a group of random
particles (mixed-integer variable solutions). The
algorithm searches for optima by updating the
generations of particles. In each iteration, the particles
are updated by two “best” values. First, the algorithm
records the best solution (fitness, objective function
value) achieved by the particle thus far. The objective
value is stored as p
best
. Second, the algorithm also
records the best value obtained thus far by any
particle in the population, known as the global best
and stored as g
best
. When a particle takes part of the
population as its topological neighbors, the best value
is a local best and is denoted by l
best
. The formulation
of the swarm is determined by the specific problem,
and in this study, each particle represents a complete
Risk-Stratified Multi-Objective Resource Allocation for Optimal Aviation Security
111

set of portfolio (a set of security measures) selected
for all the airports. Therefore, each particle of a
swarm (denoted by index i) must include the decision
variables r
ikj
=1(0) denoting if security measure
combination portfolio j is (not) selected for airport k,
and z
idk
∈𝑍
denoting the quantity of each security
measure assigned to airport k.
After finding the two best values, the particle
updates its velocity and position according to
Equations (P1) to (P3). Here 𝜔
and 𝜔
denote
uniform random numbers between 0 and 1. t denotes
the iteration number while 𝑣𝑧
denotes the velocity
of variable z within particle i, and 𝑣𝑟
denotes the
velocity of variable r within particle i. 𝑣𝑧
will be
updated if security measure d is selected by the
portfolio of security measures within particle i at
iteration t+1. Thus, particle i moves at iteration t+1
as follows:
𝑣𝑟
= 𝑣𝑟
+ 𝑐
𝜔
𝑟
−𝑟
+ 𝑐
𝜔
𝑟
−𝑟
(P1)
𝑟
= 𝑟𝑜𝑢𝑛𝑑
−𝛼
, 𝑤ℎ𝑒𝑟𝑒 𝜃= 𝑟
+
𝑣𝑟
𝑎𝑛𝑑 𝛼 is set to 0.06 (P2)
𝑣𝑧
= 𝑣𝑧
+ 𝑐
𝜔
𝑧
−𝑧
+𝑐
𝜔
𝑧
−𝑧
𝑖𝑓 𝑟
=1
𝑣𝑧
= 𝑣𝑧
𝑜𝑡ℎ𝑒𝑟𝑤𝑖𝑠𝑒 (P3)
For a given particle, if the velocity on the
dimension r
is zero, this particle will not move in
that dimension at iteration 𝑡+1. Suppose 𝑣𝑟
=0
and r
=0, hence 1/
(
1+𝑒
)
=0.5 and round(0.5)
= 1, which means that particle i will move in
dimension 𝑟
𝑟
=1 at iteration t+1. To avoid
such an unwanted move, we can use 𝛼, as seen in
Equation (P2).
The search terminates when stop criteria are
satisfied: when the maximum number of iterations
has been reached, or the minimum error condition is
satisfied. An advantage of PSO is that not many
parameters require tuning. The number of particles
(solutions to record) is in the range of 20 to 40; while
difficult problems may require 100 – 200. In our
instances, the dimension of the particles (dimension
of solution set) is prohibitively large, requiring us to
keep the number of particles to a minimum size. The
range of particles is determined by the upper and
lower bounds of the decision variables. v
max
determines the maximum change one particle can
take during one iteration. We require two v
max
due to
the presence of both binary and integer variables.
The multi-swarm PSO (MSPSO) modification is
a more recent popular approach (Pluhacek, 2016). In
the multi-swarm approach, the population is divided
into multiple sub-populations (sub-swarms) with
different levels of communication. The benefit of this
approach is that the population can maintain
divergence, search for multiple promising regions,
and partially converge to multiple optima. In (García-
Nieto and Alba, 2012), the optimal swarm (sub-
swarm) size is discussed in great detail. It is proposed
that six particles per swarm might be the optimal
number for PSO-based algorithms. Pluhacek
demonstrates that the multi-swarm performance was
superior to the single swarm PSO in all cases
(Pluhacek, 2016). We decide to utilize a multi-swarm
PSO, with five sub-swarms, and varying particle sizes
from 5 to 10 particles per swarm. The control
parameters are set as follows:
Population Size: {5,6,7,8,9,10}
Iterations: 5
v
initial
: 10% of the position
w
max
: 0.9
w
min
: 0.4
c
1
, c
2
= 1.49445 (learning factors)
The multi-swarm PSO is based on the local
version of PSO with a new neighborhood topology.
Many existing evolutionary algorithms require large
populations, while PSO needs a comparatively
smaller population size. A population with three to
five particles can achieve satisfactory results for
simple problems. According to many reported results,
PSO with small neighborhoods performs better on
complex problems. Hence, to slow down
convergence speed and increase diversity to achieve
better results on multimodal problems, in the
MSPSO, small neighborhoods are used. The
population is divided into small-sized swarms. Each
sub-swarm uses its own members to search for better
regions in the search space.
The multi-swarm optimization algorithm works
as follows:
Input: MOP (1)
Swarm_size: number of the swarm particles
No_subswarms: number of subswarms
Step 1: Calculate Subswarm size=
Swarm_size/No_subswarms
Step 2: For subswarm = 1 to No_subswarms do
For t=1 to Max_iterations do
Apply PSO algorithm
Update leaders archive
Update external archive
End For
Return final result in the external archive
Append the result to the results file
End For
DATA 2024 - 13th International Conference on Data Science, Technology and Applications
112

Ad-Hoc Heuristics Approaches
For comparison, we apply column generation and
additional solutions techniques to contrast solution
speed and quality. To expedite the column generation
method, we consider breaking apart the domain to
accommodate a large number of options. This
separation inspires two heuristics briefly described
below.
Heuristic 1: The full set of portfolio options are
randomized, and broken into buckets of 250
combinations each. The associated set is optimized
across all 440 airports. This allows for rapid solution
time as we can massively run all these column
generation subproblems. Not all fidelity is lost since
we maintain all 440 airports in each subproblem and
keep quantity assignment variables intact.
Heuristic 2: Portfolios are again randomized and
separated into buckets, and this time, along with the
airports as well. Each subproblem then represents a
subset of both the airports and the possible portfolio
combinations.
In both randomized heuristics, optimization is
performed at every iteration. The selected
combinations (not the quantities of security
measures) are placed into a pool of optimal
combinations. The pool of portfolios is then used in
a final optimization to construct a complete solution.
3 COMPUTATIONAL ANALYSES
3.1 Data for Modeling
Data were collected from aviation articles that
presented strong models (McLay et al., 2006; Nie et
al., 2009; Poole & Passantino, 2003; Sewell et al.,
2012, 2013; Virta et al., 2003). With the assistance of
our TSA collaborators, the fixed and installation costs
are determined through the expected useful life of the
device and on the amount of time the device would
spend in operation over one year. These values reflect
the yearly cost (in US dollars) divided by the total
number of hours spent in operation over the year,
based on a peak 6 hours of operation per day, per
device.
Passengers are assigned to a two-class system
based on perceived risk information generated
through the Secure Flight a prescreening system. This
classifies passengers as being either high-risk or low-
risk, where the majority of passengers constitute the
latter group. In the computational analysis reported
herein, 85% of passengers are deemed low-risk and
assigned to Class 1, while the remaining 15% of
passengers are assigned to the high risk security Class
2.
The total number of passenger enplanements
reflects the actual enplanement data from 2016-2019
collected from faa.gov (Transportation, n.d.). The
hourly airport budget is based on an estimated annual
budget value to be distributed across all airports.
Individual airport budgets are simply distributed
based on the proportion of passengers with a set
minimum value. The total number of passengers
screened per hour at an airport is based on the average
airport being operational 365 days a year and having
16 regular working hours per day. The operating cost
of each security screening device or method is based
on the annual operating cost of that device/method
divided by the average hourly passenger screening
rate. The maximum and minimum hourly screening
rates per device are pulled from actual manufacturer
device specifications. Lastly, the perceived risk
values are generated from a normal distribution with
mean 0.26 and standard deviation 0.12 for the low-
risk passengers assigned to Class 1, and with mean
0.55 and standard deviation 0.12 for the high-risk
passengers assigned to Class 2.
Combinations of all possible subsets of device
types are generated for evaluation. The combinations
of the security measures are grouped by screening
group and are estimated by assuming which security
measures should always be constant and which are
optional. For example, as seen in Table 3 below, for
the checked baggage screening, it was assumed that
all checked bags are screened by a CT scanner with
additional screening performed by hand search.
Therefore, all combinations must have both methods
employed. Canine units and Explosive Trace
Detection are both treated as secondary screening
measures since they are not typically a primary line
of defense at any airport, and there is no way to
provide support to all airports. Based on this
information, there are then four possible
combinations of checked baggage security measures
that can be employed. This same approach was
conducted for all screening measure groups.
Table 3: Example of Security Measure Combination
Restriction.
A potential combination of device types is chosen
from these 1024 possible configurations for each
passenger class for every airport, where each airport
may have a different combination from any other
Disruption Rate 1-DR Security Measure 1234
SM1 50% 50% Hand Search 1111
SM2 80% 20% Canine Unit (unit consists of two to four teams, 1 handler/2 Dogs per team)0011
SM3 70% 30% Explosive Trace Detection (open bag trace) 0101
SM4 80% 20% Computed Tomography (CT) Scan (Electronic Detection System) 1111
Risk-Stratified Multi-Objective Resource Allocation for Optimal Aviation Security
113
airport. We obtain the number of device types used at
each airport by dividing the hourly rate of passengers
screened at that airport by the device hourly
throughput rate.
3.2 Results
The nonlinear mixed integer programs were
generated in Python 3.7.3 using the gurobipy module
and solved with Gurobi 9.0. The Gurobi parameters
were kept at their default values, apart from turning
the pre-solve option off so that Gurobi would spend
less time expanding the node structure.
The data for all independent scenario instances
remained consistent and incorporated all 440 airports.
1024
different combinations were produced, based
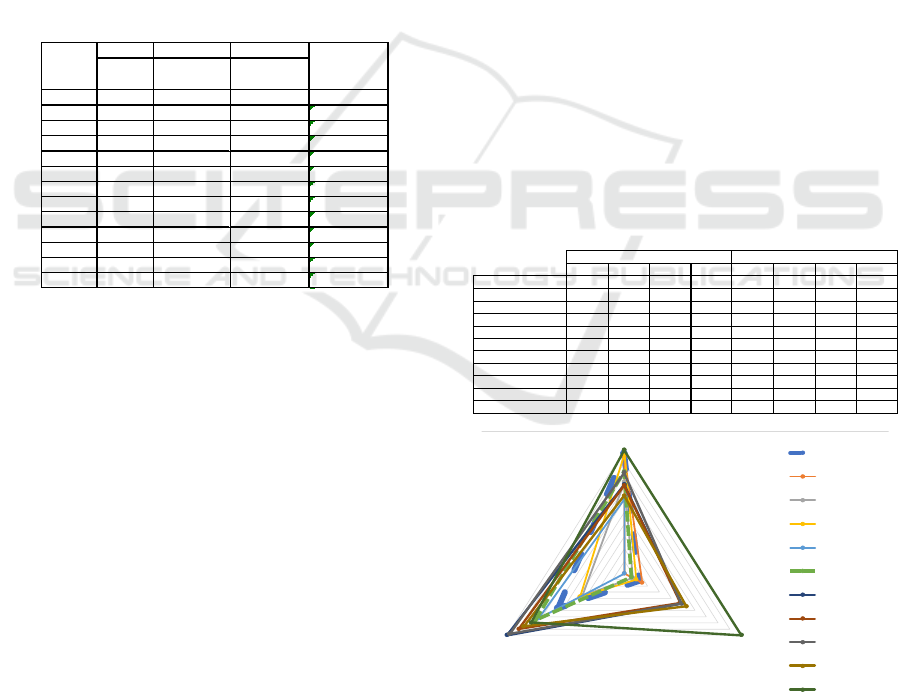
on the security measures available. Table 4 shows an
example output.
Table 4: A Snapshot of one solution output for each airport.
The model allows scenario-based risk assessment and
evaluation analyses which will be discussed in detail
in a future paper. Herein, we report briefly the
computational results obtained from 11 solution
methods.
Model 1: Multi-Swarm PSO – 5 particles
Model 2: Multi-Swarm PSO – 6 particles
Model 3: Multi-Swarm PSO – 7 particles
Model 4: Multi-Swarm PSO – 8 particles
Model 5: Multi-Swarm PSO – 9 particles
Model 6: Multi-Swarm PSO – 10 particles
Model 7: Combined Solution MSPSO
Model 8: Heuristic 1
Model 9: Heuristic 2
Model 10: Column Generation Pricing with
Multi-Swarm PSO
Model 11: Column Generation Branch-and-Price
Exact Algorithm
Table 5 presents the computational results for theses
11 different model formulations and solution
strategies. For comparison, we use equally-weighted
outputs after normalizing the objectives into a scalar
to improve the ability to compare values. The first six
are multi-swarm PSO results with varying population
size. The first four columns display the equally-
weighted multi-objective results. Population size
does not appear to be significant for running the
MSPSO algorithm. In fact, more particles do not
guarantee better results. Heuristic 1 and Heuristic 2
are the ad-hoc greedy heuristics. The Combined
MSPSO took all the portfolio results from each of the
MSPSOs and solved the optimization problem based
on all the options. The CG Price MSPSO model took
the column generation construct but solvedd the
pricing problem using the MSPSO instead of having
to solve the individual subproblems for each airport.
CG Final is the full column generation solution using
the standard column generation algorithm and applied
to the Dantzig decomposition to achieve the optimal
solution. Since these are heuristic results, they may
not lie on the Pareto efficient frontiers. CG Final
result (a non-dominated solution) provides the best
overall results, since the instance is solved to
optimality. The MSPSO solutions tend to bias
towards Obj1, while Combined MSPSO improves the
solution with good scores for both Obj1 and Obj3.
The two ad-hoc heuristics offer excellent scores for
Obj3 with reasonable Obj1.
Table 5: Summarized Model Results.
Figure 2: Triangle Radar Plot, Performance Metric
Comparison.
The triangle radar plot in Figure 2 displays the
normalized results. If the model line reaches 1, then
Obj 1 Obj 2 Obj 3
Max Risk
Posture
Min Prob
False Clear
Max Threat
Detection
Overall 87207.61 -436.8090570 236837341.60 236924112.40
1 277.05 -0.9889654 25013040.24 25013316.30
2 277.05 -0.9889654 14250702.99 14250979.05
3 277.05 -0.9889654 15596221.45 15596497.51
4 277.05 -0.9889654 9096180.76 9096456.83
5 277.05 -0.9889654 11182118.68 11182394.74
6 277.05 -0.9889654 9215989.36 9216265.43
7 277.05 -0.9889654 9869503.37 9869779.44
8 277.05 -0.9889654 5863353.98 5863630.05
9 277.05 -0.9889654 6824083.49 6824359.55
10 277.05 -0.9889654 8128292.47 8128568.54
11 277.05 -0.9889654 7196422.29 7196698.35
12 277.05 -0.9889654 7419652.11 7419928.18
Airports Overall
Obj 1 Obj 2 Obj 3 Total Obj 1 Obj 2 Obj 3 Total
MSPSO 5 0.792 0.121 0.533 1.446 0.968 0.123 0.565 1.657
MSPSO 6 0.777 0.150 0.257 1.184 0.949 0.153 0.0 1.102
MSPSO 7 0.620 0.070 0.432 1.122 0.743 0.071 0.358 1.171
MSPSO 8 0.793 0.098 0.441 1.332 0.970 0.100 0.376 1.446
MSPSO 9 0.513 0.001 0.614 1.128 0.602 0.0 0.730 1.333
MSPSO 10 0.684 0.059 0.628 1.370 0.826 0.060 0.758 1.644
Combined MSPSO 0.676 0.475 0.734 1.885 0.816 0.485 0.976 2.278
Heuristic 1 0.603 0.480 0.746 1.828 0.720 0.490 1.0 2.210
Heuristic 2 0.598 0.467 0.696 1.761 0.713 0.477 0.898 2.089
CG Price MSPSO 0.535 0.519 0.675 1.729 0.631 0.531 0.855 2.016
CG Final 0.816 0.978 0.645 2.439 1.0 1.0 0.793 2.793
Normalized Model ResultsModel Results
Obj 1
Obj 2Obj 3
PSO 5
PSO 6
PSO 7
PSO 8
PSO 9
PSO 10
H1
H2
Combine PSO Final
CG Price PSO
CG Final
DATA 2024 - 13th International Conference on Data Science, Technology and Applications
114

the objective has reached the maximum value
amongst the various models. If a line is barely
registering (achieving very low value), then the
objective value result is basically inconsequential in
comparison.These scenarios allow us to observe how
security measure allocations differ when varying the
number of inputs into the overall model. This
technique gives us insight into determining if it is
beneficial to dedicate the time to find an optimal
solution. The PSO methods take the least amount of
time, and if the solutions are potentially just as strong,
then it is possible that they can be utilized regularly.
The decision-makers are also able to witness multiple
options and consider what results remain consistent
throughout the runs or what results change drastically
depending on the model.
3.3 Summary of Findings
The classical portfolio optimization model uses the
variance as the risk measure and relies on the
covariance matrix. Without reliable estimates for the
covariance/correlation, we utilize network topology
analysis techniques to make a pseudo correlation
matrix. We construct and introduce a network of
interdependent risk factors that can be represented by
a weighted adjacency matrix. This matrix is then
combined with the topological overlap matrix, a
similarity measure construct that allows us to define
and quantify the topological and interdependent
relationships between the security measures and the
risk factors.
As a means to integrate the risk factors and
security measures that are put in place by TSA, we
introduce the term “Risk Posture” and a method to
calculate it. Risk Posture is calculated based on the
optimal security measure portfolios selected and their
interdependent relationship with the TSA risk
taxonomy. With Risk Posture, we maximize the
resilience of the system so that no matter the risk,
TSA/the country should be able to face it. There are
no standard Risk Posture calculations, and the term
has been associated with Cyber-security readiness
(since 2018). Our goal is to maximize the overall
improvement in risk posture by minimizing risk.
Nearly all security measures have been addressed
in small groupings in previous research over the past
20 years, but none all together in a single enterprise
risk optimization model. Stewart and Mueller
(Stewart & Mueller, 2017) are the only publication/s
that include all security measures, though no
mathematical analyses and tradeoffs have been
performed. No prior optimization model has
attempted to incorporate multiple screening areas into
a single model. Our work is the first to incorporate
Stewart and Mueller’s (Stewart & Mueller, 2017)
reliability construct to include Checked baggage,
Carry-on baggage, and Passenger screening. ERM
portfolio optimization models are typically tied to the
Insurance and Finance industries and follow a very
traditional modeling approach (Al-Qudah, 2023;
Oliva, 2016; Olson & Wu, 2010; Soliman & Adam,
2017). There is currently no ERM portfolio
optimization model in aviation security measures.
Our model is comprehensive in which previous
Sewell’s SADM and Nie’s operational models are
sub-models within our global ERM-based model.
The output of the model allocates available
security measures/screening devices across airports
nationwide to
Maximize the risk posture of the TSA (threat
detection capability concerning the
interdependent network of TSA risk elements)
Minimize the probability of false clears
Maximize the total security level (probability
of threat detection)
4 CONCLUSIONS
This paper offers a pioneering approach to optimizing
enterprise risk management (ERM) in aviation
security through a comprehensive multi−objective
portfolio investment model. By integrating various
aviation transportation risks and modeling their
interdependencies, the ERM-based model provides a
robust framework for allocating security measures
efficiently across the U.S. aviation sector. The
model’s strength lies in its ability to correlate
resource allocation with risk mitigation, maximizing
risk posture while minimizing false clears and
enhancing threat detection rates.
The comprehensive ERM-based resource
allocation model expands upon previous research and
combines all previous models into a single multi-
objective portfolio investment optimization model
framework. We utilize the concept of topological
overlap network to establish interdependencies
among the various aviation transportation risks. We
also introduce Risk Posture, capturing the cascading
and inter-dependency of the multi-tier risk taxonomy
and overlaying security measures, to quantify the
TSA’s resilience and capabilities against any
potential risks. The biggest knowledge gap in
previous research is that any type of optimization
model concerning enterprise risk management was
performed only at an operational level. This work
represents the first model that encompasses a full
Risk-Stratified Multi-Objective Resource Allocation for Optimal Aviation Security
115

multi-tier enterprise risk management approach
across strategic, tactical, and operational levels. It is
also the first model to establish and concentrate on
risk posture. The security measure and device
allocation problem, combined with a passenger risk
assessment policy, can be used to structure a risk-
based screening strategy to use limited screening
resources effectively. The model is generalizable and
can accommodate additional / different measures,
new technology, or new airport setups.
This paper presents a practical solution
methodology for solving the security screening
device allocation model across multiple airports.
Given budget constraints, including the installation,
operation, and fixed costs associated with screening
devices and procedures at airport checkpoints, the
ERM-based model facilitates the allocation of new
devices and procedures across airports nationwide to
maximize the total security level over all the airports
under consideration. To accomplish this, we compute
a risk factor for security classes using either the new
or existing detection devices, based on the hourly
throughput rate of each of the device types and the
perceived risk of the passengers. The passenger risk
is obtained using a prescreening system and allows
security operations to partition passengers into high
or low-risk categories for undergoing higher or lower
intensity screening.
We present a Dantzig-Wolfe decomposition
approach to tackle the resulting nonlinear intractable
instances, where optimal solutions are shown to be
obtained in several seconds through multiple
computational examples. The fast solution engines
and interpretable results ensure scalability and
adaptability of the proposed framework to other
contexts beyond aviation security.
The findings have significant implications for
policy and practice, particularly in enhancing aviation
security in a post−9/11 landscape. By demonstrating
a quantifiable improvement in risk management
through strategic resource allocation, this work adds
new and critical knowledge to the field of risk
assessment and optimization in aviation security.
Future research will be conducted to expand on this
foundation to explore adaptive strategies in response
to evolving security threats and the integration of
real−time data analytics for dynamic risk assessment.
In Leonard and Lee (2020), we applied this
quantitative ERM-based framework for optimizing
security measure investments to achieve the most
cost-effective deterrence and detection capabilities
for the U.S. Customs and Border Patrol (CBP).
We modeled the CBP ERM in 3 tiers: satellites
monitoring the geographic area of the border;
High Altitude Long Endurance drones with high-fuel
capacity for extended surveillance; and the ground
layer of a variety of security surveillance systems
and manned outposts. Under physical / cyber /
resource / logistics constraints, the ERM-based
model optimizes the allocation of limited
quantities of deterrence and detection security
measures across the entire southern continental
U.S. border so as to (1) maximize the total utility
of the measures utilized, (2) maximize the
probability of deterrence and/or detection, and (3)
minimize cost.
The CBP work introduces the concept of utility
for each security measure as a means to rate its
impact, and incorporates the probability of success,
along with multiple objectives. To the best of our
knowledge, our work presents the first
mathematical model that optimizes security
strategies for the CBP and is the first to introduce
a utility factor to emphasize deterrence and
detection impact. It also offers insights into the
broader applicability of our ERM-based
computational framework.
ACKNOWLEDGEMENTS
This material is based upon work supported by the
U.S. Department of Homeland Security under Grant
Award Number 17STQAC00001-01. The views and
conclusions contained in this document are those of
the authors and should not be interpreted as
necessarily representing the official policies, either
expressed or implied, of the U.S. Department of
Homeland Security. The authors thank the
anonymous reviewers for their insightful comments.
REFERENCES
Agliari, E., Barra, A., Galluzzi, A., Guerra, F., Tantari, D.,
& Tavani, F. (2015). Retrieval capabilities of
hierarchical networks: from Dyson to Hopfield.
Physical review letters, 114, 028103.
Agliari, E., Barra, A., Galluzzi, A., Guerra, F., Tantari, D.,
& Tavani, F. (2015). Topological properties of
hierarchical networks. Physical Review E, 91, 062807.
Al-Qudah, L. A. (2023). The Mediating Role of Corporate
Governance in the Relationship between the Enterprise
Risk Management (ERM) Model and Reducing
Business Risks in Jordanian Commercial Banks. Jordan
Journal of Business Administration, 19(3).
Babu, V. L., Batta, R., & Lin, L. (2006). Passenger
grouping under constant threat probability in an airport
DATA 2024 - 13th International Conference on Data Science, Technology and Applications
116

security system. European Journal of Operational
Research, 168, 633644.
Cura, T. (2009). Particle swarm optimization approach to
portfolio optimization. Nonlinear analysis: Real world
applications, 10, 2396-2406.
Council, N. R., & others. (2010). Review of the Department
of Homeland Security's approach to risk analysis.
National Academies Press.
Emerging Technology. (n.d.). Retrieved from https://www
.tsa.gov/travel/security-screening/emerging-technology
Fletcher, K. C. (2011). Aviation Security: A Case for Risk
Based Passenger Screening. Master's thesis, Monterey,
California. Naval Postgraduate School.
Fletcher, K. C., & Abbas, A. E. (2018). A Value Measure
for Public Sector Enterprise Risk Management: A TSA
Case Study. Risk Analysis, 38, 9911008.
Garcia Nieto, J., & Alba, E. (2012). Why six informants is
optimal in PSO. Proceedings of the 14th annual conf.
on Genetic and evolutionary computation, (pp. 2532).
Gounaris, C. E., Rajendran, K., Kevrekidis, I. G., &
Floudas, C. A. (2016). Designing networks: A Mixed‐
Integer Linear Optimization Approach. Networks,
68(4), 283-301.
Kean, T. H., Hamilton, L., Ben-Veniste, B., Kerrey, B.,
Fielding, F. F., Lehman, J. F., Gorelock, J.S., Roemer,
T. J., Gorton, S., & Thompson, J.R. (2004). The 9/11
Commission: Final report of the National Commission
on Terrorist Attacks upon the United States.
Harrisonburg, VA: R.R. Donnelley.
Kos, M., Mikac, M., & Mikac, D. (2002). Topological
Planning of Communication Networks. Journal of
Information and Organizational Sciences, 26, 5768.:
Leonard, T., & Lee, E. K. (2020). US-Mexico Border:
Building a Smarter Wall through Strategic Security
Measure Allocation. Journal of Strategic Innovation
and Sustainability, 15(1): 156-182.
McLay, L. A., Jacobson, S. H., & Kobza, J. E. (2006). A
multilevel passenger screening problem for aviation
security. Naval Research Logistics (NRL), 53, 183-197.
McLay, L. A. (2011). Risk Based Resource Allocation
Models for Aviation Security. In
Safety and Risk Modeling and Its Applications (pp. 243-
261). Springer.
Minsky, S. (2013, March 07). TSA adopts Enterprise Risk
Management. Retrieved from https://www.logicmana
ger.com/resources/general/tsa-adopts-erm-residual-risk/
Nie, X., Batta, R., Drury, C. G., & Lin, L. (2009). Passenger
grouping with risk levels in an airport security system.
European Journal of Operational Research, 194, 574-
584.
Oliva, F. L. (2016). A maturity model for enterprise risk
management. International Journal of Production
Economics, 173.
Olson, D. L., & Wu, D. (2010). Enterprise risk management
models. In Enterprise Risk Management Models.
https://doi.org/10.1007/978-3-642-11474-8
Pluhacek, M., Senkerik, R., Viktorin, A., & Zelinka, I.
(2018). Single swarm and simple Multiswarm PSO
comparison. Proceedings of The 9th EUROSIM
Congress on Modelling and Simulation, EUROSIM
2016, The 57th SIMS Conference on Simulation and
Modelling SIMS 2016, (pp. 556-560).
Poole, R. W., & Passantino, G. M. (2003). Risk based
Airport Security Policy. Tech. rep., Reason Public
Policy Institute Los Angeles, CA.
Rai, A., & Modiano, E. (2019, May). Topology Discovery
Using Path Interference. In 2019 IFIP Networking
Conference (IFIP Networking) (pp. 1-2). IEEE.
Ravasz, E., Somera, A. L., Mongru, D. A., Oltvai, Z. N., &
Barabási, A. L. (2002, 8). Hierarchical organization of
modularity in metabolic networks. Science (New York,
N.Y.), 297. doi:10.1126/science.1073374
Sawik, B. (2011). Multiobjective Portfolio Optimization by
Mixed Integer Programming. Ph.D. dissertation, AGH
University of Science and Technology.
Sewell, E. C., Attagara, J., Kobza, J. E., & Jacobson, S. H.
(2012). Allocating Explosive Screening Devices for
Aviation Security. Journal of Transportation Security,
141-155.
Sewell, E. C., Lee, A. J., & Jacobson, S. H. (2013). Optimal
allocation of aviation security screening devices.
Journal of Transportation Security, 6, 103-116.
doi:10.1007/s1219801301062
Staff Contributor. (2022, April 28). What is network
topology? Best Guide to Types & Diagrams. Retrieved
from https://www.dnsstuff.com/what-is-network-
topology
Stewart, M. G., & Mueller, J. (2017). Risk and economic
assessment of expedited passenger screening and TSA
PreCheck. Journal of transportation security, 10, 122.
Sadler, S. Written testimony of TSA Office of Intelligence
assistant administrator Steve Sadler for a House
Committee on Homeland Security, Subcommittee on
Transportation Security Hearing titled "Safeguarding
Privacy and Civil Liberties While Keeping our Skies
Safe". (2014, September 18).
Soliman, A., & Adam, M. (2017). Enterprise risk
management and firm performance: An integrated
model for the banking sector. Banks and Bank Systems,
12(2). https://doi.org/10.21511/bbs.12(2).2017.12
Transportation, U. S. (n.d.). Retrieved from Federal
Aviation Administration: faa.gov
TSA. (2014). Transportation Security Administration
Enterprise Risk Management: Emergency Risk
Management Policy Manual. TSA.
Virta, J. L., Jacobson, S. H., & Kobza, J. E. (2003).
Analyzing the cost of screening selectee and
nonselectee baggage. Risk Analysis: An International
Journal, 23, 897-908.
Yip, A. M., & Horvath, S. (2007). Gene network
interconnectedness and the generalized topological
overlap measure. BMC bioinformatics, 8, 22.
Yuan, X., & Cormack, A. N. (2002). Efficient algorithm for
primitive ring statistics in topological networks.
Computational materials science, 24 (3), 343-360.
Risk-Stratified Multi-Objective Resource Allocation for Optimal Aviation Security
117
