
An Augmented Reality System Architecture for Flood Management
Alexios Stavroulakis
1
, Despina Dimelli
2a
, Michail Roumeliotis
1b
and Aikaterini Mania
1c
1
School of Electrical and Computer Engineering, Technical University of Crete, Chania, Greece
2
School of Architecture, Technical University of Crete, Chania, Greece
Keywords: Augmented Reality, Flood Management, Real-Time Operation, Dynamic Data Visualization.
Abstract: Flooding represents a considerable danger to both human lives and possessions, rendering it a prevalent natural
hazard. Navigation and risk assessment methods, in dynamically changing flood environments, are dependent
on flood visualization methods. Addressing the limitations of 2D visualization as well as Virtual Reality (VR)
setups that are employed in off-site simulations, this paper presents the system architecture of a novel system
for real-time urban flood management utilizing head-worn AR, integrating extreme scale data. Our system
architecture will offer a depiction of urban flood inundation in the city of Dortmund, Germany, dynamically
visualizing potential evacuation routes and water levels, on-site, in urban areas, while rescuers are in opera-
tion. The system’s integration with large-scale data analytics will allow the dynamic combination of weather
forecasts, sensor networks, historical flood data and urban topography.
1
INTRODUCTION
Amidst the increasing frequency and severity of
flooding incidents in recent years, emergency re-
sponse and rescue operations face significant chal-
lenges. Navigation and risk assessment methods, in
dynamically changing flood environments, are depen-
dent on flood visualization methods, which should ef-
ficiently communicate risk, without amplifying haz-
ards for first responders (Carver, 2019). Modern dig-
ital visualization tools are increasingly vital in en-
hancing the management of flood risks in urban areas
(Leskens et al., 2017). Rather than commonly used
2D visualization (Towe et al., 2020), prominent tech-
nologies, including virtual reality (VR), augmented
reality (AR), and digital twin simulations, are exten-
sively utilized to depict urban flood scenarios (Oyshi
et al., 2022). Among these, VR has gained extensive
usage (Calil et al., 2021), (Sermet and Demir, 2019)
informing for simulated scenarios, without, though,
awareness of the real world. While research effort
focusing on urban flood visualization are dedicated
to the phases of readiness and prevention, there is
a noticeable gap in the capabilities for real-time ob-
servation and handling of urban flooding events in
a
https://orcid.org/0000-0002-0234-1293
b
https://orcid.org/0000-0002-5465-8356
c
https://orcid.org/0000-0002-9457-5117
AR (Bakhtiari et al., 2023). The reliance on mobile
phones or tablets in previous AR urban flood visu-
alization has constrained on-site operations because
interaction is not hands-free (Mirauda et al., 2018).
This paper introduces the architecture of a novel
system for real-time urban flood management utiliz-
ing the capabilities of head-worn AR, integrating ex-
treme scale data. Previous work has been limited to
utilizing low-scale static data for visualization (Sarri
et al., 2022). Our system’s architecture, when imple-
mented, will visualize multiple urban flood scenarios
by consuming dynamic data, enhancing users’ situ-
ational awareness through cutting-edge AR. Accord-
ing to the system architecture presented, the user will
wear a Hololens 2 AR headset, allowing for hands-
free operation. Our system will dynamically generate
potential evacuation routes and predicted flood level
on-site, in real-time, contributing to the planning of
an efficient rescue. This represents a notable advance-
ment over past work, where routing to avoid pluvial
floods was primarily conducted within VR environ-
ments, focusing on simulation rather than operation
on the field.
Our contributions include:
•
A novel AR-based system architecture for flood
Stavroulakis, A., Dimelli, D., Roumeliotis, M. and Mania, A.
An Augmented Reality System Architecture for Flood Management.
DOI: 10.5220/0012778800003696
Paper published under CC license (CC BY-NC-ND 4.0)
In Proceedings of the 10th International Conference on Geographical Information Systems Theory, Applications and Management (GISTAM 2024), pages 211-218
ISBN: 978-989-758-694-1; ISSN: 2184-500X
Proceedings Copyright © 2024 by SCITEPRESS – Science and Technology Publications, Lda.
211

visualization that utilizes extreme scale and com-
plex data analytics regarding critical urban infras-
tructure and weather forecasts, based on open data
sources. Our system’s architecture offers a depic-
tion of urban flood inundation and will
dynamically simulate potential evacuation routes
and water levels. Unlike VR that confines rescuers
in immersive simulations in laboratories, our
system encompasses on-site rescuers’
intervention.
•
An AR system architecture that integrates a first-
person perspective for situational awareness im-
provement allowing users to experience seamless
integration of the real-world enriched with digital
elements based on spatial data such as
topography, urban networks, densities and uses,
and weather forecast data, keeping users
informed.
•
Enhanced decision-making of flood risks and safe
navigation paths based on AR visualization but
also awareness of real-world surroundings, inte-
grating emergency response protocols, ensuring
safety navigation paths.
2
RELATED WORK
2.1
Augmented Reality and Floods
In addressing the increasing frequency of global
flooding events and the need for heightened public
awareness, past work showcases AR as an effective
medium for educating the public on local flood risks
(Tomkins and Lange, 2019), (Puertas et al., 2020).
Users are able to engage with potential flood levels
in their local flood zones, by leveraging an AR app
that offers in-situ modeling of basic 3D building pro-
totypes (cuboids) along a riverside, facilitating the vi-
sualization of an augmented flood plane (Haynes and
Lange, 2016). Notably, users can actively adjust the
flood plane height, enhancing the interactive experi-
ence. A real-time prototype for mobile augmented re-
ality (MAR) is put forward merging real-time build-
ing model updates, interactive flood visualization, and
seamless integration with live sensor readings, includ-
ing water level, humidity, and soil moisture, accessi-
ble through a network (Haynes et al., 2018). These
sensor readings contribute to detailed real-time anno-
tations. Feedback indicates the need for increased ge-
ometric model complexity to enhance operation on-
site. A MAR coastal erosion 3D visualization system
is put forward leveraging geographical data visualiz-
ing future shoreline changes due to coastal erosion
(Katsiokalis et al., 2020). The study operates under
challenging, for screens, outdoor bright lights achiev-
ing accurate registration of 3D sea segments with
the real-world coastline, viewed seamlessly through
a smartphone screen. However, the application’s effi-
ciency is affected during bad weather and sea waves,
causing the 3D content to drift in the scene. MAR
systems require the user to hold a mobile device
which, while flooding is taking place, is restrictive.
To address this issue, our system architecture
provides 3D visualization utilizing head-worn AR,
enabling users to operate hands-free, while
forecasting of events is streamed to the AR user, in
real-time.
Another approach for effective flood
visualization, is combining AR with a 3D-printed
terrain model (Zhang et al., 2020). The study explores
adaptive flood data processing and hybridizing virtual
flood and terrain models. The researchers simulate a
barrier lake dam-break scenario, comparing between
a flood visualization placed on a 3D printed terrain
model and one on a 3D digital terrain model. Results
show improved flood hazard understanding when a
3D printed model is involved. In our work, we offer a
system architecture which includes real-time urban
flood management, through head-worn AR on-site
rather than in the control room, without the need for
3D printed models.
2.2
Urban Management
Flooding is one of the serious natural climate con-
cerns, that is intensified by climate change and can
cause major economic, social, and environmental
consequences. Urban flooding, which refers to the
inundation of a densely populated area due to excess
rainfall on a continuous and impervious stretch of
land that mostly arises due to an overwhelming ca-
pacity of the drainage system and reduced infiltration
rate, (Eldho et al., 2018) is a major problem in many
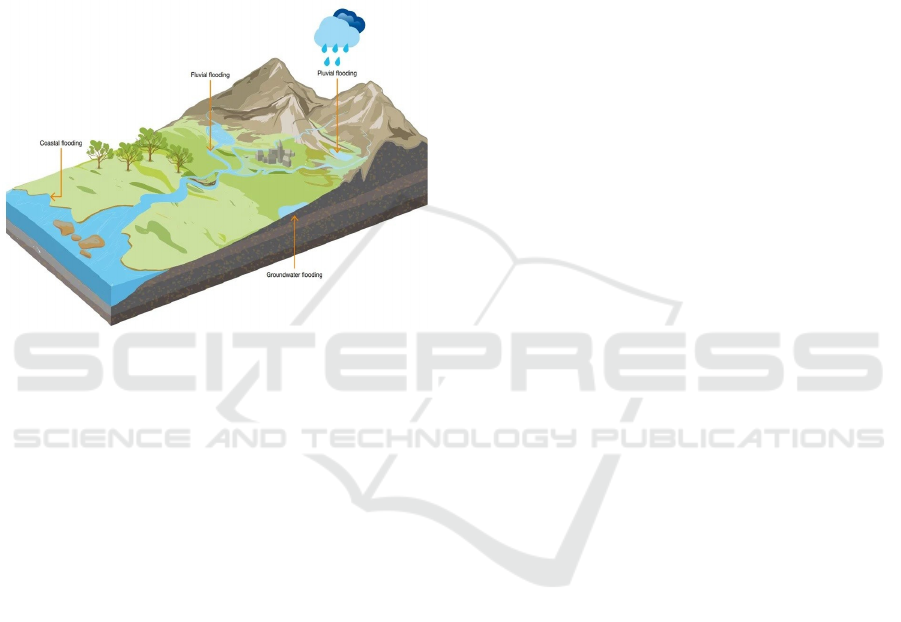
parts of the world. Urban flooding, which can origi-
nate from coastal, pluvial, or fluvial flooding (Figure
1), is the primary source of flood losses worldwide.
Among the categories of flood hazards, pluvial flood-
ing, which is brought on by excessive precipitation
combined with insufficient stormwater infrastructure
or restricted infiltration capacity, has traditionally re-
ceived less attention as it is thought to be controlled
and generally causes less harm. Nonetheless, data in-
dicate that pluvial flooding is a major contributor to
cumulative damage over time, and that hazard expo-
sure changes, aging infrastructure, urbanization, and
global warming are all increasing the likelihood of
these catastrophes, while the necessary infrastructure
to mitigate floods is lacking in most urban areas, ren-
GISTAM 2024 - 10th International Conference on Geographical Information Systems Theory, Applications and Management
212
dering them acutely vulnerable (Brody et al., 2022).
The exposure of an urban area to flooding comprises
the population, its uses and infrastructure, environ-
mental and cultural assets, economic activities, and
all the city’s elements and facilities that cause changes
in physical processes, socioeconomic growth, migra-
tion, and economic changes. The growing trend of
urban flooding is a global phenomenon that has
become an important field of study and provides a
significant challenge, especially for modeling
communities and urban planners.
Figure 1: Types of urban flood.
Urban planning must balance competing needs
and maximize benefits from waterfront economic and
recreational activities and ecosystem services while
ensuring minimum loss of life and property through
safe location, safe construction, and safe activities.
Flood risk reduction measures are categorized into
structural and nonstructural measures. The structural
measures are mainly major public projects that re-
quire moderate-to-major planning and design efforts,
while on the other hand, the nonstructural measures
aim to improve urban planning and management. The
nonstructural measures can be categorized into emer-
gency planning and management, including warn-
ing, evacuation, preparedness, and flood insurance;
speeding up recovery to increase resilience by en-
hancing building design and construction; and flood
avoidance and reduction. The last category is di-
rectly linked with urban planning as it is related to
land use planning as land use, public spaces, relo-
cation, and forestation plans, and architectural plan-
ning as dry and wet flood proofing techniques, struc-
tural retrofitting or reinforcement, and facility mainte-
nance and repair plans (Abdrabo et al., 2022). Effec-
tive flood risk management is related to urban plan-
ning factors, such as the adjustment of urban infras-
tructure, and land-use practices that can integrate sus-
tainable drainage systems, create impermeable sur-
faces, preserve and restore natural floodplains, incor-
porate green infrastructure, propose limits in the con-
struction of flood-prone areas, and formulate emer-
gency response plans (Cea and Costabile, 2022), (Aj-
tai et al., 2023). Our proposed system architecture
addresses the management of urban floods with the
use of hydro-meteorological, topography, and urban
data that ensure real-time rescue operation and coor-
dination.
3
SYSTEM OVERVIEW
This paper proposes the system architecture for AR-
based flood visualization. An innovative approach is
put forward for designing a system managing ur- ban
floods and conducting on-site rescue operations in
real-time through the use of head-word AR, com-
bined with large-scale data integration. Targeting to
enhance real-time decision-making in flood scenar-
ios, our system’s architecture facilitates effective co-
ordination and execution of rescue operations. Uti-
lizing AR headsets, first responders and emergency
management personnel will access and interact with
real-time visual representations of urban floods, in-
cluding water levels, affected areas, and safe routes.
The system’s integration with large-scale data analyt-
ics will allow the dynamic combination of weather
forecasts, sensor networks, historical flood data and
urban topography. The result of data processing is
stored in Kafka topic(s). Subsequently, the Hololens
2 device connects to the corresponding topic through
a client as a consumer and receives the appropriate
messages. Upon receipt of the message from the AR
device, it undergoes processing to isolate the valuable
information necessary for visualization. The AR en-
vironment is designed in a way that ensures vital in-
formation like flood level forecasting will be accessi-
ble without overwhelming the user or blocking users’
field of view. The head-mounted AR device offers a
hands-free experience, enabling users to remain fully
engaged with their surroundings while receiving cru-
cial data updates and navigational assistance.
3.1
Urban Management: Dortmund
The proposed AR-based flood visualization system is
going to be evaluated in Dortmund. The city of Dort-
mund, situated in the metropolitan area of Ruhr and
the heart of Westphalia, is in the catchment area of
three river systems, and has a stable population of
590.000 according to the 2024 census. It is a postin-
dustrial city that, in recent years, has been developing
An Augmented Reality System Architecture for Flood Management
213
the sectors of IT, logistics, and biotechnology. In re-
cent decades, many plans have attempted to manage
the profound structural change in the economy and
create the future of the municipality and region. The
authorities, inhabitants, and experts of the city aim to
develop fewer industrial sites, more residential areas,
a lot more landscape, and more area for nature. Urban
planning promotes equality and balance between the
economic, environmental, and social sectors, sustain-
ability, and participation in all planning strategies,
and aims to establish a reliable framework for public
and private investment in public space, retail, office
build- ings, housing, and large-scale projects (Sierau,
2005). Dortmund has suffered from floods in its
current his- tory, so it is important to manage floods
in a way that will secure resilient urban environments.
In this direc- tion, images that create a sense of 3D
space and depth create a more realistic and interactive
experience for the viewer, so they can provide
important information for flood management
(Bakhtiari et al., 2023). AR can be applied to indicate
the progress and expansion of the flood occurrence
and to assess the flood dam- age and vulnerability of
urban structures. AR models of the built environment
enhances realism and enables more accurate
assessments of flood damage. Hence, combining AR
technology with flood data can pro- vide decision-
makers with valuable insights in urban flood
management (Schröter et al., 2018).
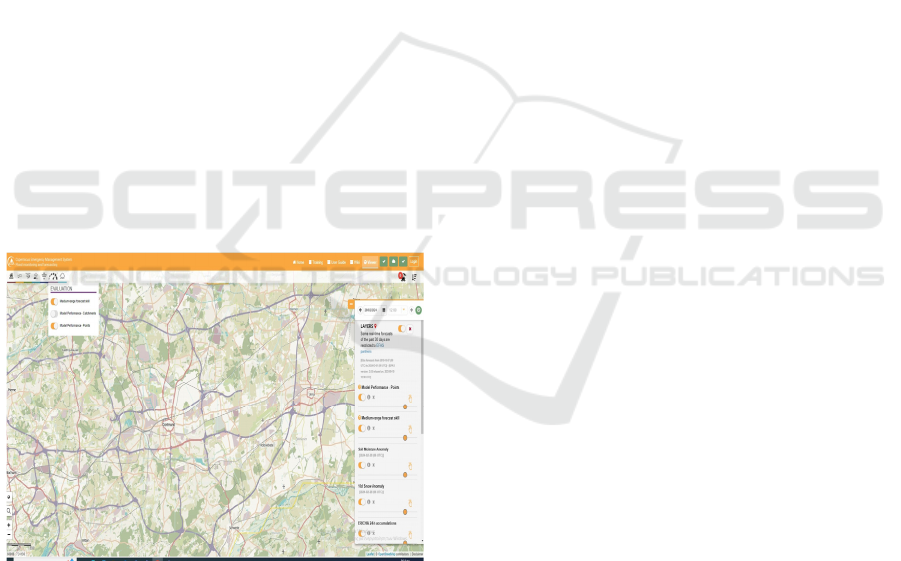
Figure 2: Copernicus Emergency Management system:
Flood monitoring and forecasting.
The urban elements that need to be visualized are
related to the city’s exposure hazards and vul-
nerability. These are topography data as Global
digital terrain models (DTMs)—Shuttle Radar To-
pography Mission (SRTM) and Multi-Error-Removed
Improved-Terrain (MERIT) as well as locally avail-
able data such as laser imaging, detection, and rang-
ing (LiDAR); high-resolution satellite or orthophoto
imagery; drone survey data; and bathymetric sur-
veys of water bodies (Ferguson, et al., 2023). Data
to be integrated may be the Hydrometeorological data
global datasets such as Multi-Source Weighted-
Ensemble Precipitation (MSWEP) or European Cen-
tre for Medium-Range Weather Forecasts (ECMWF)
Reanalysis v5 (ERA5) or the Copernicus Emergency
Management system for flood monitoring and fore-
casting (Figure 2) and local datasets with time series
of rainfall and winds, water levels, or river discharges.
Another important urban element is the existing flood
protection infrastructure and numerical models for
flood hazard modeling, as well as the layout and di-
mensions of primary and secondary drainage infras-
tructure such as road drainage, canals, culverts, pump
stations, and tidal gates, as well as the dimensions and
characteristics of coastal or fluvial embankments,
dunes, and existing hydrological, hydraulic, and risk
models (Ferguson et al., 2023). Existing flood, ex-
posure, or vulnerability data such as global or local
flood hazard maps, (mapped flood hot spots), Open-
StreetMap data, cadastre system data, building types,
population distribution, and characteristics are also
elements that may be visualized as having decisive
role in flood management. Finally, the city’s infras-
tructure, such as roads, drinking water, sanitation,
drainage, and flood protection infrastructure; health
care and school facilities; and environmental and cul-
tural assets; are urban elements that have a decisive
role in city’s resilience and urban flood management.
In the proposed system architecture, the available data
are the available data sets from the EU sites as Coper-
nicus browser (Copernicus Browser, 2024), the Eu-
ropean floodsviewer (European floodsviewer, 2024),
fire data (Copernicus fire data, 2024) and urban data
as mobility networks, public infrastructures, available
3d models, e.t.c
3.2
System Architecture
The proposed architecture, as illustrated in Figure 3
and Figure 4, integrates both static and dynamic into
the DATA Processing Layer. These sources include
geo-location data, information from weather sensors,
topography data, flood history records, satellite im-
agery, and the user’s GPS location. The data under-
goes mostly real-time processing within the Data Pro-
cessing layer, utilizing machine learning algorithms
and big data processing tools such as Apache Flink.
Continuously, the processing results include forecasts
of water levels in urban floods, identification of dan-
gerous and safe areas and establishment of evacua-
tion routes stored in a Kafka Topic. The data from the
Kafka Topic is retrieved through an intermediate
GISTAM 2024 - 10th International Conference on Geographical Information Systems Theory, Applications and Management
214
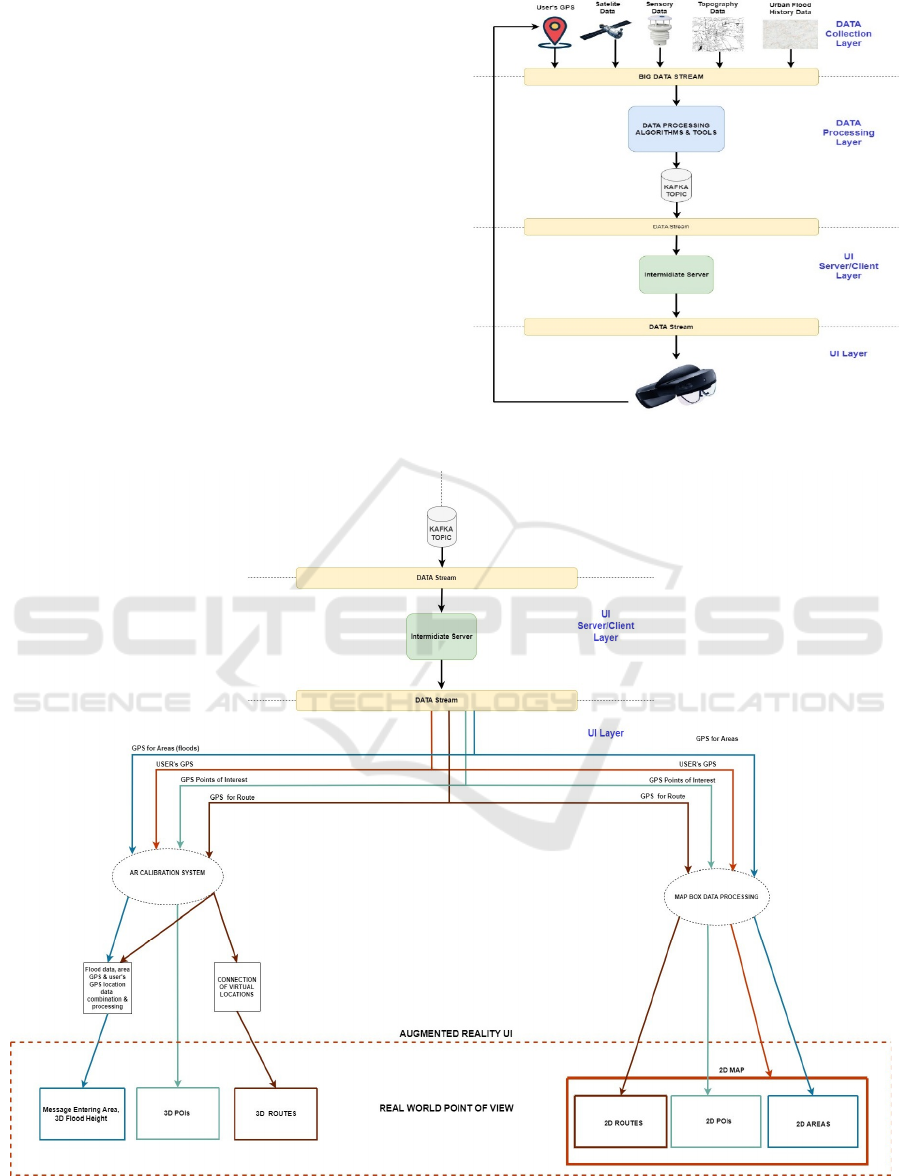
server located in the Server/Client Layer and is for-
matted in GeoJSON (GeoJSON, 2016). The server
deserializes the GeoJSON data before transmitting
it to the HoloLens 2 device. In Hololens 2, data
undergoes additional processing to align real-world
data with the AR world coordinate system. Hololens
2 user interfaces and interaction is being developed
in Unity3D, employing the Mixed Reality Toolkit
(MRTK3, 2023).
3.3
Design of the AR Experience
When on-site, the user will wear the Hololens 2 which
is connected to the appropriate Kafka topic via the in-
termediate server. When the HoloLens 2 device con-
nects to the server, it begins consuming the data re-
quired for visualizing valuable information. As seen
in Figure 4, the data consumed from the server under-
goes two different processes simultaneously:
Figure 3: System Architecture and Layers.
Figure 4: AR Design.
An Augmented Reality System Architecture for Flood Management
215
•
A process which visualizing the given data
into the 3D world
•
A process for visualizing the data on a 2D
map, which map will be positioned in the
upper right corner of the field of view (FOV)
of the HoloLens 2.
Our AR visual components design, included in the
proposed architecture, is based on five different pat-
terns: a) Proxy, which is a visualization near the user
that resembles a referent that is farther away, b) Panel
is a conventional visualization shown together with
the real world objects, semantically linked to a refer-
ent, but lacks a geometric relationship to the physical
environment, c) Labels are a pattern typically used in
an embedded view. Labels are intended to supply ad-
ditional information to referents, d) Glyphs that are
simply visual encodings of some information associ-
ated with one or more referents, which are placed so
they are touching the referent(s) and e) Trajectories
which are a special kind of glyph that connects two or
more endpoints (Lee et al., 2023). The information that
we will be visualized on the Hololens 2 is:
2D Map: The pattern that we use for 2D map com-
ponent is the ”Proxy”. The 2D map will be always be
centralized around user’s GPS location. Additionally,
on the map, routes, points of interest (schools, hos-
pitals etc) and areas will be displayed. We use the
mapbox platform for 2D Map visualization and for
conversion processing (Mapbox, 2010).
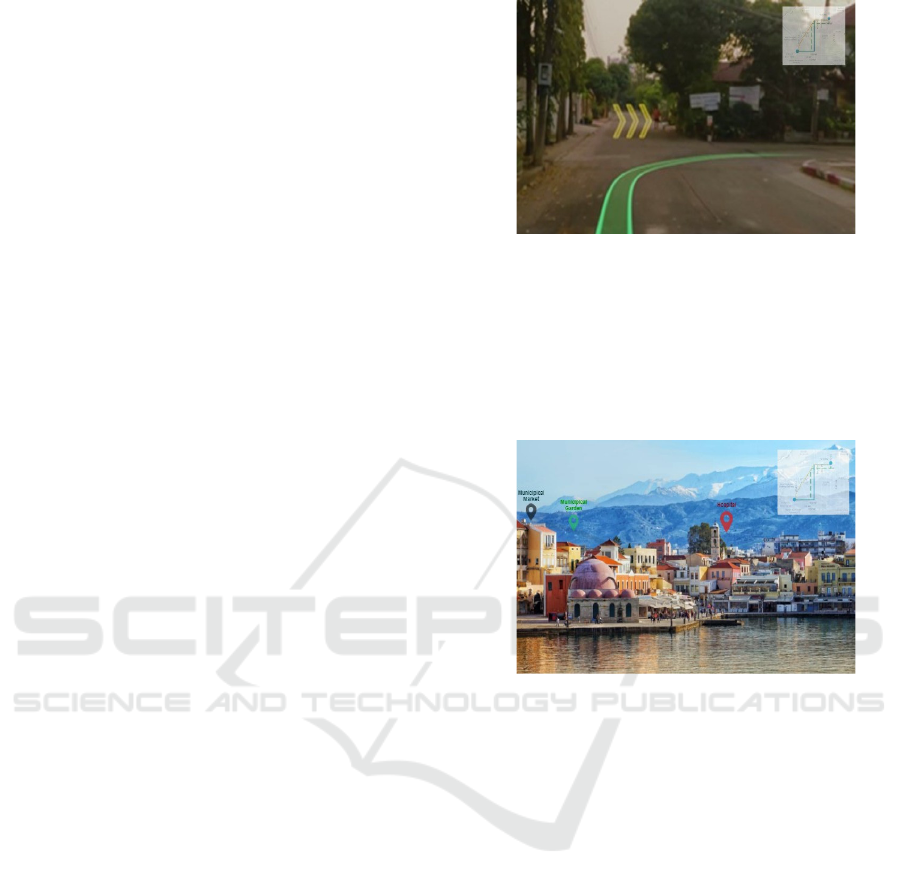
Routes: We begin by receiving a set of GPS loca-
tions retrieved from a GeoJSON file from the ”Line
String” property. For real-world visualization, the
pattern that we use is the ”Trajectory”. We will then
align the real GPS locations with the local coordinate
system of the Hololens 2 device through an AR cali-
bration process and visualize those points on the real
world. We will connect these points one by one with
a line, starting from the user’s GPS location which is
also aligned with the local coordinate system of the
Hololens 2 device. For the 2D map visualization, we
follow the same logic, with the only difference being
the calibration process, which must be aligned with
the 2D map coordinate system. The 2D map visual-
ization object will be toggled on and off to ensure that
the user’s field of view (FOV) remains unobstructed.
A concept of route is illustrated in Figure 5.
Figure 5: Route Visualization Concept.
Points of Interest (POI): Utilizing the Glyph pat- tern,
we apply the same logic as with ”Routes” to vi-
sualize any point of interest on a 2D map and in the
3D world. The key difference is that we don’t connect
these points with lines A concept of point of interest
visualization is illustrated in Figure 6.
Figure 6: POI Visualization Concept.
Areas: Following the same logic as with ”Routes”, we
extract valuable data from the GeoJSON residing in
the ”Polygon” property. Next, we will generate GPS
points on the 2D map and connect them sequentially
with lines, connecting also the last point with the first.
In the real world, a message will be displayed on lens
utilizing the ”Panel” pattern, informing the user that
they have entered a specific area by combining the
user’s GPS location with the defined area shape.
Flood (Areas): We consider the ”Floods” as ”Ar-
eas,” and we follow the same logic as described above
for visualizing them both in the 2D map and in the 3D
world. The key difference is that in the 3D world, we
will also visualize the possible water levels that may
be reached during the next time window in a manner
that does not obstruct the user’s field of view (FOV),
utilizing the Panel pattern. A concept of ”Flood” vi-
sualization is illustrated in Figure 7.
GISTAM 2024 - 10th International Conference on Geographical Information Systems Theory, Applications and Management
216

Figure 7: Flood Area Visualization Concept.
4 CONCLUSIONS
This paper proposes a novel system architecture for
AR flood visualization that will, when implemented,
utilize extreme scale and complex data analytics re-
garding critical urban infrastructure and weather fore-
casts, based on open data sources. Our system archi-
tecture dynamically visualizes potential evacuation
routes and water levels, while a rescuer wears AR ap-
paratus and moves on-site. We expect that the first-
person perspective of head-word AR will improve sit-
uational awareness and allow informed decisions and
intervention in high-risk areas. Initial testing will be
conducted in the area of Dortmund, Germany. Our
system will be complemented by gaze-based interac-
tion, allowing for hand-free operation as well as level-
of-detail management of digital information, as su-
perimposed onto the real-world so that the real-world
is not obstructed. Moreover, rescuers’ physiological
monitoring will allow communication of distress.
ACKNOWLEDGEMENTS
This work was supported by the EU project
CREXDATA under Horizon Europe agreement No.
101092749.
REFERENCES
Abdrabo, K. I., Kantosh, S. A., Saber, M., Sumi, T., Ellei-
thy, D., Habiba, O. M., and Alboshy, B. (2022). The
Role of Urban Planning and Landscape Tools Con-
cerning Flash Flood Risk Reduction Within Arid and
Semiarid Regions., pages 283–316. Springer Singa-
pore.
Ajtai, I., S
,
tefӑnie, H., Malos
,
, C., Botezan, C., Radovici,
A., Bizӑu-Cârstea, M., and Baciu, C. (2023).
Map
ping
social vulnerability to floods. a comprehensive
framework using a vulnerability index approach and
pca analysis. Ecological Indicators, 154.
Bakhtiari, V., Piadeh, F., Behzadian, K., and Kapelan, Z.
(2023). A critical review for the application of cutting-
edge digital visualization technologies for effective
urban flood risk management. In Sustainable Cities and
Society, volume 99.
Brody, S., Lee, Y., and Kothuis, B. B. (2022). Chapter 5
- urban flood modeling: Perspectives, challenges, and
opportunities. In Coastal Flood Risk Reduction, pages
47–60. Elsevier.
Calil, J., Fauville, G., Queiroz, A. C. M., Leo, K. L., Mann,
A. G. N., Wise-West, T., Salvatore, P., and Bailenson, J.
N. (2021). Using virtual reality in sea level rise
planning and community engagement—an overview.
Water, 13(9).
Carver, S. (2019). Developing web-based gis/mce: Improv-
ing access to data and spatial decision support tools. In
Spatial multicriteria decision making and analysis,
pages 49–76. Routledge.
Cea, L. and Costabile, P. (2022). Flood risk in urban areas:
Modelling, Management and adaptation to climate
change. a review. volume 9.
Copernicus Browser (2024). Copernicus browser. https://
dataspace.copernicus.eu/browser/.
Copernicus fire data (2024). Copernicus fire data. https://
effis.jrc.ec.europa.eu/apps/effiscurrent situation/
Eldho, T., Zope, P., and Kulkarni, A. (2018). Urban flood
management in coastal regions using numerical simu-
lation and geographic information system. In
Integrat
ing
Disaster Science and Management, pages 205–219.
Elsevier.
European floodsviewer (2024). European floodsviewer.
https://discomap.eea.europa.eu/floodsviewer/.
Ferguson, S., Ledden, M. V., Rubinyi, S., Campos, A., and
Doeffinger, T. (2023). Urban flood risk handbook: As-
sessing risk and identifying interventions.
GeoJSON (2016). Geojson format. https://datatracker.
ietf.org/doc/html/rfc7946.
Haynes, P., Hehl-Lange, S., and Lange, E. (2018). Mobile
augmented reality for flood visualisation. In Environ-
mental Modelling Software, volume 109, pages 380–
389. Elsevier.
Haynes, P. S. and Lange, E. (2016). Mobile augmented
reality for flood visualisation in urban riverside land-
scapes. In Journal of Digital Landscape Architecture,
pages 254–262. Herbert Wichmann Verlag.
Katsiokalis, M., Ragia, L., and Mania, K. (2020). Outdoors
mobile augmented reality for coastal erosion visual-
ization based on geographical data. In Proceedings of
the International Workshop on Cross-Reality (XR)
Interaction co-located with 14th ACM International
Conference on Interactive Surfaces and Spaces (ACM
ISS 2020), vol 2779, pages 380–389. CEUR-WS.org.
Lee, B., Sedlmair, M., and Schmalstieg, D. (2023). Design
patterns for situated visualization in augmented reality.
Leskens, J. G., Kehl, C., Tutenel, T., Kol, T., de Haan, G.,
Stelling, G., and Eisemann, E. (2017). An interactive
simulation and visualization tool for flood analysis
An Augmented Reality System Architecture for Flood Management
217

usable for practitioners. In Mitigation and Adaptation
Strategies for Global Change, page 307–324.
Mapbox (2010). Mapbox platform. https://www.mapbox.
com/.
Mirauda, D., Erra, U., Agatiello, R., and Cerverizzo, M.
(2018). Mobile augmented reality for flood events. In
International Journal of Sustainable Development and
Planning, volume 13, pages 418 – 424.
MRTK3 (2023). Mixed reality toolkit 3. https://learn.
microsoft.com/en-us/windows/mixed-reality/mrtk-
unity/mrtk3-overview/.
Oyshi, M. T., Maleska, V., Schanze, J., Bormann, F.,
Dachselt, R., and Gumhold, S. (2022). Floodvis: Vi-
sualization of climate ensemble flood projections in
virtual reality. In Workshop on Visualisation in Envi-
ronmental Sciences (EnvirVis). The Eurographics As-
sociation.
Puertas, J., Hernández-Ibáñez, L., Cea, L., Regueiro-
Picallo, M., Barneche-Naya, V., and Varela-García, F.-
A. (2020). An augmented reality facility to run hybrid
physical-numerical flood models. Water, 12.
Sarri, F., Ragia, L., Panagiotopoulou, A., and Mania, K.
(2022). Location-aware augmented-reality for pre-
dicting sea level rise in situ. In 2022 International
Conference on Interactive Media, Smart Systems and
Emerging Technologies (IMET), pages 1–8.
Schro¨ter,
K.,
Lu¨dtke,
S.,
Redweik,
R.,
Meier,
J.,
Bochow,
M., Ross, L., Nagel, C., and Kreibich, H. (2018). Flood
loss estimation using 3d city models and remote sensing
data. In Environmental Modelling Software, volume
105, pages 118–131.
Sermet, Y. and Demir, I. (2019). Flood action vr: a virtual
reality framework for disaster awareness and emer-
gency response training. In ACM SIGGRAPH 2019
Posters. Association for Computing Machinery.
Sierau, U. (2005). Dortmund’s urban development strate-
gies for the future. Dortmund: Dortmund Municipality.
Tomkins, A. and Lange, E. (2019). Interactive landscape
design and flood visualisation in augmented reality. In
Multimodal Technologies and Interaction, volume 3.
Towe, R., Dean, G., Edwards, L., Nundloll, V., Blair, G.,
Lamb, R., Hankin, B., and Manson, S. (2020). Re-
thinking data-driven decision support in flood risk
management for a big data age. Journal of Flood Risk
Management, 13(4):e12652.
Zhang, G., Gong, J., Li, Y., Sun, J., Xu, B., Zhang, D.,
Zhou, J., Guo, L., Shen, S., and Yin, B. (2020). An ef-
ficient flood dynamic visualization approach based on 3d
printing and augmented reality. In International
Journal of Digital Earth, volume 13, pages 1302– 1320.
Taylor Francis.
GISTAM 2024 - 10th International Conference on Geographical Information Systems Theory, Applications and Management
218
