
Adopting Delta Maintainability Model for Just in Time Bug Prediction
Lerina Aversano
1 a
, Martina Iammarino
2 b
, Antonella Madau
4 c
, Debora Montano
3 d
and Chiara Verdone
4 e
1
Dept. of Agricultural Science, Food, Natural Resources and Engineering, University of Foggia, Foggia, Italy
2
Dept. of Informatics, University of Bari Aldo Moro, Bari, Italy
3
CeRICT scrl, Regional Center Information Communication Technology, Benevento, Italy
4
Dept. of Engineering, University of Sannio, Benevento, Italy
Keywords:
Just-In-Time Bug Prediction, Process Metrics, Pipeline.
Abstract:
A flaw that leads to a software malfunction is called a bug. Preventing bugs from the beginning reduces the
need to address complex problems in later stages of development or after software release. Therefore, bug
prevention helps create more stable and robust code because bug-free software is easier to maintain, update,
and expand over time. In this regard, we propose a pipeline for the prevention of bugs in the source code,
consisting of a machine learning model capable of predicting just in time whether a new commit inserted into
the repository can be classified as ”good” or ”bad”. This is a critical issue as it directly affects the quality of
our code. The approach is based on a set of features containing process software metrics at the commit level,
some of which are related to the impact of changes. The proposed method was validated on data obtained from
three open-source systems, for which the entire evolutionary history was considered, focusing mainly on those
affected by bugs. The results are satisfactory and show not only the effectiveness of the proposed pipeline
capable of working in continuous integration but also the ability of the approach to work cross-project, thus
generalizing the results obtained.
1 INTRODUCTION
A bug is an error or defect in software that causes
it to function unexpectedly or undesirably (Ayewah
et al., 2007). Bugs can manifest themselves in various
ways, such as malfunctions, program crashes, calcu-
lation errors, or unexpected behavior. They can result
from programming errors, design errors, or even ex-
ternal factors such as unexpected system conditions.
Bug prevention is of extreme importance in the
software development process, not only because bugs
can compromise the reliability of the software, caus-
ing malfunctions that can lead to data loss, critical er-
rors, or even system crashes, but also because these
can be exploited by attackers to breach system secu-
rity. Additionally, fixing bugs after the software has
a
https://orcid.org/0000-0003-2436-6835
b
https://orcid.org/0000-0001-8025-733X
c
https://orcid.org/0009-0003-2227-9778
d
https://orcid.org/0000-0002-5598-0822
e
https://orcid.org/0000-0003-1335-5276
been released can be expensive and time-consuming,
so preventing bugs during the development stages in
the first place can help reduce costs and improve the
overall efficiency of the development process, and can
help create cleaner, more structured systems, making
developers’ jobs easier, in the long run, (Zhang et al.,
2012).
Furthermore, it must be considered that very of-
ten developers use collaborative development plat-
forms, such as Github, where the source code is man-
aged via Github. Therefore, developers collaborate on
shared repositories, and commits are used to record
changes made to the code during the development
cycle (Rodr
´
ıguez-P
´
erez et al., 2020). However, it
happens too often that aggressive development cycles
are adopted, too rapid development cycles in which
changes are made frequently. This approach responds
to user needs promptly, but also increases the risk of
introducing bugs into the process (Tan et al., 2014).
Therefore, code quality management involves con-
stantly monitoring and controlling changes made to
the source code to avoid the introduction of bugs.
Aversano, L., Iammarino, M., Madau, A., Montano, D. and Verdone, C.
Adopting Delta Maintainability Model for Just in Time Bug Prediction.
DOI: 10.5220/0012785100003753
Paper published under CC license (CC BY-NC-ND 4.0)
In Proceedings of the 19th International Conference on Software Technologies (ICSOFT 2024), pages 419-426
ISBN: 978-989-758-706-1; ISSN: 2184-2833
Proceedings Copyright © 2024 by SCITEPRESS – Science and Technology Publications, Lda.
419

The problem of bugs introduced by commits in
repositories constitutes a problem of great importance
in the world of software development (Wen et al.,
2019; Marengo et al., 2018). This issue highlights
how even seemingly small or innocuous changes can
have a significant impact on the stability and per-
formance of an application. Therefore, the problem
of bugs introduced by commits highlights the impor-
tance of developing bug prediction and prevention
systems capable of identifying risky changes before
they negatively affect development.
In this regard, this paper proposes a pipeline
whose primary goal is to prevent the introduction
of just-in-time bugs into the source code. This is
achieved by evaluating each new commit against a
baseline set to identify suspicious commits that may
contain errors or code quality issues. The toolchain
was therefore developed with the idea of improving
the quality of software in general by promptly iden-
tifying and correcting errors. In this regard, it helps
ensure that the software produced is more reliable,
stable, and meets the desired quality standards. At
the same time, it helps save resources and time and
prevents the introduction of bugs at an early stage of
development, thus reducing the possibility of solv-
ing more complex problems in later stages. On the
one hand, it provides developers and project man-
agers with data and information to make informed de-
cisions, on the other it offers key metrics and indica-
tors on the quality of the code and the effectiveness of
the development process. Specifically, the proposed
approach focuses on process metrics, some closely re-
lated to the state of the software system at a given in-
stant of time, and others related to the impact of the
change upon the introduction of a new commit.
The paper is structured as follows: Section 2 re-
ports the most related works, Section 3 details the ap-
proach followed for the development of the proposed
pipeline, and Section 4 reports the results of the ex-
periments carried out. Finally, the conclusions and
future work in Section 6.
2 RELATED WORKS
One development objective that is especially rele-
vant to high-assurance software systems is lowering
the number of software defects (Seliya et al., 2010).
Early identification of defects and their characteristics
(Neelofar et al., 2012) could lead to rapid rectifica-
tion of defects with a view to providing maintainable
software. The literature presents a variety of software
metrics. Early in the software development life cycle,
models can be created that could be used to anticipate
problematic modules or classes using these software
parameters and error data (Nagwani and Suri, 2023).
Despite their frequent use in the literature on de-
fect prediction, the authors in (Rahman and Devanbu,
2013) contend that process metrics are typically more
beneficial for prediction than code metrics. They dis-
cover that code metrics are quite stable; they do not
change significantly from release to release. This
causes stagnation in the prediction models, resulting
in the same files being forecasted as defective mul-
tiple times; however, these recurringly defective files
are comparatively less defect-dense.
In recent years, several studies have been con-
ducted that relate machine learning techniques to the
prevention and prediction of bugs (Malhotra, 2015).
The authors in (Osman et al., 2018) examine the
effects of wrapper feature selection techniques and
correlation-based feature selection techniques on five
prediction models and show how these models func-
tion both with and without feature selection to fore-
cast the number of bugs in five distinct open-source
Java software systems. The findings demonstrate that
while removing more than half of the features, wrap-
pers can increase prediction accuracy by up to 33%.
In (Song et al., 2011), the authors provide and as-
sess a basic framework for predicting software de-
fects that facilitates an evaluation of competing pre-
diction techniques. To showcase the effectiveness of
the suggested methodology, they employ both pub-
licly accessible software defect data sets and simula-
tion. The authors emphasize that it’s critical to select
distinct learning schemes for various data sets (i.e., no
scheme should predominate) and that even minor ad-
justments to evaluation procedures might drastically
alter results.
In (Osman, 2017), the authors build a bug detec-
tor by paying particular attention to null-related bugs
through empirical analysis. Additionally, they empir-
ically demonstrate how feature selection and hyper-
parameter optimizations raise the accuracy of predic-
tions. Next, by determining the most practical mix of
bug prediction setups, machine learning models, and
response labels, they optimize bug prediction to lo-
cate the largest number of bugs in the least amount of
code. They demonstrate how to create the most cost-
effective bug predictor by treating change metrics and
source code as dependent variables, performing fea-
ture selection on them, and then utilizing an optimised
random forest to forecast the number of defects.
In order to automatically generate feedback to de-
velopers, the authors in (Khanan et al., 2021) present
an explainable Just-In-Time defect prediction frame-
work. This framework provides the riskiness of each
commit, an explanation of why the commit is danger-
ICSOFT 2024 - 19th International Conference on Software Technologies
420

ous, and suggestions for risk mitigation. In order to
continually monitor and assess a stream of contribu-
tions in numerous GitHub repositories, the framework
is incorporated into the GitHub CI/CD pipeline as a
GitHub application.
The authors in (Wang et al., 2021) propose an
approach for conducting bug prediction in terms of
model construction, updating, and evaluation in real-
world continuous software development. The authors
suggest ConBuild for model development, which uses
the distributional properties of bug prediction data to
inform the choice of training versions. In order to fa-
cilitate the reuse or updating of bug prediction mod-
els in continuous software development, the authors
suggest ConUpdate, which makes use of the evolu-
tion of distributional properties of bug prediction data
between versions. The authors suggest ConEA for
model evaluation, which conducts effort-aware eval-
uation by making use of the evolution of the buggy
likelihood of files between versions.
3 APPROACH
The main objective of the study is to investigate the
performance of the proposed approach for continu-
ous just-in-time bug prediction in the context of open-
source software projects.
First of all, we focused our attention on the set
of metrics best suited to predicting bugs in commits.
To this end, we extract a series of commit-level pro-
cess metrics. To validate our approach and the chosen
subset of metrics, we generalize its use by adopting
transfer learning. Therefore, we train our model on a
set of commits belonging to a set of software systems
and test it on commits belonging to a different one.
The general architecture of the proposed pipeline
is shown in Figure 1, where it is possible to deduce
the main phases.
The main objective of the study is to investigate
the performance of the proposed approach for con-
tinuous just-in-time bug prediction in the context of
open-source software projects. First of all, we fo-
cused our attention on the set of metrics best suited
to predicting bugs in commits. To this end, we ex-
tract a series of commit-level process metrics. To val-
idate our approach and the chosen subset of metrics,
we generalize its use by adopting transfer learning.
Therefore, we train our model on a set of commits
belonging to a set of software systems and test it on
commits belonging to a different one.
The implemented process begins with the selec-
tion of repositories on GitHub and the subsequent ex-
traction of features. Specifically, the first phase in-
volves on the one hand the collection of all the com-
mit logs which are subsequently subjected to the eval-
uation of the process metrics, and on the other the ex-
traction of all the information on the bugs. After data
integration, we proceed with the evaluation of the ma-
chine learning models. Based on the previous data
analysis steps, several classifiers are tested. Once the
model has been selected, training is carried out using
different datasets based on the different combinations
of previously extracted features. Finally, in the last
stage, the classification model is used to make predic-
tions about future data regarding the presence of bugs.
In particular, we talk about just-in-time prediction be-
cause given a given commit, our model is capable of
predicting what the next one will be like based on the
metrics considered, even before it is published. More
details on the phases just described will be provided
in the following paragraphs.
3.1 Data Extraction
The proposed pipeline has as its first step the ex-
traction of the data on which to conduct the experi-
ments. In detail, the process begins with the selection
of Github repositories with a long history in terms of
commits.
Therefore, three repositories are identified, Elas-
ticSearch, Guava, and RxJava, and for each of these
the entire history, commits, modified files, and related
metadata are extracted.
Next, each software system is subjected to bug
identification. More specifically, the runSZZ algo-
rithm is used which, given a bug fix commit, iden-
tifies the commits that probably introduced the bug.
In essence, given the commit in which the fixing oc-
curred as input, SZZ identifies the latest commit to
each modified line of source code (
´
Sliwerski et al.,
2005). The algorithm is divided into two main com-
ponents, SSZNoIssueTracher and SZZ, which are
responsible for analyzing commits and identifying
bugs, respectively. This is the crucial step to gener-
ate the list of buggy commits. The output of the algo-
rithm consists of two JSON files, one that locates and
tracks bugs, and one that tracks commits responsible
for introducing bugs into the source code.
Finally, for each commit, we extracted a set of
metrics related to the process. We chose to consider
process metrics based on the results of the study (Rah-
man and Devanbu, 2013), in which the results high-
light that code metrics, despite widespread use in the
defect prediction literature, are generally less useful
than process metrics for prediction. Specifically in
the context of process metrics, we consider two sets
of metrics, the first containing indicators strictly re-
Adopting Delta Maintainability Model for Just in Time Bug Prediction
421
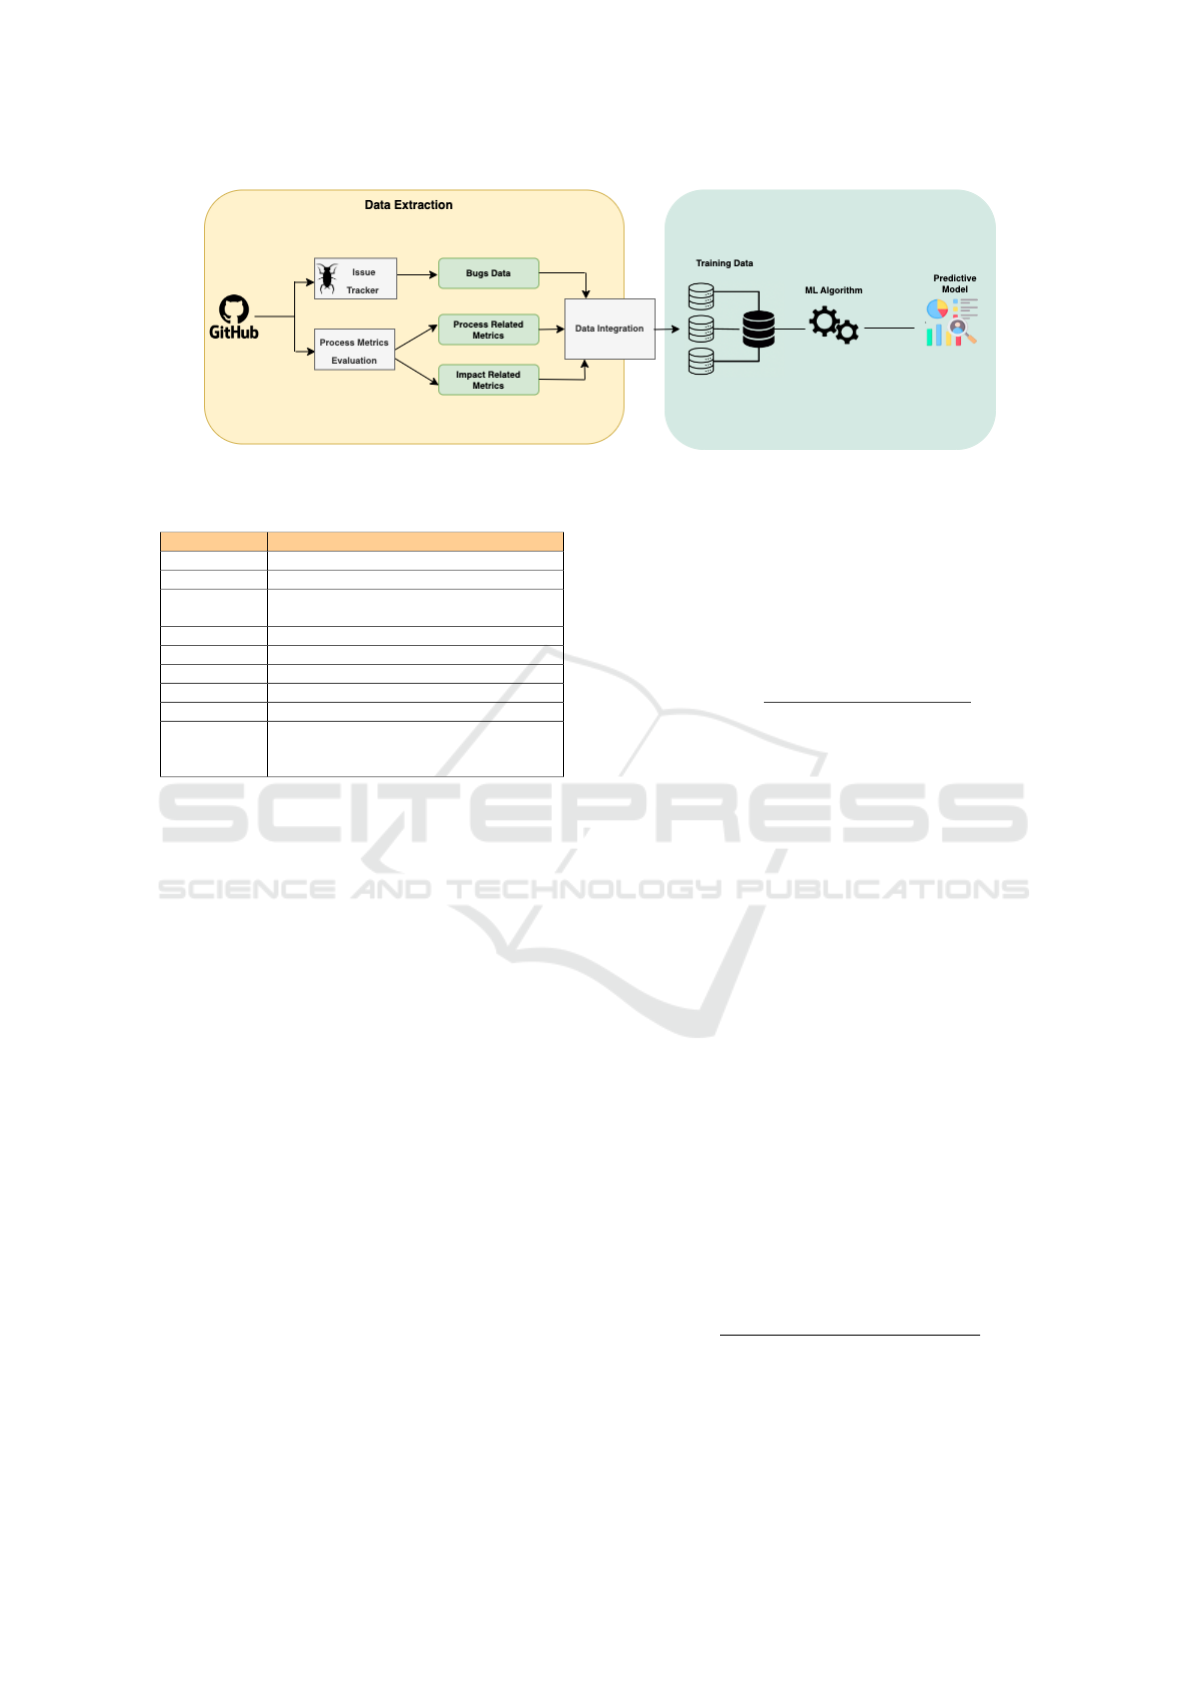
Figure 1: Architecture of the Approach.
Table 1: Process Related Metrics.
Feature Description
Project Name repository name
Author name of the committer
Date
the date of the author’s commit
with the format ”YYYY-MM-DD”
Day day of the week the commit was made
Insertion number of lines added in the commi
Deletions number of lines removed in the commit
Total Lines total number of lines of code in the commit
Files added number of new files added in the commit
Fix attempt
a boolean value that suggests,
starting from the commit message,
whether it is a fix attempt
lated to the process, whose metrics are shown in the
Table 1, where the name is shown in the first column
and a brief description in the second.
The second set of metrics is described in the next
section.
3.2 Impact Related Metrics Calculation
Source code change impact metrics are tools used to
evaluate the extent and effects of a change made to the
software. These metrics provide crucial information
to developers and project managers, allowing them to
assess the complexity, scope, and possible risks asso-
ciated with a specific change.
In this regard, specific metrics were measured to
quantify and evaluate the impact of the software in ob-
jective terms. First of all, to evaluate the maintainabil-
ity implications of commits, we calculated the Delta
Maintainability Model (DMM)(di Biase et al., 2019).
The delta-maintainability metric is the percentage of
low-risk changes in a commit. Its value can fluctu-
ate between 0 when the changes can be considered
risky and 1 when the changes are low risk. Reward
the improvement of methods and penalize the wors-
ening of things. The starting point of the DMM is a
risk profile according to which methods are classified
into four bands: low, medium, high, and very high-
risk methods. Therefore, the risk profile of a class is
then a 4-tuple representing the amount of code.
To transfer risk profiles from the file level to the
commit level, we consider delta risk profiles. These
are pairs (dl, dh), with dl representing the increase in
the low-risk code and dh the increase in the high-risk
code.
The DMM value is calculated as follows:
DMM =
goodchange
goodchange + badchange
(1)
Below are the other metrics calculated:
• Span of Changes: represents the number of files
modified per commit. The formula is as follows:
FILES(c) =
N
∑
f
1c ∼> f (2)
where c denotes changes and f denotes files, for a
change c and a file f, c∼>f indicates that change
c affects file f.
• History of Frequent Changes: indicates the sum
of changes c on file f since the latter was added.
The formula is as follows:
CHFG( f , I) =
N
∑
c∼> f
1DAT E(c)εI (3)
• Commit Maintainability (MC): a software mainte-
nance metric based solely on commit-level LOC
(Lines of Code). Used to evaluate and measure
the complexity and size of an application’s source
code, it represents the total number of lines of
source code present in committed files.
The formula is as follows:
MC =
LOC f oridCommit
Limitthreshold f or pro jectName
∗ 100
(4)
where LOC for idCommit is the sum of the num-
ber of lines of code of each file added or modified
ICSOFT 2024 - 19th International Conference on Software Technologies
422

for each idCommit, and Limit Threshold for pro-
jectName is a maximum value of desired or ac-
ceptable LOC for the commit, calculated as the
average of the LOCs for idComit for each project-
Name. A lower value of LOC for idCommit than
the maximum assigned value will lead to a lower
score, indicating higher maintainability, while a
value of LOC for idCommit that exceeds the max-
imum assigned value will lead to a higher score,
indicating lower maintainability.
3.3 Data Analysis
Dataset analysis is a crucial step in building machine
learning models, as the quality and relevance of the
data directly influence the performance of the models
themselves. In this regard, one of the main features of
our approach involves a different selection of features.
In particular, for each selected software system,
we consider 6 different versions of the dataset, each
of which is always characterized by the basic char-
acteristics with the addition of a single characteristic
relating to the quality of the code.
More specifically, version 1 (D1), in the set of im-
pact metrics, takes into consideration the total num-
ber of lines of code (Total LOC) as an additional
metric; version 2 (D2) commit maintainability; ver-
sion 3 (D3) is the metric that considers the maximum
of the History of Frequent Changes; version 4 (D4)
is the metric that considers the average of the His-
tory of Frequent Changes; version 5 (D5) the delta-
maintainability metric (DMM), and finally version 6
(D6) the Span of Changes metric.
In order to provide a visual representation of the
relationships between features in the different ver-
sions of the dataset considered for the experiments,
Figure 2 shows a Venn diagram. This diagram clearly
shows the shared characteristics between different
versions of the dataset and provides an intuitive pic-
ture of the overlapping information. In the diagram,
each circle represents a version of the specific dataset,
while the intersections highlight common character-
istics. The variety of information collected aims to
provide a complete picture of the dynamics of the
projects analyzed.
3.4 Classification Task
For the classification task, three models were evalu-
ated, all based on trees:
• Decision Tree (DTC): a machine learning model
that is based on a tree structure composed of de-
cision nodes and leaves. Each decision node rep-
resents a choice about a feature of the data, while
Figure 2: Venn Diagram.
the leaves contain the model’s predictions. Dur-
ing training, the tree divides based on the most in-
formative features, trying to create divisions that
maximize the purity of the leaves (minimizing en-
tropy). The Decision Tree is interpretable and can
handle both classification and regression prob-
lems (Magee, 1964).
• Random Forest (RFC): a machine learning model
that exploits ensemble learning, combining mul-
tiple Decision Trees to improve precision and
generalization. During training, several Decision
Trees are created on random subsets of the train-
ing data and features. The final predictions are
obtained by voting or averaging the predictions of
each tree. This approach reduces the risk of over-
fitting and improves the robustness of the model
(Cutler et al., 2012).
• Extra Tree (EXTC): a variant of Random For-
est that goes further, using a more random strat-
egy in the creation of individual trees. When se-
lecting splits in nodes, it randomly chooses split
points rather than searching for the best possible
one. This makes the model more computation-
ally efficient than traditional Random Forest. Al-
though the decision process is less interpretable
than standard Decision Trees, Extra Tree can of-
ten achieve competitive results with lower compu-
tational complexity (Geurts et al., 2006).
The classifier training process involved the use
of a training dataset containing the extracted features
and also the calculated metrics. The model was itera-
tively trained, evaluated, and optimized to ensure high
performance.
To evaluate the predictive effectiveness of the
model, the confusion matrix was used, which pro-
vides an overview of the model’s performance, in-
dicating the number of correct and incorrect predic-
Adopting Delta Maintainability Model for Just in Time Bug Prediction
423

tions. Furthermore, to understand which variables
have a significant impact on the model’s predictions,
the ”feature importance” was examined to understand
which feature can have the greatest impact on bug
prediction. Finally, precision and recall metrics were
adopted to evaluate the performance of the model in
predicting future behavior. These metrics provide an
in-depth understanding of the model’s ability to make
accurate predictions.
4 RESULTS
This section reports the results of the experiments
conducted to validate the proposed approach.
In particular, for each software system considered
we report a table with the results of the accuracy ob-
tained. Each row of the table refers to a specific classi-
fier tested, while each column refers to the version of
the dataset taken into consideration for the analysis.
We chose accuracy as the validation metric because
accuracy involves the ability to get close to a specific
result. Our goal is to correctly identify the presence
of bugs in commits, so as to avoid them before the
software can be compromised.
Table 2 shows the accuracy performance of the
three classifiers for all the different sets of features
extracted from ElasticSearch project. As we can see,
all classifiers achieve very high levels of accuracy;
Extra Trees and Random Forest always obtain results
around 91% while Decision Tree maintains lower val-
ues around 83%. In particular, among the two best,
Extra Trees is the best performer for datasets D1, D4,
and D5, while Random Forest achieves better accu-
racy values for the remaining three datasets. The best
result ever for the ElasticSearch repository is obtained
using the D2 and Random Forest feature set, reaching
an accuracy value of 91.53%.
Table 2: Accuracy Results for ElasticSearch.
Classifier D1 D2 D3 D4 D5 D6
DTC 0.8463 0.843 0.8373 0.8412 0.8381 0.843
RFC 0.9115 0.9153 0.9143 0.913 0.9094 0.9133
EXTC 0.9133 0.9107 0.9115 0.9122 0.9145 0.9102
The accuracy performance of the three classifiers
for each of the various feature sets taken from the
Guava project is displayed in Table 3. In this case, the
general trend is similar to the previous one: Random
Forest and Extra Tree are better than Decision Tree
even if the gap compared to the previous case short-
ens from a difference of 7 percentage points to around
3 points. All the classifiers perform an accuracy value
over 94%. In particular, Random Forest is the best
performer for datasets D1, D2, D4, D5, and D6 with
an accuracy of 97.67%, while Extra Tree achieves bet-
ter accuracy values for the remaining dataset.
Table 3: Accuracy Results for Guava.
Classifier D1 D2 D3 D4 D5 D6
DTC 0.9488 0.9488 0.9442 0.9488 0.9535 0.9628
RFC 0.9767 0.9767 0.9721 0.9767 0.9767 0.9767
EXTC 0.9721 0.9721 0.9721 0.9674 0.9767 0.9721
Table 4 shows the accuracy performance of the
three classifiers for each of the different feature sets
extracted from the Rxjava repository. In this case
the situation is different compared to the previous
cases, as we can see, Random Forest confirms itself
as the best classifier in each set of features consid-
ered, reaching 91.67% for the first 5 datasets. Deci-
sion Tree and Extra Tree performance are on the same
level for each dataset except in D3 where Extra Tree
equals Random Forest in accuracy.
Table 4: Accuracy Results for Rxjava.
Classifier D1 D2 D3 D4 D5 D6
DTC 0.875 0.875 0.9583 0.875 0.833 0.8333
RFC 0.9167 0.9167 0.9167 0.9167 0.9167 0.875
EXTC 0.8333 0.875 0.9167 0.8333 0.8333 0.8333
Further experiments are related to transfer learn-
ing of the model trained on the data extracted from
the ElasticSearch repository. In particular, the Guava
repository has been used as a test set for this experi-
ment. Obtained results are reported in Table 5. The
first consideration to make is that the experiment was
successful as all the classifiers considered had at least
performances comparable to the previous cases, those
in which the experiment was limited to data extracted
from only one repository at a time. This means that
the results obtained can be generalized and that taking
process and impact metrics into account is important
in bug prediction.
The extra Trees classifier reaches an optimal ac-
curacy value of 97.35% for dataset D4, and it results
as the best performer overall. Random Forest reaches
comparable performance even if they are a little lower
than Extra Trees’ accuracy values. While Decision
Tree is the worst in this case although it still reaches
90% accuracy for the D1 dataset.
Table 5: Accuracy Results using Transfer Learning.
Classifier D1 D2 D3 D4 D5 D6
DTC 0.9008 0.8534 0.8547 0.8394 0.8715 0.8324
RFC 0.9595 0.9595 0.9665 0.9651 0.9637 0.9606
EXTC 0.9679 0.9665 0.9707 0.9735 0.9707 0.9721
ICSOFT 2024 - 19th International Conference on Software Technologies
424

5 THREATS TO VALIDITY
In this section, we discuss threats to the validity of the
study.
Construct validity: The validity of our study is
threatened by the validity of the source code measur-
ing method, which we used. We employ the runSZZ
method in this sense, which is widely utilized in other
research and is accessible to the public.
Internal validity: Elements that may sway our ob-
servations pose a threat to internal validity. Specif-
ically, whether the measurements are sufficient and
whether the parameters are relevant to our findings.
A meticulous data-gathering procedure was used for
this.
External validity: Our findings’ capacity to be
broadly applied poses a danger to external validity.
While we looked at three popular open-source sys-
tems with different sizes, domains, time frames, and
commit counts, we are conscious that more empirical
validation on commercial systems would be helpful
to strengthen our conclusions. The type of reported
flaws in commercial systems is different from those
of open source systems. Because the tools we utilized
are limited to Java applications, we were only able to
consider systems written in Java. This is another con-
straint of our work. As a result, we are unable to make
generalizations about projects from industrial settings
or systems built in other languages.
6 CONCLUSIONS
A bug indicates a fault that causes the software to mal-
function and is usually attributable to code errors. Not
all bugs are visible, in fact, some errors, due to the de-
velopment of the source code and rarely to the com-
piler, are imperceptible, in the sense that they do not
affect the functionality of the software.
At the same time, software evolution and mainte-
nance are important and ongoing processes that likely
result in the introduction of new bugs. Since it can re-
duce resource waste and aid in decision making, there
is therefore growing interest in evaluating and predict-
ing the time and money needed to fix bugs. Bug pre-
vention is therefore of fundamental importance, and
in this regard, this document proposes a pipeline for
just-in-time bug identification.
Specifically, the document focuses on a double ob-
jective, on the one hand identifying the set of pro-
cess metrics most suitable for bug detection, and on
the other evaluating whether the proposed approach
is also valid cross-project, thanks to transher learning.
The approach has been validated on three open-source
software systems and the results are very satisfactory.
Finally, to assess the effectiveness of our paradigm
in practice, we intend to carry out a controlled study
involving practitioners. This would enable defect pre-
diction to be more practically used and to assist with
real-time development tasks, including code writing
and/or code reviews.
REFERENCES
Ayewah, N., Pugh, W., Morgenthaler, J. D., Penix, J.,
and Zhou, Y. (2007). Evaluating static analysis de-
fect warnings on production software. In Proceed-
ings of the 7th ACM SIGPLAN-SIGSOFT workshop
on Program analysis for software tools and engineer-
ing, pages 1–8.
Cutler, A., Cutler, D. R., and Stevens, J. R. (2012). Random
forests. Ensemble machine learning: Methods and
applications, pages 157–175.
di Biase, M., Rastogi, A., Bruntink, M., and van Deursen,
A. (2019). The delta maintainability model: Measur-
ing maintainability of fine-grained code changes. In
2019 IEEE/ACM International Conference on Techni-
cal Debt (TechDebt), pages 113–122. IEEE.
Geurts, P., Ernst, D., and Wehenkel, L. (2006). Extremely
randomized trees. Machine learning, 63:3–42.
Khanan, C., Luewichana, W., Pruktharathikoon, K.,
Jiarpakdee, J., Tantithamthavorn, C., Choetkiertikul,
M., Ragkhitwetsagul, C., and Sunetnanta, T. (2021).
Jitbot: An explainable just-in-time defect prediction
bot. In Proceedings of the 35th IEEE/ACM Interna-
tional Conference on Automated Software Engineer-
ing, ASE ’20, page 1336–1339, New York, NY, USA.
Association for Computing Machinery.
Magee, J. F. (1964). Decision trees for decision making.
Harvard Business Review Brighton, MA, USA.
Malhotra, R. (2015). A systematic review of machine learn-
ing techniques for software fault prediction. Applied
Soft Computing, 27:504–518.
Marengo, A., Pagano, A., and Ladisa, L. (2018). Towards
a mobile augmented reality prototype for corporate
training: A new perspective. page 129 – 135. Cited
by: 8.
Nagwani, N. K. and Suri, J. S. (2023). An artificial intel-
ligence framework on software bug triaging, techno-
logical evolution, and future challenges: A review. In-
ternational Journal of Information Management Data
Insights, 3(1):100153.
Neelofar, Javed, M. Y., and Mohsin, H. (2012). An au-
tomated approach for software bug classification. In
2012 Sixth International Conference on Complex, In-
telligent, and Software Intensive Systems, pages 414–
419.
Osman, H. (2017). Empirically-Grounded Construction of
Bug Prediction and Detection Tools. PhD thesis, Uni-
versit
¨
at Bern.
Adopting Delta Maintainability Model for Just in Time Bug Prediction
425

Osman, H., Ghafari, M., and Nierstrasz, O. (2018). The
impact of feature selection on predicting the number
of bugs.
Rahman, F. and Devanbu, P. (2013). How, and why, process
metrics are better. In 2013 35th International Confer-
ence on Software Engineering (ICSE), pages 432–441.
Rodr
´
ıguez-P
´
erez, G., Robles, G., Serebrenik, A., Zaidman,
A., Germ
´
an, D. M., and Gonzalez-Barahona, J. M.
(2020). How bugs are born: a model to identify how
bugs are introduced in software components. Empiri-
cal Software Engineering, 25:1294–1340.
Seliya, N., Khoshgoftaar, T. M., and Hulse, J. V. (2010).
Predicting faults in high assurance software. 2010
IEEE 12th International Symposium on High Assur-
ance Systems Engineering, pages 26–34.
´
Sliwerski, J., Zimmermann, T., and Zeller, A. (2005). When
do changes induce fixes? ACM sigsoft software engi-
neering notes, 30(4):1–5.
Song, Q., Jia, Z., Shepperd, M., Ying, S., and Liu, J.
(2011). A general software defect-proneness predic-
tion framework. IEEE Transactions on Software En-
gineering, 37(3):356–370.
Tan, L., Liu, C., Li, Z., Wang, X., Zhou, Y., and Zhai, C.
(2014). Bug characteristics in open source software.
Empirical software engineering, 19:1665–1705.
Wang, S., Wang, J., Nam, J., and Nagappan, N. (2021).
Continuous software bug prediction. In Proceedings
of the 15th ACM / IEEE International Symposium
on Empirical Software Engineering and Measurement
(ESEM), ESEM ’21, New York, NY, USA. Associa-
tion for Computing Machinery.
Wen, M., Wu, R., Liu, Y., Tian, Y., Xie, X., Cheung, S.-C.,
and Su, Z. (2019). Exploring and exploiting the cor-
relations between bug-inducing and bug-fixing com-
mits. In Proceedings of the 2019 27th ACM Joint
Meeting on European Software Engineering Confer-
ence and Symposium on the Foundations of Software
Engineering, pages 326–337.
Zhang, F., Khomh, F., Zou, Y., and Hassan, A. E. (2012).
An empirical study on factors impacting bug fixing
time. In 2012 19th Working conference on reverse en-
gineering, pages 225–234. IEEE.
ICSOFT 2024 - 19th International Conference on Software Technologies
426
