
The Unreasonable Effectiveness of Artefacts and Documentation: An
Exploration of Consensus Using Multi-Agent Simulations in a Two-Team
Configuration
Johannes S. Vorster
1 a
and Louise Leenen
1,2 b
1
Department of Computer Science, University of Western Cape, South Africa
2
CAIR, South Africa
Keywords:
Consensus, Consensus Simulation, Stochastic Simulation, Synchronization, Multi-Agent Simulation,
Artefacts, Documentation.
Abstract:
Documentation and artefact generation is an essential part of business processes. This paper explores the
use of artefacts as a means of reaching consensus through the use of Multi-Agent Simulations. In particular
we investigate the time to reach consensus with and without the use of artefacts and show the efficiency of
artefacts as a means of facilitating consensus, perhaps more importantly, to create efficient consensus processes
in the face of difficult organizational communications channels. We found that polyarchies are highly efficient
at consensus formation, but are not realistic for larger organizations. For these organisations a small team
that facilitate consensus formation is nearly as efficient. The introduction of artefacts significantly improve
consensus formation in situations where intra-team communications causes delays in consensus formation.
1 INTRODUCTION
1.1 Organizational Context
Over the past two decades, the evolution of organiza-
tional structures and project strategies has been a key
discussion, driven by technology companies facing
rapid technological advancements, shifting competi-
tive landscapes, and changing customer expectations.
As innovation accelerates, businesses must adapt their
organizational setups and project delivery methods to
remain agile and responsive.
Notable transformations include changes in team
composition (Reagans et al., 2016), shifts from hier-
archical to lateral organizations (Keupp et al., 2012),
and network-like organizational structures (Chang
and Harrington, 2000). These changes often lead to
faster delivery and reduced resource expenditure, re-
sulting in better investment returns (Will et al., 2019).
Project complexity, marked by difficulties in
reaching consensus, is a major cause of delays and
failures (Al-Ahmad et al., 2009; Whitney and Daniels,
2013; Kian et al., 2016; Waheeb and Andersen, 2022).
a
https://orcid.org/0000-0001-6452-4186
b
https://orcid.org/0000-0002-9212-550X
During consensus-building, diverse teams must share
knowledge, reconcile differences, and collaboratively
develop solutions (Eden and Ackermann, 2010; Che-
ung et al., 2016).
1.2 Consensus Models
In formal settings, particularly for predicting eco-
nomic outcomes, human consensus is often achieved
through Delphi processes, where participants undergo
multiple rounds of anonymous feedback to converge
on a consensus. Alternative approaches include qual-
itative studies on social networks (Carter et al., 2015;
Jones and Shah, 2016), detailed interviews (Rosell
´
o
et al., 2010), and computational models (Yan et al.,
2017). This paper employs computational mod-
els while incorporating aspects of Delphi decision-
making.
Reaching consensus in Multi-Agent Systems
(MAS) is complex, with research spanning social sci-
ences, economic model simulations, and MAS con-
sensus algorithms. Social sciences have explored
crowd and voter behavior for decades, starting with
Dunbar (1998) on the ‘social brain,’ followed by
Stocker et al. (2001) on social information exchange,
and Leishman et al. (2009) on consensus group for-
Vorster, J. and Leenen, L.
The Unreasonable Effectiveness of Artefacts and Documentation: An Exploration of Consensus Using Multi-Agent Simulations in a Two-Team Configuration.
DOI: 10.5220/0012785300003758
Paper published under CC license (CC BY-NC-ND 4.0)
In Proceedings of the 14th International Conference on Simulation and Modeling Methodologies, Technologies and Applications (SIMULTECH 2024), pages 313-323
ISBN: 978-989-758-708-5; ISSN: 2184-2841
Proceedings Copyright © 2024 by SCITEPRESS – Science and Technology Publications, Lda.
313

mation, with further insights from Gilbert (2010).
MAS consensus algorithms focus on high-speed
applications, as exemplified by Amirkhani and
Barshooi (2022). Chang and Harrington (2004) pro-
posed a MAS framework for modeling organizations
to address economic questions, and Will et al. (2019)
explored the impact of organizational structure on in-
novation project selection, highlighting polyarchy, hi-
erarchical, and hybrid forms. This paper uses fully
connected polyarchies, as discussed in Vorster and
Leenen (2023a).
Subversive agent behavior has been studied across
various domains, including psychology (McDowell,
2002), business (Manky and Dolores, 2022), politics
(Barnes and Prior, 2009), and espionage (Evans and
Romerstein, 2012).
This work aligns with MAS in Computational
Economics (Tesfatsion and Judd, 2006) and Consen-
sus formation (Vorster and Leenen, 2023a).
1.3 Social Settings
In social networks, the topology and geospatial dis-
tribution of the population, along with their intercon-
nectedness, are crucial for shaping opinion dynam-
ics, such as voter views. Accurate spatial distribution
models are essential for modeling community behav-
ior (Amblard and Quattrociocchi, 2013).
The earliest computer-based consensus model was
developed by Johnson and Feinberg (1977), where
crowd members seek support from subsets to sway
the crowd towards a specific action. Consensus is
achieved by reducing opinion variability.
Subsequent studies used complex adaptive sys-
tems to examine virtual team behavior, highlighting
the importance of team cognition, trust, cohesion, and
conflict (Curs¸eu, 2006). Social group formation oc-
curs in two phases: initial interaction among closely
related individuals and broader community interac-
tion (Leishman et al., 2008).
The impact of network topologies on consensus
has been explored using various graphs, including
Erd
˝
os-R
´
enyi random graphs (Erd
˝
os et al., 1960; Am-
blard et al., 2015), Watts-Strogatz small-world net-
works (Watts and Strogatz, 1998a), and Barab
´
asi-
Albert scale-free networks (Barab
´
asi et al., 2000;
Leskovec and Mcauley, 2012), providing insights into
consensus dynamics in social and political contexts.
Pro-social behavior propagates through social in-
teractions (Christakis and Fowler, 2013; Keizer et al.,
2013; Tsvetkova and Macy, 2014). Dunbar’s ‘So-
cial Brain’ hypothesis suggests group size in apes
and humans is a function of language use rather than
grooming (Dunbar, 1998). Stocker et al. (2001) tested
this hypothesis by simulating individual influence and
idea communication, showing critical connectivity
levels are needed for consensus.
Michalski et al. (2022) explored the impact of so-
cial network connectivity on consensus with two op-
tions. Agents’ probabilistic beliefs evolved through
interactions, using various network topologies (com-
plete, cycle, wheel, Erd
˝
os-R
´
enyi, Watts-Strogatz,
Barab
´
asi-Albert). They found that complete networks
led to the fastest consensus, followed by wheel, scale-
free, random, cycle, and small-world topologies.
1.4 Subversive Agents
Research shows that constructive task conflict can en-
hance team decision-making and performance, espe-
cially in complex tasks involving uncertainty or sub-
jective factors (Bradley et al., 2015; Enyinda et al.,
2022; Kirschner et al., 2008; Badke-Schaub et al.,
2010; Paletz et al., 2017). Effective communication,
collaboration, and social skills are essential for lever-
aging task conflict benefits (Wu et al., 2017; Hirvo-
nen, 2019). Properly managed discourse, with is-
sues explicitly articulated and addressed, is crucial
(Holmes and Marra, 2004).
Xie et al. (2011) demonstrated that a small frac-
tion p of committed agents advocating an opposing
opinion can shift the majority opinion in a popula-
tion. Using a 2-option Erd
˝
os-R
´
enyi random graph
model, they showed that when the committed fraction
exceeds a critical threshold of about 10% (p
c
≈ 10%),
the time T
c
for the population to adopt the committed
opinion significantly decreases.
Iacopini et al. (2022) identified three behavioral
regimes in group-based consensus processes, intro-
ducing a susceptibility variable β. Small increases
in β initially enhance the committed minority’s influ-
ence (regime 1). At a critical β value, the entire popu-
lation adopts the minority’s views (regime 2). Further
increases isolate the committed minority, preserving
the original group’s beliefs (regime 3).
Vorster and Leenen (2023b) used stochastic MAS
simulations to study subversive agents’ impact on
consensus in project teams. These agents aim to delay
project delivery by influencing views and decisions.
They found that expanding options or polarizing the
group significantly delays consensus. Coordination
among subversive agents deeply influences outcomes,
and even a small minority can substantially prolong
consensus times (Vorster and Leenen, 2024).
SIMULTECH 2024 - 14th International Conference on Simulation and Modeling Methodologies, Technologies and Applications
314

1.5 Organizational Structure
Chang and Harrington (2004) described a scheme
for modeling organizations using multi-agent systems
(MAS) to address economic questions. Will et al.
(2019) later examined the role of organizational struc-
ture in innovation project selection, highlighting three
forms: polyarchy, hierarchical, and hybrids. In a pol-
yarchy, team members are fully connected and can
communicate across hierarchical boundaries.
Network topology significantly influences consen-
sus time. Michalski et al. (2022) found that pol-
yarchies yield the quickest consensus compared to
random (Erd
˝
os et al., 1960), small-world (Watts and
Strogatz, 1998b), and scale-free networks (Barab
´
asi
et al., 2000).
Will et al. (2019) also studied the economic im-
pact of organizational structure on risky project se-
lection, arguing that decision-making is influenced
by organizational structure, not just team evaluative
abilities. They used a mathematical model to ana-
lyze project selection dynamics, showing that hybrid
structures can have error management side effects.
Their work builds on earlier economic models by Sah
and Stiglitz (1984, 1988). Similarly, S
´
aenz-Royo and
Lozano-Rojo (2023) extended Chang and Harrington
(2004)’s work using simulated structures to investi-
gate innovation project selection.
Motivation for This Paper
Our earlier statistical analysis and MAS simulations
of consensus processes has shown the importance of
MAS in the study of consensus formation within or-
ganizations (Vorster and Leenen, 2023a). That study
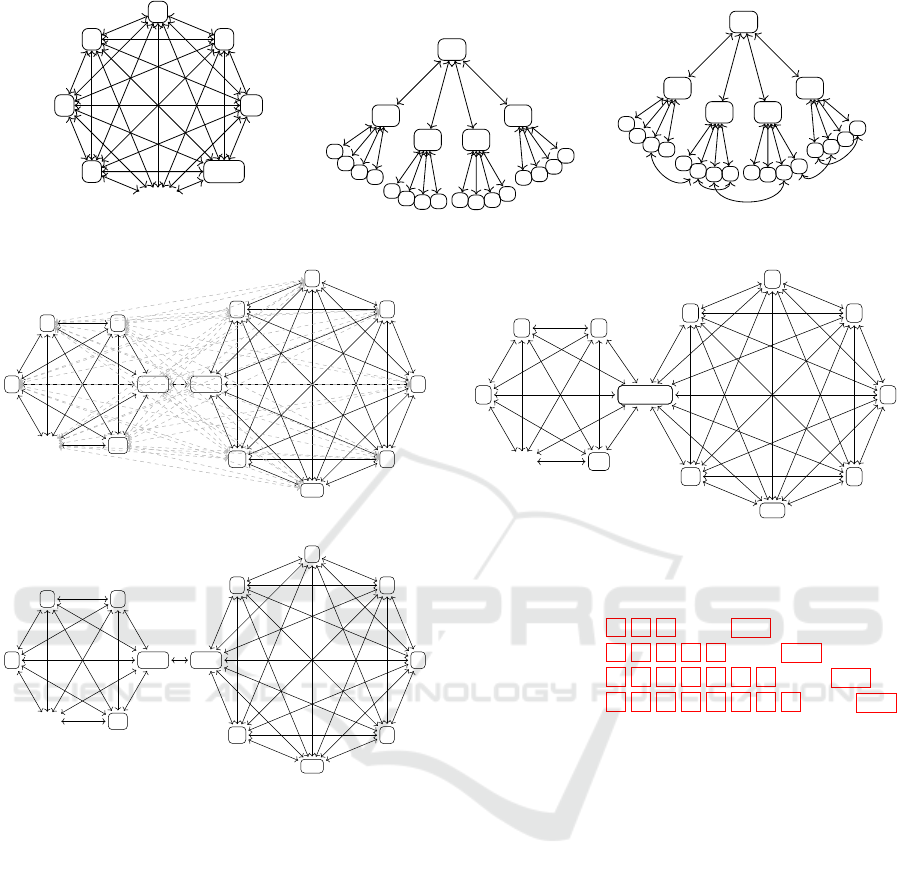
showed that within Polyarchies (Figure 1) the intro-
duction of artefacts (documentation) can increase the
formation of consensus by 30%. The formation of
consensus in social settings has been studied using
various ’random’ networks such as Erd
˝
os-R
´
enyi ran-
dom graphs, Watts-Strogatz small-world networks,
and Barab
´
asi-Albert scale-free networks, as men-
tioned earlier. However, these networks do not reflect
the reality of organisational structures.
Indeed, a Polyarchy is the consensus equivalent
of the spherical cow in physics. To study all organ-
isational hierarchies is also not viable, and thus we
select and study a specific organizational configura-
tion consisting of a group that provides requirement
specifications and another group that provides the im-
plementation (or realization) of the requirements.
In this paper we investigate the formation of con-
sensus across two teams where the one team is re-
sponsible for providing the requirements and the other
team needs to provide an implementation. We are
interested in the consensus processes across these
teams, given that both the teams form Polyarchies on
their own, see Figures 4, 5 and 6. The two teams can
communicate with each other through a small inter-
mediary team consisting of members of both teams
(usually the business analyst and solutions architect).
In this paper we present results from simulating these
organizational configurations and control the inter-
connectedness of these two groups, as well as the
impact of artefacts (documentation) on the ability to
reach consensus quickly on a large set of issues.
As can be expected, the bottleneck between the
two groups are pivotal to how fast consensus can be
reached across the two groups and there is no surprise
in finding that the configuration depicted in Figure 5
with one person representing the requirements team
talking to one person representing the implementation
team is the worst case scenario. How much will this
worst case improve if the requirements team gener-
ate artefacts that accurately and completely depict the
requirements? And similarly for the implementation
team.
Since the authors have extensive experience work-
ing for, working with, and consulting to such large
organizations, they have often seen that a thorough
documentation process is seen as a waste of time. We
would like to offer this research to at least theoreti-
cally prove the importance of thorough artefact gen-
eration.
2 METHODOLOGY
In this section we discuss the essential aspects of the
simulator focussing only on relevant topics to the be-
low experimental setup.
2.1 Teams and Topics
The members of the teams are agents in the MAS. To
be generic for later simulations with multiple teams,
we will denote the specification team as team a and
the implementation team as team b. There are
a
N
agents in the specification team, and
b
N agents in the
implementation team.
a
N ≪
b
N. In general we will
use a prefix small a and b to denote the teams in vari-
ables. Each agent keeps track of a number of top-
ics. The specification team has to consider and agree
on
a
B
max
topic and the implementation team
b
B
max
.
With
a
B
max
≪
b
B
max
because the implementation
details and topics to agree on are, as a rule, much
larger than the number of requirements topics. The
first
a
B
max
topic are the same for both teams. That is,
The Unreasonable Effectiveness of Artefacts and Documentation: An Exploration of Consensus Using Multi-Agent Simulations in a
Two-Team Configuration
315
N
N − 1
·· ·
1
2
3
4
5
Figure 1: Polyarchy
A0
B0
.
.
.
.
B1
.
.
.
.
B2
.
.
.
.
B3
.
.
.
.
Figure 2: Hierarchical.
A0
B0
.
.
.
.
B1
.
.
.
.
B2
.
.
.
.
B3
.
.
.
.
Figure 3: Hybrid.
spoc
M
···
12
3
spoc
N
···
5
4
3
2
1
Figure 4: Polyarchy Binary configuration.
spoc
M
···
12
3
spoc
N
···
5
4
3
2
1
Figure 5: Loose Binary configuration.
the implementation team must agree and reach con-
sensus with the specification team on the specifica-
tion.
2.2 Artefacts
The requirement specification artefact encodes the
topics sequentially one-to-one with the topics agents
keep track of. The specification contains
a
C
max
topics
and both the specification team and the implementa-
tion team will need to reach consensus on these spec-
ifications. It is so arranged and agreed that if an arte-
fact contain fewer topics than what agents discuss,
that is, if
a
C
max
<
a
B
max
, then the first
a
C
max
top-
ics of the agents coincide with the artefact’s topics. In
this arrangement it is possible to model incomplete
artefacts because artefacts can contain fewer topics
than what is needed to reach consensus.
SI Team
M
·· ·
12
3 SI Team
N
·· ·
5
4
3
2
1
Figure 6: Small Interaction Team Binary configuration.
Requirement Artefact
1 2
3
·· ·
a
C
max
Requirement Agents
1 2
3
4
5
·· ·
a
B
max
Implementation Artefact
1 2
3
4
5 6
7
·· ·
b
C
max
Implementation Agents
1 2
3
4
5 6
7
8
·· ·
b
B
max
Topic 1
Topic 2
·· ·
Figure 7: Topics across agents and artefacts.
Figure 7 provide a visual representation of the sit-
uation in terms of topics, with
a
C
max
≤
a
B
max
<
b
C
max
≤
a
B
max
.
Topic i is the same across all agents and artefacts
(in this specific simulation), but need not be in gen-
eral. Agents will set up meetings using their connec-
tivity graph, and will try and resolve topics until con-
sensus has been reached between all agents with each
other, and agents with the artefacts, on all topics.
2.3 Time, Duration, and Meetings
The simulation takes into account calendar time and
meeting duration. A limited number of topics can
be discussed per meeting. Agents will set up time
to meet (following earliest available time rules) with
each other if there are disagreements in their views.
Each meeting lasts a fixed time (30 minutes and 16
meetings per day). Within that meeting time-slot, the
number of topics that can be discussed and resolved
SIMULTECH 2024 - 14th International Conference on Simulation and Modeling Methodologies, Technologies and Applications
316

are determined stochastically (at least one and max-
imum ten). Three outcomes are possible for such a
discussed topic: (a) both agree on a new position in
the middle of their earlier positions (compromise con-
sensus), (b) the first agent convinces the second of its
view, and (c) visa-versa.
Agents can also choose to interact with an artefact
within each 30 minute time-slot. In that case the in-
teraction is similar to that of another agent, in that the
agent will select a random number (at least one, max-
imum ten) of topics where it is in disagreement with
the artefact. The three outcomes for each topic of in-
teraction are (a) the reader is partially convinced by
the artefact (its view changes) but it also updates the
artefact to the new view, (b) the reader is completely
convinced and fully internalizes the view expressed in
the artefact, and (c) the reader feels the artefact is in
error and corrects it by modifying it with the agent’s
current view on the topic.
Agents can only set up meetings with other agents
within their connectivity network. This connectivity
network is modelled as a directed graph with agents
as nodes and edges represent the ability to set up a
meeting and have a discussion. Agent i denoted by
node ν
i
can meet with agent j denoted by node ν
j
if
there is an edge within the graph from ν
i
to ν
j
. Agent
i, node i and ν
i
are all representations of the same
thing.
The simulation initializes each agent with a ran-
dom view on each topic. The simulation allows the
agents to set up meetings and discuss topics, or in-
teract with an artefact. One activity is allowed per
time-slot. The simulation counts time in measures of
time-slots. So that in the below graphs a time mea-
sure of 100 would mean that it is the 100
th
time-slot
from the start of the simulation. Simulations with
the same configuration are repeated numerous time
(sometimes up to 20000) to ensure statistically sig-
nificant and smooth results.
2.4 Measuring Consensus
In agent-based modelling, consensus between an
agent and the rest of its connected group on a specific
topic k is often expressed as the sum of differences be-
tween the views b
k
on topic k of agent i and all other
agents j, (see e.g. Wei et al. (2021)),
u
k
i
= −
N
∑
j=1
δ
i j
(b
k
i
− b
k
j
), i ∈ {1,2, ...,N}.
Where δ
i j
is a cost factor and we use δ
i j
= 1 if i
can schedule meetings with j and δ
i j
= 0 otherwise.
We however need to use absolute differences and sum
over all agents, all artefacts and all topics, for a dis-
cussion see Vorster and Leenen (2023a).
If I
ν
is the set of all agents and I
A
is the set of
all artefacts, then we define a measure of consensus
for agents with each other (i, j ∈ I
ν
) and agents with
artefacts (i ∈ I
ν
, p ∈ I
A
) on a specific topic k as
u
k
i j
= δ
i j
|b
k
i
− b
k
j
| and u
k
ip
= δ
ip
|b
k
i
− c
k
p
|
which leads to an overall measure of consensus for an
agent i with agents and artefacts it has contact with as
u
k
i
=
∑
j∈I
ν
δ
i j
|b
k
i
− b
k
j
| +
∑
p∈I
A
δ
ip
|b
k
i
− c
k
p
|. (1)
That is, the level of consensus that an agent i has rel-
ative to the rest of the group on a topic k, is the sum
of absolute differences between that view b
k
i
and the
views on the same topic for all other agents, b
k
j
that
it is connected to, (δ
i j
> 0), as well as the same mea-
sure for that topic in all artefacts, c
k
p
, to which it has
access.
We can now define an overall level of consensus
over all topics, agents, and artefacts as
u =
∑
i∈I
ν
∑
j∈I
ν
k
max
i j
∑
k=1
δ
i j
|b
k
i
− b
k
j
| +
∑
i∈I
ν
∑
p∈I
A
k
max
ip
∑
k=1
δ
ip
|b
k
i
− c
k
p
|.
(2)
Some care needs to be taken with k since it runs
from 1 to some maximum number of topics which
are dependent on the agents and artefacts being eval-
uated, see Figure 7. For example, if agent i is
from team a and agent j from team b, then k
max
i j
=
min(
a
B
max
,
b
B
max
). In reality (in the software code)
each agent keeps a list of its views, as does artefacts,
so that a direct sum of absolute differences only runs
to the minimum length of the two applicable lists.
2.5 Time and Effort to Reach
Consensus
Each agent keeps track of what they do in each time-
step and they record this in their dairy so that d
t
i
is the
entry for agent i’s diary at time t. It records the agent
number it met with, or ’z’ if it did nothing at time t.
The effort, e
max
, to reach consensus is the sum of all
actions taken by all agents, that is
e
max
=
t
max
∑
t=1
N
∑
i=1
busy(d
t
i
), busy(d
t
i
) =
(
0 d
t
i
= ’z’
1 otherwise,
(3)
where t
max
is the total time it took to reach consen-
sus. Since each agent will always take some action
if an action is available, the simulation terminates
at time t
max
when d
t
i
= ’z’ ∀i ∈ I
ν
. That is, when
The Unreasonable Effectiveness of Artefacts and Documentation: An Exploration of Consensus Using Multi-Agent Simulations in a
Two-Team Configuration
317

no agent takes any actions any more, the simulation
stops. Both e
max
and t
max
will be determined by sim-
ulation and will differ on each stochastic simulation.
For each configuration a large number of simulations
were run to determine e
max
and t
max
accurately.
2.6 Meeting Efficiency
The last topic and variable of interest here are the effi-
ciency of meetings. A meeting will discuss a random
number of topics from one to nine, with an average
of five in our simulations. As we will see shortly, this
average of five topics per meeting is only realistic at
the start of the project, and as topics gets resolved,
it starts to happen that there are no longer five top-
ics of discord left between agents. When this hap-
pens, the meeting efficiency starts to drop. If ¯z(t) is
the observed average number of topics discussed in
meetings at time t and ¯z
max
is the maximum expected
number of topics, then we define a measure of meet-
ing efficiency at time t as
e(t) = ¯z(t)/¯z
max
(4)
Although it is possible to measure the effective-
ness of individual agents, here we are interested in
the effectiveness of meetings by the team. In the be-
low graphs and results we plot the meeting efficiency
of team a, the requirements team, independently from
the meeting efficiency of the implementation team b.
2.7 Mathematical Model Summary
The following are important concepts for the remain-
der of the paper:
• u – measure of the overall consensus in the group
and is the pairwise sum over all differences in
views over all members and artefacts;
• u
k
i
– measure of the difference on a spesific topic
(k) between all group memers and a specific mem-
ber i, and is the pairwise sum of differences in
view between i and all other members and arte-
facts;
• t
max
– the time to reach consensus for a spe-
cific scenario (group-size, artefacts, problem-
size), which is averaged over many runs;
• e
max
– the effort to reach consensus (which is the
sum of all meetings) to reach consensus.
3 EXPERIMENTAL RESULTS
In this sections the basics of the simulation and impor-
tant measurements are discussed together with results
that can be used as a baseline for later results.
3.1 Experimental Configuration
The primary variables that are changed are the group
size, from 2 to 20, and the presense of artefacts. Vari-
ables that can change but are kept constant are the
number of topics for discussion in meetings and in
artefacts. It was shown earlier (Vorster and Leenen,
2023a) that the time and effort to reach consensus are
linear with the number of topics, and thus for these
experiments we kept the topics constant at 50 since it
does not play a role in the results we are discussing
in this paper. Number of topics discussed per meeting
is randomized from 1 to 10. The pseudo-Python code
for meetings between agents i and j is:
random.shuffle(topics)
issuesToDiscuss=randint(1,11)
for k in topics:
if agent[i].view[k]==agent[j].view[k]:
continue
rnd = randint(0,3)
if (rnd==0):
val = int((agent[i].view[k]
+ agent[j].view[k]))/2.0)
agent[i].view[k]=agent[j].view[k]=val
if (rnd==1):
agent[j].view[k] = agent[i].view[k]
if (rnd==2):
agent[i].view[k] = agent[j].view[k]
issuesToDiscuss-=1#
if issuesToDiscuss<=0: return
3.2 Polyarchies
As a first experiment, and as a way to construct a base-
line for comparison, we start with two teams; team a
with seven team members (the requirements specifi-
cation team); and team b, the implementation team,
with 14 members. In the next section we generalize
team size. The two teams are allowed to set up meet-
ings with members in the opposite team as they see
fit. That is, the organization acts like a polyarchy, see
Figure 4.
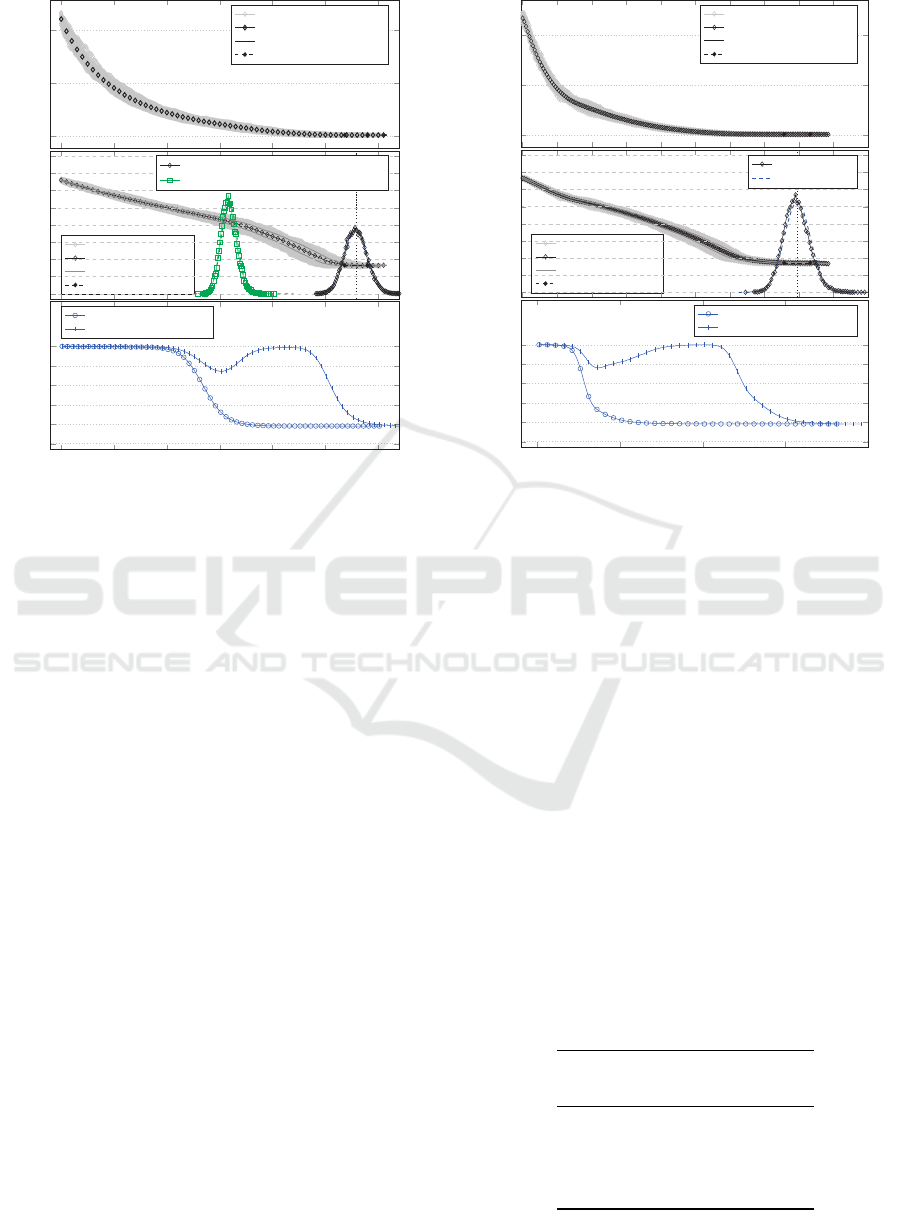
Stochastic simulations were repeated 20000
times. The averages for all the relevant variables were
computed. Figure 8 shows the results using the con-
sensus measure (top) and the same measure but using
logu (middle). The consensus measure decreases ex-
ponentially (linear on log-scale) over time until con-
sensus is reached. A mean time of 279 (σ = 10.7, n =
20000) was recorded.
The introduction of artefacts, a requirements spec-
ification artefact and an implementation specification
SIMULTECH 2024 - 14th International Conference on Simulation and Modeling Methodologies, Technologies and Applications
318
Polyarchy without artefacts
0
1
2
·10
6
Consensus (u)
Consensus for 20 simulations
Averaged Consensus
1-σ
Final Consensus 1-σ
8
10
12
14
16
Consensus (logu)
logu for 20 simulations
logu averaged
1-σ
Final discord 1-σ
0
1
2
3
4
5
6
7
8
Histogram [%]
Histogram of t
max
(no artefact) N (279,10.7)
Histogram of t
max
(with artefact) N (159,7.57)
0
50
100
150
200
250
300
0
20
40
60
80
100
Time (t
max
)
Meeting efficiency [%]
Topics per meeting – team a
Topics per meeting – team b
Figure 8: (Top) Various simulations of the 7-group showing
Figure 8: (Top) Various simulations of the 7-group showing
the consensus measure over time. (Middle) The same data
as in top graph, but now using log
e
(consensus). Histogram
of the time it takes to reach consensus over many such runs
(µ = 279, σ = 10.7, n=20000) and Normal and Lognormal
fits to the histogram data. The central (green) histogram is
the same as that of Figure 9 transposed here for comparison
of how much artefacts shifts the time to reach consensus.
(Bottom) Meeting effectiveness graphs for the two groups.
artefact, led to significant improvements in time to
reach consensus, see and compare Figure 9, with a
mean time to reach consensus now shifting to 159
(σ = 7.57,n = 20000). This is an improvement of
43.0%, or, conversely, not using an artefact will in-
crease the time to reach consensus by 75.5%. The
middle plot of Figure 8 shows both the histogram for
time to reach consensus with and without an artefact
for a visual reference of how significant this improve-
ment is.
The productivity of meetings in the two teams are
also interesting and can be divided into four phases,
Figures 8 and 9 (bottom). During phase 1, both teams
are engaged in trying to reach consensus on the re-
quirements topics and meetings are highly effective,
since there are significant numbers of topics to dis-
cuss. In phase 2, team a’s meeting efficiency steadily
reduces as the meetings become more inefficient since
there are no longer as many topics available to make
every meeting effective, for both teams. During phase
3 the team dynamics shifts, with team a’s meetings
being very ineffective, mostly dealing with one-topic
Polyarchy with artefacts
0
1
2
·10
6
Consensus (u)
Consensus for 20 simulations
Averaged Consensus
1-σ
Final Consensus 1-σ
8
10
12
14
16
Consensus (logu)
logu for 20 simulations
logu averaged
1-σ
Final Consensus 1-σ
0
1
2
3
4
5
6
7
8
Histogram [%]
Histogram of t
max
N (159,7.57)
0
50
100
150
200
0
20
40
60
80
100
Time (t
max
)
Meeting efficiency [%]
Topics per meeting for group a
Topics per meeting for group b
Figure 9: (Top) Various simulations of the 7-group showing
the consensus measure over time. (Middle) The same data
as in top graph, but now using log
e
(consensus). Histogram
of the time it takes to reach consensus over many such runs
(µ = 159, σ = 10.7, n=20000) and Normal and Lognormal
fits to the histogram data. (Bottom) Meeting effectiveness
for the two groups.
discussions while team b’s meetings remain highly ef-
ficient as they are trying to reach consensus on the im-
plementation specification topics, taking specific is-
sues back to team a as they surface. Lastly, in phase 4,
the topics for discussion for the implementation also
reduce in number and meeting efficiency decreases,
until close to when consensus is reached, when all
meetings, in all teams are highly inefficient and only
one-topic meetings occur.
These four phases are present in both cases with
and without artefacts. When artefacts are present, the
phases are accelerated, see Table 1. The largest phase
contraction happens in phase 1, with a significant re-
duction in time due to the presence of an artefact. Per-
Table 1: Length of phases in the meeting productivity mea-
sure.
Without With
artefact artefact
Phase 1 100 20
Phase 2 80 60
Phase 3 50 30
Phase 4 50 50
The Unreasonable Effectiveness of Artefacts and Documentation: An Exploration of Consensus Using Multi-Agent Simulations in a
Two-Team Configuration
319
haps a surprising result, that warrants further study,
is that it seems that the size of phase 4 is unaffected
by the artefacts. That is, the phase to resolve the fi-
nal small outstanding issues does not seem to benefit
from the presence of artefacts. This observation will
be explored later in the discussion section.
3.3 Inter-Team Communication
In the previous section, the aim was to identify the
characteristics of consensus formation for two teams
that are highly integrated in terms of their inter-team
communications ability. That is, for a polyarchy, any
member of the teams can talk to any other member,
both within their own and the other team. A Pol-
yarchical interaction network is feasible in smaller
organisations, but becomes infeasible as organization
grows and formal structures start shaping who talks to
who.
Here we investigate consensus formation for two
additional communications configurations; namely
team a and b highly disconnected and two semi-
connected teams.
In the case of the highly disconnected teams, see
Figure 5, the communications channel between the
two teams are though a single link form by one
member from each team. This is somewhat of a
’round-cow’, approximation, it is often the case that
teams need to communicate with other teams though
a ’spoc’, a single point of contact. The aim of such a
person is to remove noise from the rest of the team by
having external teams work though this spoc.
The third communications model investigated was
that of a small two-person interaction team (the SI
team), see Figure 6. This is a model often seen within
large organisations where the business analyst and the
solutions architect form a team what jointly goes to
both business meetings for requirements solicitation
and technical meetings for implementation design. In
this model the two-team are both connected to all
team members of both teams.
The primary measure for these scenarios is time
to reach consensus under different team sizes to pro-
file the consensus process and to better understand the
ratios involved. That is, how do the time to reach con-
sensus differ for the three organizational communica-
tions models between team a and b (polyarchy, SI-
team as mediators, and spoc as mediators) and what
is the effect of using artefacts to capture topics and
consensus discussions.
For each of the three communications models, the
team size is varied, with the fixed ratio of 1:2 for the
team sizes of team a and b. The size of team a is
ranged from 1 to 20, which leads to an overall project
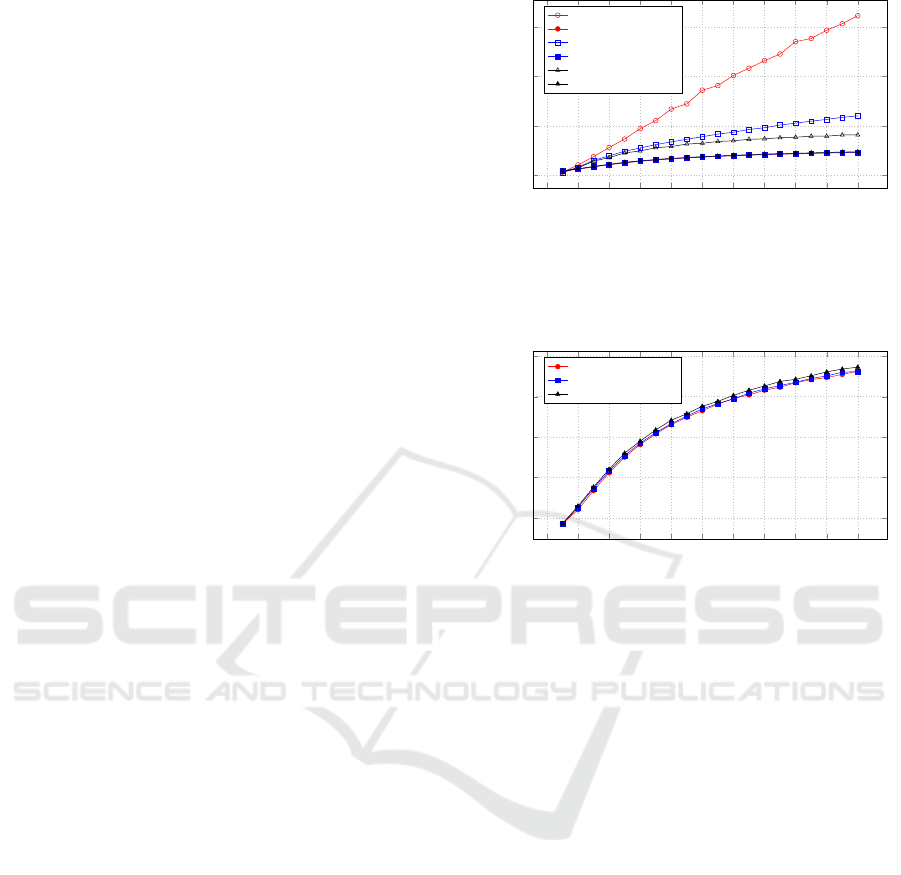
0 2 4
6
8 10 12 14
16
18 20
0
500
1,000
1,500
Size of Team a
Time
Spoc, No artefacts
Spoc with artefacts
SI team, No artefacts
SI team with artefacts
Polyarchicy, no artefacts
Polyarchy with artefacts
Figure 10: Time to reach consensus under different team
configurations. The graphs for ’Spoc with artefacts’, ’SI
team with artefacts’, and ’Polyarchy with artefacts’ are so
similar they appear on top of each other at this scale and are
re-drawn in Figure 11.
0 2 4
6
8 10 12 14
16
18 20
50
100
150
200
250
Size of Team a
Time
Spoc with artefacts
SI team with artefacts
Polyarchy with artefacts
Figure 11: Time to reach consensus under different team
configurations with artefacts.
team size ranging from 3 to 60 and for each such team
size the simulation is executed 200 times to reach sta-
tistical stability.
The results are shown in Figure 10. The data de-
picted in this figure lead to a number of striking con-
clusions, some obvious, others only after reflection.
A communications strategy that limits teams talk-
ing to each other, such as the spoc strategy, leads
to very slow consensus formation. This is expected
since the communications channel through which in-
formation flows between the two teams are highly
limited. The spoc-spoc meetings discuss on average ¯z
topics per meeting (five in our case), see section 2.6.
The SI team is effective in terms of time to reach
consensus given how small the team is, compared to
the highly effective polyarchy strategy. From this data
it is clear why larger organizations opt for this model;
it leads to reasonable times, while still keeping the
team structure intact. The success here is due to the
fact that the SI team can talk to anyone in both teams,
breaking the bottleneck observed in the spoc model,
and thus allowing information to flow much faster be-
tween the teams. It should be obvious that by making
the SI team bigger the situation tends more towards a
polyarchy and thus the time to reach consensus will
approach that of a polyarchy. However, from a prac-
SIMULTECH 2024 - 14th International Conference on Simulation and Modeling Methodologies, Technologies and Applications
320

tical standpoint it seems that a small SI team derives
enough benefit to be a good strategy.
Turning to the effect of artefacts, the results for
the three scenarios are so close, see also Figure 11,
that we double checked the simulation configuration.
The results are surprising to us. The effect of using
artefacts is that it eliminates delays in time to reach
consensus caused by organizational structure. The
agents efficiently use documentation to communicate
across team boundaries voiding any delays that could
be caused by inter-team structure. This result will be
further addressed in the discussion section.
4 DISCUSSION
The results obtained in the previous sections in con-
junction with the earlier discussion on meeting effi-
ciency, paints an interesting picture of project deliv-
ery which is applicable to larger organizations and
projects.
Some caution is appropriate when interpreting
the efficiencies obtained by using documentation as
shown above. These agents are extremely diligent
in following the RTFM (read the documentation) in-
structions. More so than what we think humans are
capable of. That is, the improvements caused by arte-
fact usage are (in our view) an optimistic view of the
situation and in real-world situations people will not
first read the documentation and then have a meet-
ing. That goes against human nature and experience.
Thus, even though these results demonstrate the value
of documentation, further modelling is needed to ex-
tend the agent’s behaviour to reflect the diversity of
human behaviour (some people like to read, some to
write, some to talk). We plan to publish in a follow-up
paper these effects, for example, the effect that only
one documenter has on the efficiency of the team, and
the time to reach consensus.
Meeting productivity can be used to break the con-
sensus formation process into four phases, see Ta-
ble 1 and Figures 8 and 9. The data suggests that
the most significant contribution to improvements in
time to reach consensus is in phase 1. This is in line
with research showing that the most significant reason
for project delays and failures are due to early mis-
understanding, miscommunication and lack of reach-
ing consensus (Al-Ahmad et al., 2009; Whitney and
Daniels, 2013; Kian et al., 2016; Waheeb and Ander-
sen, 2022).
The results obtained here supports the notion that
thorough and early generation of artefacts signifi-
cantly improves overall project delivery times though
the generation of consensus. That is, artefacts are a
highly effective way to reach consensus as well as im-
prove the overall success of the project, ... if they are
read.
5 CONCLUSION AND FUTURE
WORK
Earlier research on the causes of project failures, de-
lays, and cost overruns have identified lack of con-
sensus as one of the key contributing factors. The
consensus formation process is time-consuming, and
often left out of project planning or its effort is under-
estimated.
This paper investigated the formation of consen-
sus when the project consists of a two-team approach,
where the first team generates the requirements and
the second team is responsible for the implementa-
tion. Here we looked at the formation of consensus
on various topics, that is, the process to reach consen-
sus on the requirements and implementation plan.
We showed that in such a team configuration,
the more team-members are allowed to communicate
inter-team, the faster consensus is reached. This is not
always feasible, especially in larger organizations. A
small multi-skilled team that form a group and talk to
both teams are very efficient at creating consensus.
The introduction of artefacts (documentation)
greatly improves the time to reach consensus and
eliminates inefficiencies in the inter-team communi-
cations structure. Artefacts significantly improve time
to reach consensus irrespective the inter-team com-
munications model.
This research suggests further work is needed to
understand the efficiency phases that were identified,
and in particular, ways to eliminate or improve situ-
ations where one-topic meetings dominate. This re-
search suggests that different meeting cultures should
be considered earlier rather than later in project life
cycle, to avoid one-topic meetings and thus improve
delivery time and consensus formation.
Further understanding of the effect of artefacts
in consensus formation can benefit from studies into
the balance between artefact generation and meetings
based on individual preference. For example, what is
the benefit of having 10% of team members focus on
artefact generation, versus a lower (or higher) number.
What is clear is that someone that likes to document
topics are worth their weight in gold (as the saying
goes).
Lastly, it can be argtued that artefacts have more
authority and thus that people would be lesss likely
to modify them. This should be modelled, perhaps
by setting up meetings with the document author, in-
The Unreasonable Effectiveness of Artefacts and Documentation: An Exploration of Consensus Using Multi-Agent Simulations in a
Two-Team Configuration
321

droducing a bottleneck that would reduce the effec-
tiveness of artefacts, and should be explored further
using models.
REFERENCES
Al-Ahmad, W., Al-Fagih, K., Khanfar, K., Alsamara, K.,
Abuleil, S., and Abu-Salem, H. (2009). A taxonomy
of an it project failure: root causes. International
Management Review, 5(1):93.
Amblard, F., Bouadjio-Boulic, A., Guti
´
errez, C. S., and
Gaudou, B. (2015). Which models are used in social
simulation to generate social networks? a review of
17 years of publications in jasss. pages 4021–4032.
IEEE.
Amblard, F. and Quattrociocchi, W. (2013). Social net-
works and spatial distribution. Simulating Social
Complexity: A Handbook, pages 401–430.
Amirkhani, A. and Barshooi, A. H. (2022). Consensus in
multi-agent systems: a review. Artificial Intelligence
Review, 55(5):3897–3935.
Badke-Schaub, P., Goldschmidt, G., and Meijer, M. (2010).
How does cognitive conflict in design teams support
the development of creative ideas? Creativity and In-
novation Management, 19(2):119–133.
Barab
´
asi, A.-L., Albert, R., and Jeong, H. (2000). Scale-
free characteristics of random networks: the topology
of the world-wide web. Physica A: statistical mechan-
ics and its applications, 281(1-4):69–77.
Barnes, M. and Prior, D. (2009). Subversive citizens: Power,
agency and resistance in public services. Policy Press,
Bristol, UK.
Bradley, B. H., Anderson, H. J., Baur, J. E., and Klotz,
A. C. (2015). When conflict helps: Integrating evi-
dence for beneficial conflict in groups and teams un-
der three perspectives. Group Dynamics: Theory, Re-
search, and Practice, 19(4):243.
Carter, D. R., DeChurch, L. A., Braun, M. T., and Con-
tractor, N. S. (2015). Social network approaches to
leadership: An integrative conceptual review. Journal
of Applied Psychology, 100(3):597–622.
Chang, M.-H. and Harrington, J. E. (2000). Centralization
vs. decentralization in a multi-unit organization: A
computational model of a retail chain as a multi-agent
adaptive system. Management Science, 46(11):1427–
1440.
Chang, M.-h. and Harrington, J. E. (2004). Agent-based
models of organizations working paper, no. 515.
Cheung, S. Y., Gong, Y., Wang, M., Zhou, L., and Shi, J.
(2016). When and how does functional diversity in-
fluence team innovation? the mediating role of knowl-
edge sharing and the moderation role of affect-based
trust in a team. Human relations, 69(7):1507–1531.
Christakis, N. A. and Fowler, J. H. (2013). Social contagion
theory: examining dynamic social networks and hu-
man behavior. Statistics in medicine, 32(4):556–577.
Curs¸eu, P. L. (2006). Emergent states in virtual teams: A
complex adaptive systems perspective:. Journal of In-
formation Technology.
Dunbar, R. I. (1998). The social brain hypothesis. Evo-
lutionary Anthropology: Issues, News, and Reviews:
Issues, News, and Reviews, 6(5):178–190.
Eden, C. and Ackermann, F. (2010). Decision making in
groups: Theory and practice. Handbook of decision
making, pages 231–272.
Enyinda, C. I., Blankson, C., Cao, G., and Enyinda, I. E.
(2022). Why cannot we all just get along? re-
solving customer-focused team interface conflicts in a
b2b firm leveraging ahp-based multi-criteria decision-
making. Journal of Business & Industrial Marketing.
Erd
˝
os, P., R
´
enyi, A., et al. (1960). On the evolution of
random graphs. Publ. Math. Inst. Hung. Acad. Sci,
5(1):17–60.
Evans, M. S. and Romerstein, H. (2012). Stalin’s secret
agents: the subversion of Roosevelt’s government. Si-
mon and Schuster, New York, USA.
Gilbert, G. N. (2010). Computational social science, vol-
ume 21. Sage, Computational Social Science gilbert.
Hirvonen, P. (2019). Positioning, conflict, and dialogue in
management teams. Qualitative Research in Organi-
zations and Management: An International Journal,
14(4):444–464.
Holmes, J. and Marra, M. (2004). Leadership and manag-
ing conflict in meetings. Pragmatics. Quarterly Pub-
lication of the International Pragmatics Association
(IPrA), 14(4):439–462.
Iacopini, I., Petri, G., Baronchelli, A., and Barrat, A.
(2022). Group interactions modulate critical mass
dynamics in social convention. Communications
Physics, 5(1):64.
Johnson, N. R. and Feinberg, W. E. (1977). A computer
simulation of the emergence of consensus in crowds.
American Sociological Review, pages 505–521.
Jones, S. L. and Shah, P. P. (2016). Diagnosing the locus of
trust: A temporal perspective for trustor, trustee and
dyadic influences on perceived trustworthiness. Jour-
nal of Applied Psychology, 101:392–414.
Keizer, K., Lindenberg, S., and Steg, L. (2013). The impor-
tance of demonstratively restoring order. PloS one,
8(6):e65137.
Keupp, M. M., Palmi
´
e, M., and Gassmann, O. (2012). The
strategic management of innovation: A systematic re-
view and paths for future research. International jour-
nal of management reviews, 14(4):367–390.
Kian, M. E., Sun, M., and Bosch
´
e, F. (2016). A consistency-
checking consensus-building method to assess com-
plexity of energy megaprojects. Procedia-social and
behavioral sciences, 226:43–50.
Kirschner, P. A., Beers, P. J., Boshuizen, H. P., and Gi-
jselaers, W. H. (2008). Coercing shared knowledge
in collaborative learning environments. Computers in
human behavior, 24(2):403–420.
Leishman, T. G., Green, D. G., and Driver, S. (2008). Self-
organization in simulated social networks. null.
Leishman, T. G., Green, D. G., and Driver, S. (2009).
Self-organization in simulated social networks. In
SIMULTECH 2024 - 14th International Conference on Simulation and Modeling Methodologies, Technologies and Applications
322

Computer-Mediated Social Networking: First Inter-
national Conference, ICCMSN 2008, Dunedin, New
Zealand, June 11-13, 2008, Revised Selected Papers,
pages 150–156. Springer.
Leskovec, J. and Mcauley, J. (2012). Learning to discover
social circles in ego networks. Advances in neural
information processing systems, 25.
Manky, O. and Dolores, J. (2022). Subversive en-
trepreneurs: Business agency and commodification of
peruvian higher education (1992–2012). Latin Amer-
ican Perspectives, 49(3):162–180.
McDowell, K. (2002). Roll of thunder, hear my cry: A
culturally specific, subversive concept of child agency.
Children’s Literature in Education, 33:213–225.
Michalski, R., Serwata, D., Nurek, M., Szymanski, B. K.,
Kazienko, P., and Jia, T. (2022). Temporal network
epistemology: On reaching consensus in a real-world
setting. Chaos: An Interdisciplinary Journal of Non-
linear Science, 32(6).
Paletz, S. B., Chan, J., and Schunn, C. D. (2017). The dy-
namics of micro-conflicts and uncertainty in success-
ful and unsuccessful design teams. Design Studies,
50:39–69.
Reagans, R., Miron-Spektor, E., and Argote, L. (2016).
Knowledge utilization, coordination, and team perfor-
mance. Organization Science, 27(5):1108–1124.
Rosell
´
o, L., Prats, F., Agell, N., and S
´
anchez, M. (2010).
Measuring consensus in group decisions by means of
qualitative reasoning. International Journal of Ap-
proximate Reasoning, 51(4):441–452.
S
´
aenz-Royo, C. and Lozano-Rojo, A. (2023). Authoritar-
ianism versus participation in innovation decisions.
Technovation, 124:102741.
Sah, R. K. and Stiglitz, J. E. (1984). The architecture of eco-
nomic systems: Hierarchies and polyarchies. Techni-
cal report, National Bureau of Economic Research.
Sah, R. K. and Stiglitz, J. E. (1988). Committees, hi-
erarchies and polyarchies. The Economic Journal,
98(391):451–470.
Stocker, R., Green, D. G., and Newth, D. (2001). Consensus
and cohesion in simulated social networks. Journal of
Artificial Societies and Social Simulation, 4(4).
Tesfatsion, L. and Judd, K. L. (2006). Handbook of compu-
tational economics: agent-based computational eco-
nomics. Elsevier, Amsterdam, The Netherlands.
Tsvetkova, M. and Macy, M. W. (2014). The social conta-
gion of generosity. PloS one, 9(2):e87275.
Vorster, J. and Leenen, L. (2023a). Consensus simulator for
organisational structures. In Proceedings of the 13th
International Conference on Simulation and Modeling
Methodologies, Technologies and Applications, pages
15–26.
Vorster, J. and Leenen, L. (2023b). Exploring the effects of
subversive agents on consensus-seeking processes us-
ing a multi-agent simulator. In Proceedings of the 13th
International Conference on Simulation and Modeling
Methodologies, Technologies and Applications, pages
104–114.
Vorster, J. and Leenen, L. (2024). Covert subversive agents
and consensus disruption on large projects. In Pro-
ceedings of the 19th International Conference on Cu-
ber Warfare and Security, Reeding, UK, pages 421–
429.
Waheeb, R. A. and Andersen, B. S. (2022). Causes of
problems in post-disaster emergency re-construction
projects—iraq as a case study. Public Works Manage-
ment & Policy, 27(1):61–97.
Watts, D. J. and Strogatz, S. H. (1998a). Collective dynam-
ics of small-world networks. Nature.
Watts, D. J. and Strogatz, S. H. (1998b). Collec-
tive dynamics of ‘small-world’networks. Nature,
393(6684):440–442.
Wei, Q., Wang, X., Zhong, X., and Wu, N. (2021). Consen-
sus control of leader-following multi-agent systems
in directed topology with heterogeneous disturbances.
IEEE/CAA Journal of Automatica Sinica, 8(2):423–
431.
Whitney, K. M. and Daniels, C. B. (2013). The root cause
of failure in complex it projects: Complexity itself.
Procedia Computer Science, 20:325–330.
Will, M. G., Al-Kfairy, M., and Mellor, R. B. (2019). How
organizational structure transforms risky innovations
into performance–a computer simulation. Simulation
Modelling Practice and Theory, 94:264–285.
Wu, G., Liu, C., Zhao, X., and Zuo, J. (2017). Investigat-
ing the relationship between communication-conflict
interaction and project success among construction
project teams. International Journal of Project Man-
agement, 35(8):1466–1482.
Xie, J., Sreenivasan, S., Korniss, G., Zhang, W., Lim,
C., and Szymanski, B. K. (2011). Social consensus
through the influence of committed minorities. Phys-
ical Review E, 84(1):011130.
Yan, H.-B., Ma, T., and Huynh, V.-N. (2017). On qualitative
multi-attribute group decision making and its consen-
sus measure: A probability based perspective. Omega,
70:94–117.
The Unreasonable Effectiveness of Artefacts and Documentation: An Exploration of Consensus Using Multi-Agent Simulations in a
Two-Team Configuration
323
