
Real-Time Equipment Health Monitoring Using Unsupervised Learning
Techniques
Nadeem Iftikhar
a
and Finn Ebertsen Nordbjerg
Centre for Industrial Digital Transformation, University College of Northern Denmark, Aalborg 9200, Denmark
Keywords:
Equipment Health Indication, Real-Time Monitoring, Sensor Data, Unsupervised Learning, Anomaly
Detection.
Abstract:
Reducing unplanned downtime requires monitoring of equipment health. This may not be possible in many
cases as traditional health monitoring systems often rely on the use of historical data and maintenance infor-
mation which is not always available, especially for small and medium-sized enterprises. This paper presents
a practical approach that uses sensor data for real-time equipment health indication. The methodology pro-
posed consists of a set of steps. It starts with feature engineering which may include feature extraction to
transform raw sensor data into a format more suitable for analysis. Anomaly detection follows next, where
various techniques are employed to find any deviations in the engineered features indicating potential equip-
ment deterioration or abrupt failures. Then comes the most important stages equipment health indication and
alert generation. These stages provide timely information about the equipment’s condition and any necessary
interventions. These steps make it possible for such an approach to be effective even when there is little or no
historical data available. The applicability of this approach is validated through a lab-based case study.
1 INTRODUCTION
Monitoring machinery and systems’ health is very
important through the equipment health indication
(EHI). This enables early detection of issues based on
real-time data, even when there are no predictive ca-
pabilities to forecast faults in future. The proposed
approach, therefore, improves safety and reliability
in production operations by reducing time for equip-
ment repair and maintenance expenses. Typical meth-
ods employed for EHI usually requires lots of histori-
cal data, maintenance records, particular sensor types
and expert advice for technical purposes. This can
be a challenge to SMEs that might not have enough
resources or expertise. This paper presents a contem-
porary approach of performing EHI using real-time
data, which does eliminate the need for extensive his-
torical data as well as maintenance details. The pro-
posed methodology is divided into two main stages:
unsupervised feature engineering that involves feature
extraction; then proceeded by unsupervised anomaly
detection. In cases where there’s limited historical
data available (with or without failure data), the en-
tire process of feature engineering which includes fea-
a
https://orcid.org/0000-0003-4872-8546
ture extraction can be used. However, without histor-
ical data, the strategy is limited to feature engineering
only with exclusion of the dimensionality reduction
aspect involved in feature extraction. The main con-
tributions of this paper can be summarized as follows:
• The paper discusses how unsupervised learning
techniques can be used to analyze sensor data in
order to identify complex patterns and anomalies
that cannot be easily recognized without prede-
fined labels, benchmarks, or failure data. This
could enable SMEs to adopt early issue detection
approaches thus bettering the maintenance strate-
gies they use.
• A case study demonstrates the efficiency of this
methodology. Specifically, this case study illus-
trates how adaptable the methodology is when tra-
ditional equipment health monitoring techniques
are lacking as a result of which it has potential for
optimizing operational effectiveness.
The rest of this paper is organized as follows: Sec-
tion 2 presents an overview of the research question.
Section 3 reviews relevant literature. Section 4 ex-
plains the adopted methodology. Section 5 provides
the implementation details. Section 6 evaluates the
methodology through a case study and discusses im-
Iftikhar, N. and Nordbjerg, F.
Real-Time Equipment Health Monitoring Using Unsupervised Learning Techniques.
DOI: 10.5220/0012785500003756
Paper published under CC license (CC BY-NC-ND 4.0)
In Proceedings of the 13th International Conference on Data Science, Technology and Applications (DATA 2024), pages 401-408
ISBN: 978-989-758-707-8; ISSN: 2184-285X
Proceedings Copyright © 2024 by SCITEPRESS – Science and Technology Publications, Lda.
401

plications for findings. Lastly, section 7 concludes the
paper and suggests future research directions.
2 RESEARCH PROBLEM
This research is focused on the development of an
EHI system that employs real-time sensor data for
monitoring industrial equipment. To avoid costly
breakdowns and ensure that equipment functions op-
timally, there is a need to come up with effective con-
dition monitoring techniques for detecting anomalies
in the machines’ performance. In most cases, historic
and maintaince data is used by traditional predictive
maintenance systems. Nonetheless, such data may be
limited or absent for many SMEs. Moreover, these
predictive maintenance systems may not capture dy-
namic behavior and complexity of industrial equip-
ment thus leading to false alarms.
This paper therefore introduces an unsupervised
learning approach, which can analyze sensor data
at real-time, extract/create relevant features and spot
anomalies. The suggested approach could be effec-
tive in various situations. It could prove particularly
useful when there is limited data, a lack of histori-
cal data, or even when there are no records of any
failures. It makes this approach particularly useful
for SMEs, who often lack resources and expertise to
implement smart analytics solutions. Hence, the aim
of this approach to achieve optimal equipment per-
formance without depending too much on extensive
historical data or failure incidents.
3 BACKGROUND AND RELATED
WORK
Major progresses have been achieved in real-time
equipment condition monitoring especially with the
integration of unsupervised learning techniques. This
was illustrated in a holistic study adopting such data-
driven techniques as feature extraction, deep learning,
novelty detection and cluster analysis as presented
in the (Eltouny et al., 2023). Furthermore, a thor-
ough study of 71 anomaly detection algorithms for
the time series category on 976 datasets conducted by
(Schmidl et al., 2022) delivered the necessary marks
for technique choice and best practices. Unsuper-
vised methods for detecting concept drift in machine
learning were reviewed together with a taxonomy for
these methods, and their importance in field scenarios
where immediate class labels are not available was
shown by (Gemaque et al., 2020).
In the anomaly detection research context, a liter-
ature review is outlined regarding the trend of unsu-
pervised learning from 2000 to 2020, as presented by
(Nassif et al., 2021). The superiority of Local Out-
lier Factor (LOF) and One-Class Support Vector Ma-
chines (OCSVM), reported by (Qasim et al., 2022),
was one of the main focuses of an unsupervised
anomaly detection algorithms comparison for predic-
tive maintenance in SMEs. A real-time anomaly de-
tection scheme for industrial automation through IoT
and unsupervised learning was proposed by (Gul-
tekin and Aktas, 2023). A novel infrastructure mon-
itoring method using a hybrid semi-supervised ap-
proach combining Convolutional Autoencoder (CAE)
and One-Class Classification (OCC) was described
by (Saeedi and Giusti, 2022). An improved Autoen-
coder based method for unsupervised anomaly detec-
tion was presented by (Cheng et al., 2021).
Regarding the health monitoring, an industrial
machine health prediction system was proposed,
which was based on unsupervised learning and time
series decomposition to compute the health index us-
ing sensor data as described by (de Lima et al., 2021).
An unsupervised learning method based on Convolu-
tional Autoencoder (CAE) for machine health assess-
ment was presented by (Guo et al., 2022). Further, an
unsupervised structural health monitoring approach
that utilizes Autoencoder and Hidden Markov Model
(HMM) was outlined by (Coraca et al., 2023). The
role of data processing and machine learning model
selection were examined in the context of condition
monitoring in industry was revealed by (Surucu et al.,
2023). Machine learning based approach for real-time
monitoring and fault detection in industrial compo-
nents was introduced by (Yang et al., 2019). An Long
Short-Term Memory (LSTM) model for fault detec-
tion and health management of military vehicles was
proposed by (Shukla et al., 2021). A Convolutional
Neural Network (CNN) based model that can estimate
the remaining useful life of machinery was introduced
by (Wen et al., 2023). Moreover, a predictive main-
tenance framework for Industry 4.0 which employs
machine learning for anomaly detection, demonstrat-
ing high recall levels across various scenarios, was in-
troduced by (Morselli et al., 2021).
To expand on the previous research which points
out the importance of advanced analytics in managing
industrial equipment data, this paper demonstrates a
practical data-driven method for SMEs. The use of
this method that combines real-time sensor data and
unsupervised learning techniques, is well placed in
situations where SMEs may have no historical data,
limited historical data, or only operational data with
no fault data available. This approach connects the
DATA 2024 - 13th International Conference on Data Science, Technology and Applications
402
monitoring of equipment health to the improvement
of operational performance, reducing downtime and
maximizing overall efficiency. In addition, it has been
presented in the paper that this proposed method can
be implemented easily as well.
4 METHODOLOGY
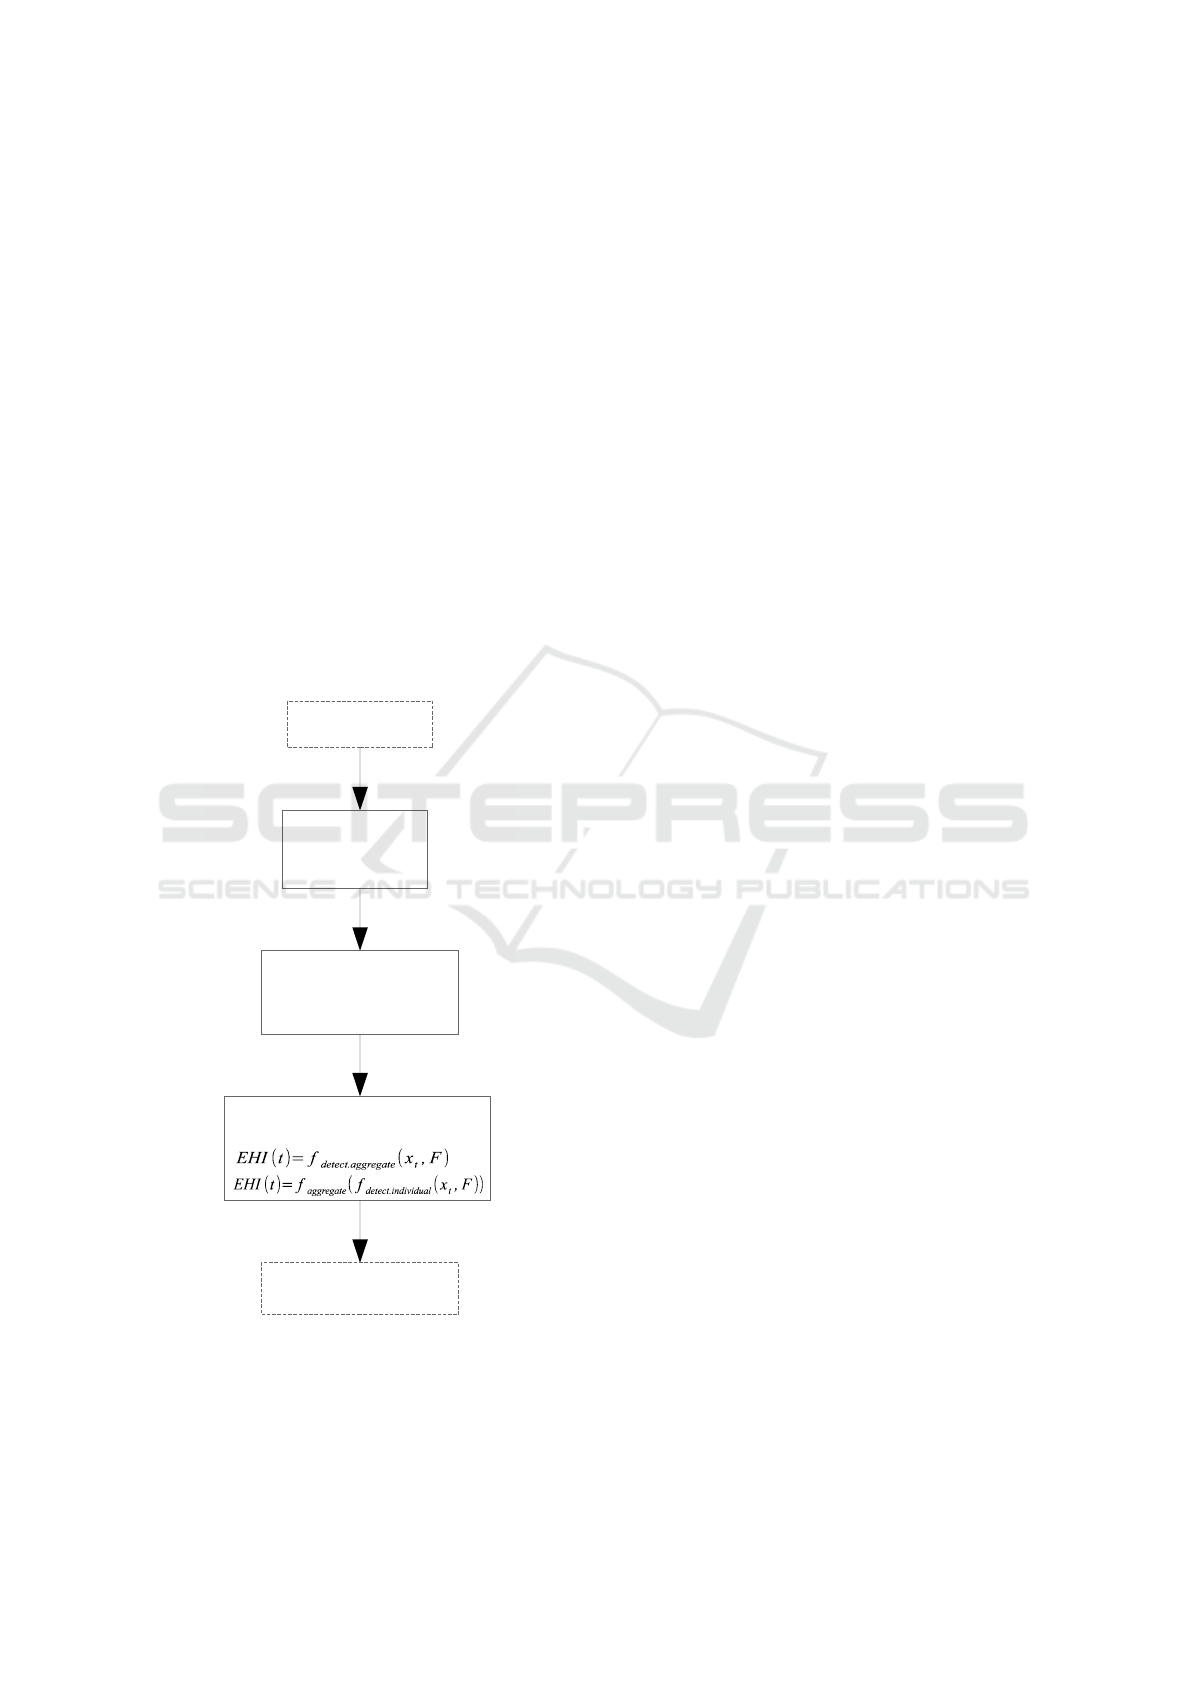
The methodology for real-time EHI encompasses sev-
eral steps, each of which is elaborated upon subse-
quently. The process (refer to Fig. 1) commences
with raw sensor data, which is subjected to prepro-
cessing. This is followed by an unsupervised fea-
ture engineering step that generates features from the
cleansed data. As part of this step, there exists an op-
tional process for reducing dimensionality to further
refine these features. The features are then utilized in
unsupervised anomaly detection and to compute the
EHI score. Ultimately, based on the EHI score, alerts
are generated if the scores surpass critical thresholds.
Sensor Data
Data
Preprocessing
Unsupervised Feature
Engineering
Unsupervised Anomaly
Detection & EHI Score
Alert
or
D
´
=
f
clean
(
D
)
(
D
)
F
=
f
engineer
(
D
´
)
Alert
(
t
)=
f
alert
(
EHI
(
t
)
, Θ
warning
,Θ
critical
)
Figure 1: Distinct components of the equipment health in-
dicator (EHI) system. The input for this proposed solution
comprises a dataset containing raw sensor data, typically
in the form of time series, while the outputs include EHI
scores and a variety of alerts.
4.1 Data Preprocessing
The first step is raw sensor data preparation which is
represented by D. This data passes through a clean-
ing function that can be written mathematically as fol-
lows:
D
′
= f
clean
(D) (1)
This equation represents that the cleaned data, D
′
results from applying the cleaning function denoted
as f
clean
to raw sensor data, D. The cleaning func-
tion, f
clean
, usually involves several steps. There exist
noise reduction approaches used in eliminating distor-
tions caused by additive noise in true signal. Sensor
data may have different measurement scales. Normal-
ization can thus be performed on all data to ensure
uniformity but at the same time maintaining original
differences in value range. Missing values may occur
in the sensor data due to malfunctioning of sensors
or errors while transmitting data. Various methods
are used for missing value handling like imputation
where missing values get replaced with substitutes
values. Furthermore, outliers can distort real under-
lying patterns in the information contained within a
dataset being analyzed for any kind of research pur-
pose. Thus, determination and treatment of such out-
liers are accomplished through various outlier detec-
tion methods for the relevant analysis purposes.
4.2 Unsupervised Feature Engineering
This process transforms the cleaned data, denoted as
D
′
into F, a set of features that capture the dynamic
nature of the equipment. This transformation can be
stated mathematically as:
F = f
engineer
(D
′
) (2)
Here, f
engineer
denotes the function of feature en-
gineering that is applied to D
′
. Feature engineer-
ing is a very important part of this process since it
extracts useful information from sensor data. The
goal is to change preprocessed data such that it be-
comes easier for analysis, thus exposing hidden pat-
terns. One common method used in feature engineer-
ing involves windowing whereby continuous streams
of data are divided into discrete windows for which
features can be extracted after they have been com-
puted and stored as window features. This helps to
capture temporal relationships between various nu-
merical values recorded over time on one hand and
others taken at different intervals on the other hand.
The function for feature engineering can incorporate
multiple methods. Examples include statistical mea-
sures like mean, median among others which sum-
marize the data distribution; frequency domain fea-
Real-Time Equipment Health Monitoring Using Unsupervised Learning Techniques
403

tures can also be created showing periodic compo-
nents within the dataset. The option to use feature en-
gineering or extraction techniques depend on whether
there is enough data. If there is limited historical data,
both methods can be used. Feature engineering will
convert the preprocessed data into a more useful form
while feature extraction will help in identifying which
features are most important for anomaly detection.
Unsupervised learning techniques could help a lot in
this regard, particularly for feature extraction. Such
techniques may include clustering, dimensionality re-
duction strategies such as Principal Component Anal-
ysis (PCA) or autoencoders based approaches among
others. In presence of no historical data at all, feature
engineering might still be used to convert any new in-
coming data in a format, suitable for further analysis.
4.3 Unsupervised Anomaly Detection
and Equipment Health Indication
Score Calculation
The process of unsupervised anomaly detection and
the calculation of an EHI score is the main element of
equipment condition monitoring. This process locates
such data points that do not follow the usual pattern
of behavior by the system, without the need for prior
labels or knowledge. This often occurs in cases where
a sudden failure or degradation of equipment may not
have occurred or been documented previously. The
anomaly score of every data point is computed, in
which case the corresponding input feature x
t
in the
feature set F is computed as the degree of difference.
Each higher score suggests the point is considered as
more unusual and the probability is less likely to be
equal to the normal.
An array of machine learning models can be used
for this task. Predominantly, each model has its par-
ticular strengths and some scenarios where they can
be utilized effectively. There are cases where histor-
ical data is absent, unsupervised anomaly detection
could be carried out with Isolation Forest, being just
one of the many potential algorithms. This algorithm
aims to detect the unusual nature of abnormal data
rather than common patterns. With this feature in
place, the model is well-equipped to face data with
many complex dimensions and also provide a great
amount of efficiency. In the case when there is lim-
ited historical data which includes both the normal
and the fault data, the Autoencoders, which is a type
of artificial neural network, can be used for anomaly
detection. During the training using a normal and
fault data set, the autoencoder with be able to adopt
some of its weights and filters to learn and reconstruct
the frequencies parts of it and mostly, it will recon-
struct the normal operating conditions with greater
accuracy as compared to the least frequent patterns
that may between faults or anomalies. After training,
reconstruction error is computed that is just the dif-
ference between the input and the output generated
by the algorithm. It is called anomaly score. The
point data that have greater reconstruction errors has
high probability to be anomalous. In cases in which
only a limited amount of historical data is available
and fault data is missing, One-Class Support Vector
Machine (OCSVM) can be utilized. This model will
learn a boundary around the normal data, and any
data point beyond this boundary will be detected as
an anomaly by the model. This makes it a powerful
tool for anomaly detection especially when there is a
small dataset with only good or normal data.
The EHI score at a given time point t is then ob-
tained through the use of the actual scores. This task
can be implemented via two detection methods: an
aggregate or an individual detection method. The
aggregate detection method finds already aggregated
anomaly scores for each data point, represented as:
EHI(t) = f
detect.aggregate
(x
t
, F) (3)
Conversely, the individual detection method finds
individual anomaly scores for each data point and
then aggregates them, represented as:
EHI(t) = f
aggregate
( f
detect.individual
(x
t
, F)) (4)
This EHI score is considered to be a health con-
dition of the equipment, and the lower the score, the
greater the chance of a problem.
4.4 Real-Time Alert Generation
The final stage of the process is the generation of real-
time alerts mechanism. These alarms are triggered
based on the EHI scores reaching the corresponding
threshold levels. The predetermined threshold values
are set in advance, denoted by θ
warning
and θ
critical
in
order to classify the equipment state as normal state,
warning state and critical state. There is an issuance
of alerts that are based on those standard thresholds.
The alert generation function is represented mathe-
matically as:
Alert(t) =
Normal if EHI(t) ≤ θ
warning
,
Warning if θ
warning
< EHI(t) ≤ θ
critical
,
Critical if EHI(t) > θ
critical
.
(5)
In this equation, ‘Normal’ signifies a normal op-
erational state, ‘Warning’ indicates a warning level
alert, and ‘Critical’ denotes a critical level alert. The
function Alert(t) generates an alert at time t based on
the EHI score and the predefined thresholds θ
warning
and θ
critical
.
DATA 2024 - 13th International Conference on Data Science, Technology and Applications
404
5 IMPLEMENTATION
The proposed methodology has been effectively im-
plemented, comprising several stages: data col-
lecting, preprocessing, storing, extracting features,
anomaly detection, alerting system setup and real-
time monitoring dashboard creation. Real-time data
has been continuously collected from the sensors and
transmitted. A light-weight, scalable and efficient
communication protocol (Message Queuing Teleme-
try Transport (MQTT)) is used for data transmission
from the sensors to a central server. After, the sen-
sor data is pre-processed, which is done using the
Python scripts, it is then stored in a highly efficiently
and flexible relational database, PostgreSQL. A data
processing web steaming mechanism has been built
using Node-RED, a effective flow-based development
platform to ease the integration and flow in the data
processing pipeline. Such a script start off by us-
ing Python’s native libraries like NumPy and Pandas
and then exploring for example, Isolation Forest algo-
rithm in Scikit-learn’s collections. Node-RED is ad-
ditionally used as a tool to create the alert system. The
last thing that has been employed is Grafana, which
basically creates dashboards that are interactive in real
time that show sensor data, deviation results and EHI
scores and provide an immediate picture of the condi-
tion of the system.
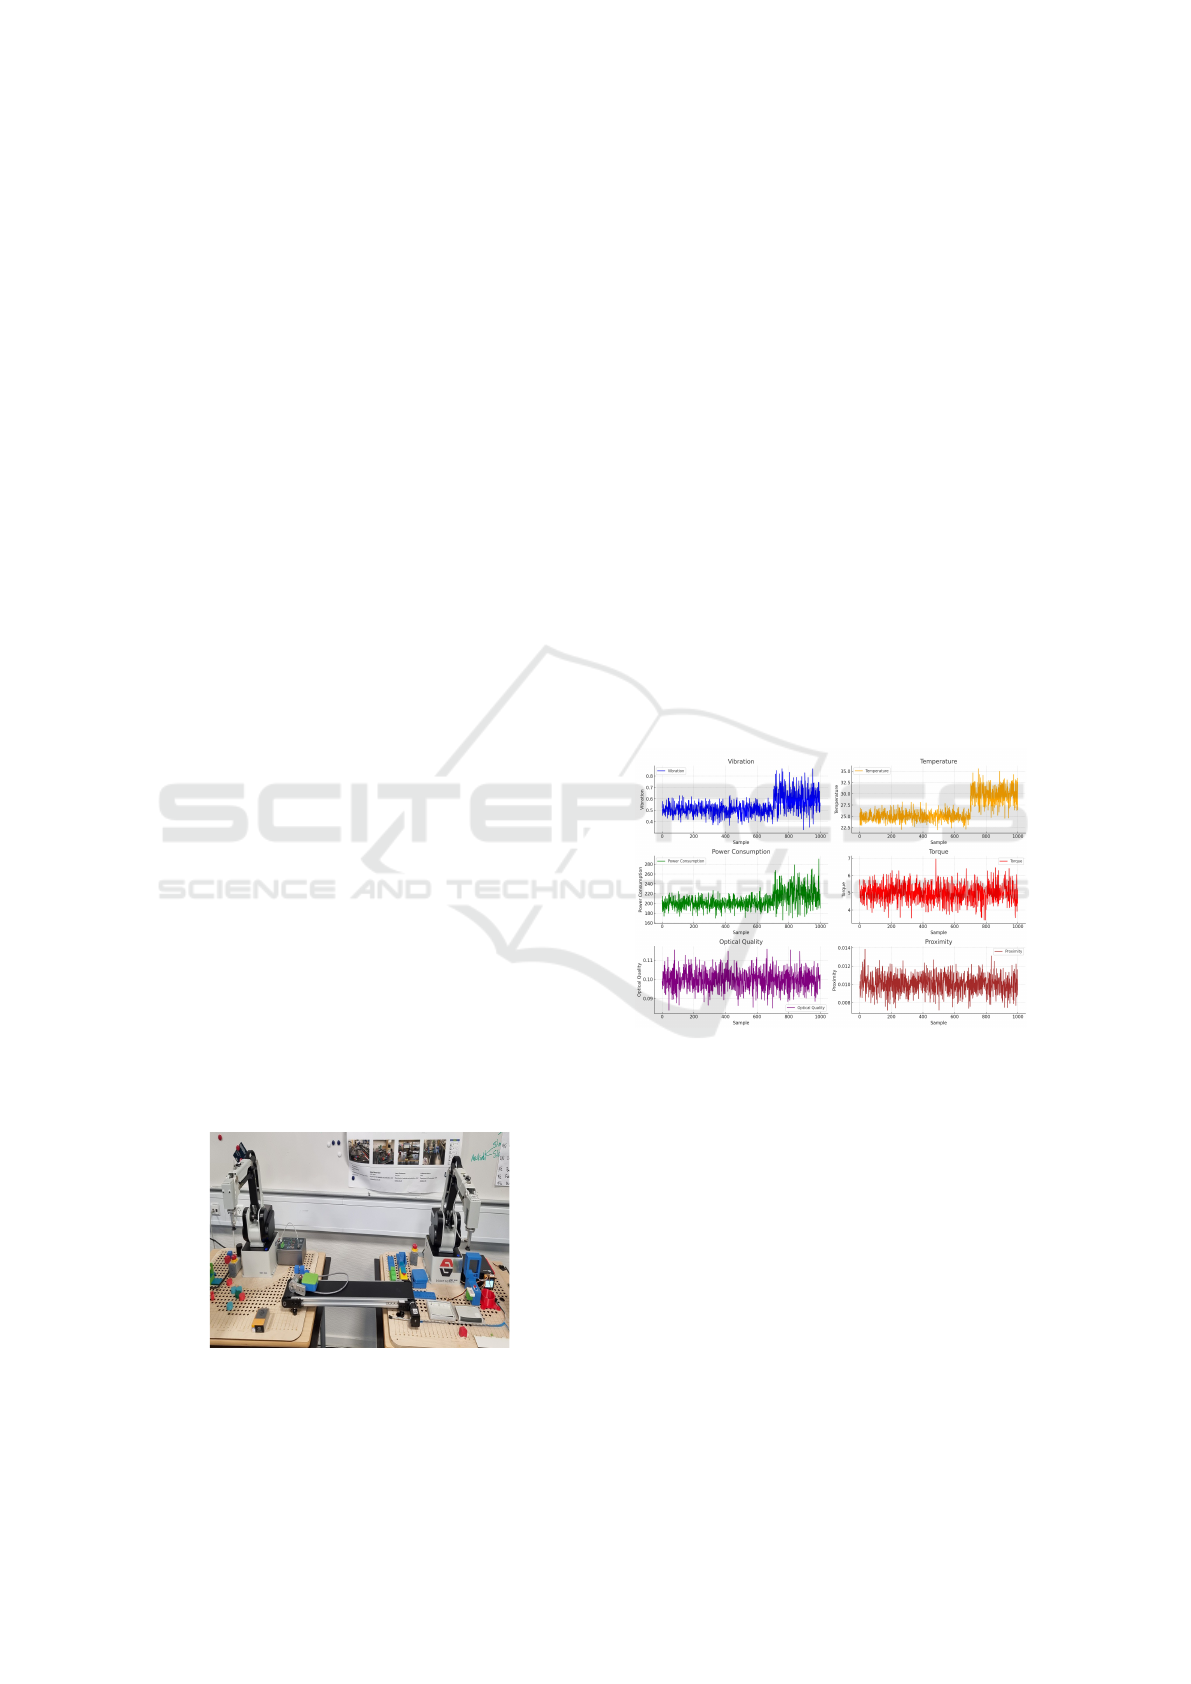
6 EXPERIMENTAL RESULTS
This section describes the outcomes derived from the
deployment of a real-time monitoring system, specifi-
cally designed to evaluate the performance and health
status of robotic arms (refer to Fig. 2). The analyt-
ics procedure encompasses data pre-processing, engi-
neered features to improve data representation, unsu-
pervised anomaly detection methodologies and alert
generation in real time based on EHI scores.
Figure 2: Robotic arms to run lab experimental assembly
line.
6.1 Data Understanding
Data Understanding is the initial step of this research.
The data used was sensor data from two different op-
erating states of robotic arms: “gradual failure” and
“sudden failure”. The fact that the proposed moni-
toring systems has not encountered this type of data
before is rather noteworthy. It is this states’ data that
is believed to be streamed in a near real-time, which
is one of the key assumptions that depict an opera-
tional environment in which the monitoring system is
deployed without a historical data or failure records
to support it. This case is one of the challenges
that SMEs usually confront. The research method-
ology employed here is developed to evaluate the ef-
ficiency of the proposed system against the scenarios
where the conventional predictive maintenance mod-
els based on the historical data may not be applicable.
This method, thus, reinforces the effectiveness and re-
liability of unsupervised learning approaches. These
techniques can analyze time-series or incoming sen-
sor data to find unusual data patterns and deviations
which indicate equipment health issues at the moment
without the need for pre-processed training data.
Figure 3: Subdivided plot displays each of the six sensors
in the gradual failure scenario separately, with each subplot
dedicated to one sensor.
The datasets are given here with an intention that
they would simulate the type of data that the system
might face in the real-world settings. The gradual
failure dataset (refer to Fig. 3). These variations, par-
ticularly in the vibration, temperature and power con-
sumption sensors after the 700th data point, can serve
as indicators of approaching equipment failure and
must not be neglected. The demonstration of these
gradual alterations intensifies the significance of prior
monitoring to avoid a continuous deterioration. On
the other hand, the sudden failure dataset (refer to
Fig. 4) is a situation where the system must rapidly re-
spond to changes that are a sign of instant equipment
failure. The dataset is comprised of the suddenly in-
Real-Time Equipment Health Monitoring Using Unsupervised Learning Techniques
405

Figure 4: This visualization presents each of the six sensors
for the sudden failure scenario, with each subplot dedicated
to one sensor.
troduced fault, for example, sudden drops in power
consumption and torque in a short span of time and
elevated values for vibration and temperature read-
ings together with the optical quality readings, espe-
cially evident between the 500th and 700th data point.
These datasets, after generating the failures synthet-
ically, will act as a base for validation of the given
technique.
6.2 Data Preparation
The first step of the analysis is the data preparation
phase, carried out on the incoming data. It is a pivotal
part of the real-time operation because it enhances
the data quality due to the fact that data comes in a
steady, real-time stream. It includes the operations
like noise reduction, filling of missing values, removal
of outliers and so on. After the calibration process,
the sensor data was adjusted to a uniform scale using
normalization procedure. Normalization empowers a
comprehensive approach to the processing of sensor
records through data homogenization. In this manner,
data is prepared for the following analytical tasks.
6.3 Feature Engineering
This phase has been perhaps rather crucial in turning
cleaned sensor data into a format that has been more
representative of all the dynamic conditions the mon-
itored equipment has been going through. This paper
use aggregation of the sensor data to determine the
mean value for every operational condition, like grad-
ual failure or sudden failure. On the other hand, other
statistical measures may be employed depending on
the analysis needs. The rolling windowing technique
was used as a tool for effective feature engineering,
and the data was segmented into blocks of 50 obser-
vations each. Inside each window, the average of the
sensor readings were extracted. This step is the key
for defining and modeling all temporal patterns sig-
nifying the abnormal operation or normal functioning
of the equipment. Disclaimer- in this case, feature
extraction was not applied for the lack of historical
data. This unsupervised feature engineering process
formed a solid basis for subsequent anomaly detection
and equipment health assessment, thus demonstrating
its potential use in real-time monitoring.
6.4 Anomaly Detection
The paper implemented Isolation Forest, a kind of un-
supervised anomaly detection algorithm. This model
is very applicable for the cases in which the histori-
cal data is either limited or nonexistent. It operates
by detecting anomalies in high-dimensional datasets,
which usually occur in sensor data for the equipment
health monitoring. These anomalies, efficiently pin-
pointed by the model (refer to Fig. 5), could be an
early warning or alarm suggesting faulty equipment
functions and promptly the corrective actions. The
models’ output associated each observation with a
normal (1) or anomalous (-1) status created the foun-
dation for the development of EHI scores. EHI score
represents a generated number from the results of
anomaly detection and provides a numerical measure
of equipment status. The visualization of EHI scores
over time for both gradual failure and sudden fail-
ure scenarios provided insightful views on equipment
health (refer to Fig. 6). For the case of gradual de-
cline, the EHI scores showed considerable succession
periods of stability were followed by visible health
drops. In the sudden failure case, the scores of EHI
that were stable earlier showed a noticeable drop that
is usually related to the multiple abnormalities occurs
within a short span of time. In general, EHI scores
could be used in early failures identification, therefore
would permit fast response to the potential equipment
problems and minimizing of the downtime.
6.5 Real-Time Alert
This phase permits proactive maintenance interven-
tions and helps to convert the insights obtained from
EHI scores to actions. The paper featured visualiza-
tion techniques that enabled straightforward presen-
tation of equipment’s performance over a given time
period, as shown as condition status: good condition,
gradual failure condition and sudden failure condi-
tion, each indicating an EHI score with corresponding
real-time alerts. Visual indicators, represented by yel-
low and red vertical lines, represent the warning and
critical alert zones, respectively (refer to Fig. 6). The
DATA 2024 - 13th International Conference on Data Science, Technology and Applications
406
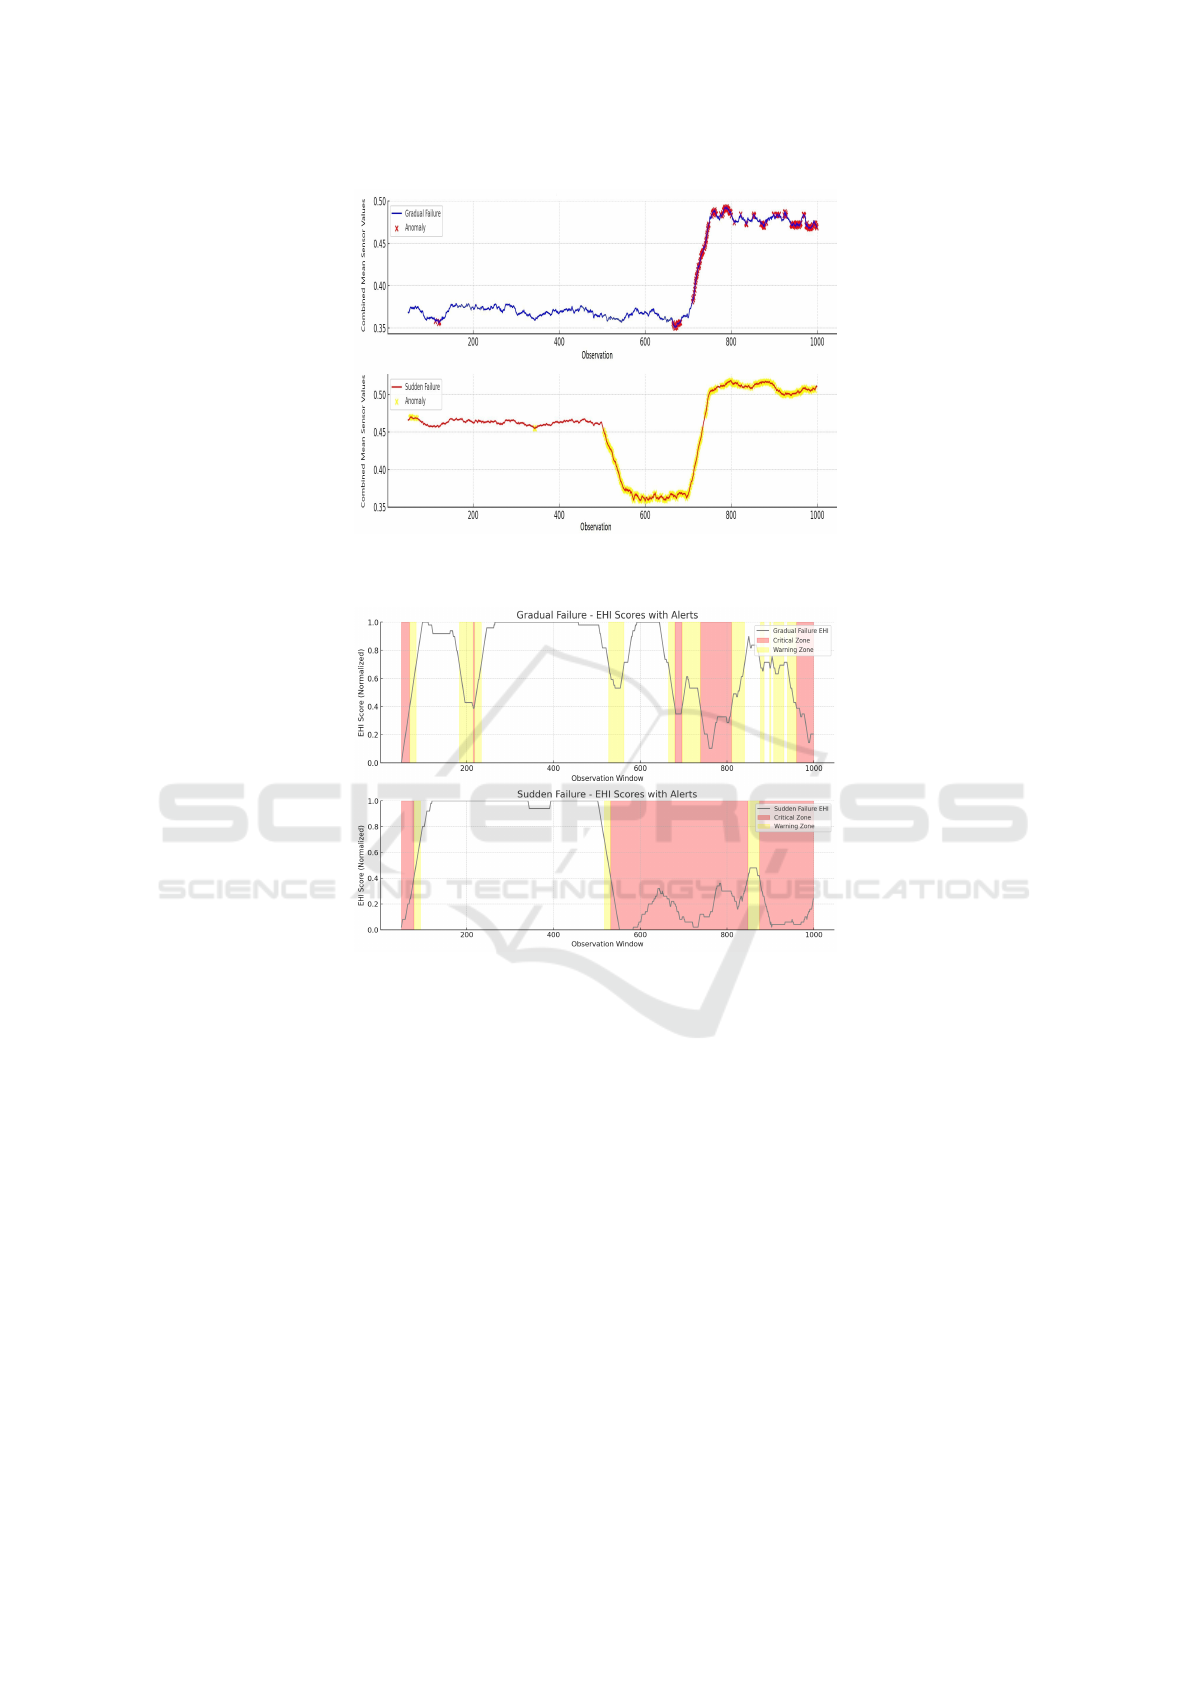
Figure 5: These visualizations highlight where the isolation forest algorithm detected anomalies within each dataset based on
the combined mean of all sensor features, distinguished by color: gradual failure in blue and sudden failure in red.
Figure 6: The visualizations display the EHI scores and the corresponding real-time alerts together for each condition, sepa-
rately.
zones defined by predefined threshold levels signal
that immediate action is required. In the case where
everything works as planned, the device is demon-
strated by stable EHI scores, for example, from 200th
to 500th data point. Furthermore, the gradual fail-
ure condition (refer to Fig. 6 - upper) displays fluctu-
ations in the EHI scores, indicating presence of drops
where the scores have slipped into the danger or crit-
ical zones between 700th and 1000th marks. These
alerts are the transitional ones which tell about the
current state so that maintenance activities could be
taken immediately to maintain smooth functioning.
With respect to the sudden failure condition (refer to
Fig. 6 - lower) where EHI scores suddenly drop from
the 500th data point to lower levels, generating criti-
cal alert and suggesting catastrophic failure.
6.6 Discussion
The methodology suggested in this paper viewed the
dynamics of operation and the conditions of equip-
ment for good health also under different operational
circumstances. The transformation of sensor data
into a structured format by applying the feature en-
gineering process was the next step in the process,
and it captured the dynamic states of the equipment.
The anomaly detection algorithms highlighted devia-
tions from standard working patterns, thereby signal-
ing possible equipment health problems. EHI score
assessed the equipment health as a qualitative mea-
sure over time. The combination of EHI and real
time alerts can give a holistic view of the equipment’s
health status. This strategy could provide a rea-
sonable mechanism for maintaining workplace effi-
ciency. Similarly, this real-time alerting system could
Real-Time Equipment Health Monitoring Using Unsupervised Learning Techniques
407

be used as the core of the maintenance team’s work as
the team members can receive notifications about the
possible issues in a timely manner, so it can guarantee
greater efficiency and reduce production delays.
7 CONCLUSIONS AND FUTURE
WORKS
The paper proposes a practical application of real-
time equipment health monitoring. The approach
eliminates the need for extensive historical data and
maintenance records, which provides a considerably
advantageous avenue for the SMEs. The core con-
tributions of the research involve the implementation
of an unsupervised learning system and a real-time
notification system. This framework incorporates un-
supervised learning algorithms, which helps analyze
sensor data and highlight any abnormalities, which is
useful for implementing efficient machine monitoring
system. The real time alert system ensures the equip-
ment reliability and durability and so it leads to the
further improvement of the operation efficiency. It is
worth mentioning that this approach is not only bene-
ficial for SMEs but also simple to implement, making
it a practical solution for real-time equipment health
monitoring.
The future task will be devoted to increasing the
system’s capability to handle various IoT devices.
Different unsupervised learning algorithms shall be
tested to find out those best performing ones for
anomaly detection. Furthermore, a variety of feature
engineering techniques will also be studied in order
to further improve the performance. The adaptability
and scalability of the system through the use of real
data, comprising real failures instances, will be tested
in real production environments.
REFERENCES
Cheng, Z., Wang, S., Zhang, P., Wang, S., Liu, X., and Zhu,
E. (2021). Improved autoencoder for unsupervised
anomaly detection. International Journal of Intelli-
gent Systems, 36(12):7103–7125.
Coraca, E. M., Ferreira, J. V., and Nobrega, E. G. O. (2023).
An unsupervised structural health monitoring frame-
work based on variational autoencoders and hidden
markov models. Reliability Engineering and System
Safety, 231:109025.
de Lima, M. J., Crovato, C. D. P., Mejia, R. I. G.,
da R. Righi, R., de O. Ramos, G., da Costa, C. A.,
and Pesenti, G. (2021). Healthmon: An approach for
monitoring machines degradation using time-series
decomposition, clustering, and metaheuristics. Com-
puters and Industrial Engineering, 162:107709.
Eltouny, K., Gomaa, M., and Liang, X. (2023). Unsu-
pervised learning methods for data-driven vibration-
based structural health monitoring: A review. Sensors,
23(6):3290.
Gemaque, R. N., Costa, A. F. J., Giusti, R., and Santos,
E. M. D. (2020). An overview of unsupervised drift
detection methods. Wiley Interdisciplinary Reviews:
Data Mining and Knowledge Discovery, 10(6):e1381.
Gultekin, E. and Aktas, M. S. (2023). Real-time anomaly
detection business process for industrial equipment
using internet of things and unsupervised machine
learning algorithms. In International Conference on
Computational Science and Its Applications, pages
16–31. Springer Nature Switzerland.
Guo, L., Yu, Y., Duan, A., Gao, H., and Zhang, J. (2022).
An unsupervised feature learning based health indica-
tor construction method for performance assessment
of machines. Mechanical Systems and Signal Process-
ing, 167:108573.
Morselli, F., Bedogni, L., Mirani, U., Fantoni, M., and
Galasso, S. (2021). Anomaly detection and classifica-
tion in predictive maintenance tasks with zero initial
training. IoT, 2(4):590–609.
Nassif, A. B., Talib, M. A., Nasir, Q., and Dakalbab, F. M.
(2021). Machine learning for anomaly detection: A
systematic review. IEEE Access, 9:78658–78700.
Qasim, M., Khan, M., Mehmood, W., Sobieczky, F., Pich-
ler, M., and Moser, B. (2022). A comparative analy-
sis of anomaly detection methods for predictive main-
tenance in sme. In International Conference on
Database and Expert Systems Applications, pages 22–
31. Springer International Publishing.
Saeedi, J. and Giusti, A. (2022). Anomaly detection for
industrial inspection using convolutional autoencoder
and deep feature-based one-class classification. In In-
ternational Conference on Computer Vision, Theory
and Applications, pages 85–96.
Schmidl, S., Wenig, P., and Papenbrock, T. (2022).
Anomaly detection in time series: a comprehensive
evaluation. Proceedings of the VLDB Endowment,
15(9):1779–1797.
Shukla, I., Silas, A., Dozier, H., Hansen, B. E., and Bond,
W. G. (2021). Data driven hybrid approach for health
monitoring and fault detection in military ground ve-
hicles. In International Conference on Data Science,
Technology and Applications, pages 300–307.
Surucu, O., Gadsden, S. A., and Yawney, J. (2023). Con-
dition monitoring using machine learning: A review
of theory, applications, and recent advances. Expert
Systems with Applications, 221:119738.
Wen, L., Su, S., Wang, B., Ge, J., Gao, L., and Lin, K.
(2023). A new multi-sensor fusion with hybrid con-
volutional neural network with wiener model for re-
maining useful life estimation. Engineering Applica-
tions of Artificial Intelligence, 126:106934.
Yang, C., Liu, J., Zeng, Y., and Xie, G. (2019). Real-
time condition monitoring and fault detection of com-
ponents based on machine-learning reconstruction
model. Renewable Energy, 133:433–441.
DATA 2024 - 13th International Conference on Data Science, Technology and Applications
408
