
Impact of Satellites Streaks for Observational Astronomy: A Study on
Data Captured During One Year from Luxembourg Greater Region
Olivier Parisot and Mahmoud Jaziri
Luxembourg Institute of Science and Technology (LIST), 5 Avenue des Hauts-Fourneaux,
4362 Esch-sur-Alzette, Luxembourg
Keywords:
Astronomy, Satellites Streaks, Computer Vision.
Abstract:
The visible and significant presence of satellites in the night sky has an impact on astronomy and astropho-
tography activities for both amateurs and professionals, by perturbing observations sessions with undesired
streaks in captured images, and the number of spacecrafts orbiting the Earth is expected to increase steadily
in the coming years. In this article, we test an existing method and we propose a dedicated approach based
on eXplainable Artificial Intelligence to detect streaks in astronomical data captured between March 2022 and
February 2023 with a smart telescope in the Greater Luxembourg Region. To speed up the calculation, we
also propose a detection approach based on Generative Adversarial Networks.
1 INTRODUCTION
We live in a time when global connectivity is becom-
ing an unstoppable trend, with mega satellite con-
stellations such as SpaceX’s Starlink, OneWeb and
Amazon’s Project Kuiper proliferating in low-Earth
orbit (Langston and Taylor, 2024). While these satel-
lite networks have started to revolutionize the indus-
try, they also raise growing concerns, for multiple as-
pects (environment, defence, culture, etc.) (Venkate-
san et al., 2020). In particular, the impact of these
mega-constellations on astronomy and astrophotog-
raphy has become a hot topic (Walker et al., 2020),
calling into question the possibility of observing the
night sky without disturbance.
A modern obstacle is satellite light pollution,
which occurs when orbiting satellites reflect the sun’s
light unto the Earth. This light disturbance can make
astronomical observations considerably more difficult
(Lawler, 2023), and affect the quality of images cap-
tured by amateur and professional astronomers alike:
• Light trails: mega-constellation satellites can cre-
ate light trails as they pass in front of a telescope
or camera lens during long exposure photography.
These streaks can compromise image quality by
leaving unwanted lines of light across astronomi-
cal images.
• Increased sky brightness: the sun’s reflection off
satellite surfaces can contribute to a general in-
crease in the brightness of the night sky. This
makes it more difficult to observe and capture
faint, distant celestial objects, such as galaxies,
nebulae and faint stars.
• Reduced contrast: the presence of moving satel-
lites can reduce the contrast between celestial ob-
jects and the sky background. Subtle details in
astronomical pictures, which depend on a dark,
uniform night sky, can be compromised by bright
streaks and scattered spots.
• Complications for image calibration: satellite
light trails can disrupt the process by introduc-
ing non-stellar elements into the images, making
treatment difficult or even impossible.
• Need for advanced post-processing: this may re-
quire technical adjustments and specialized soft-
ware to mitigate undesirable effects caused by
satellites, such as inpainting.
It’s also a problem for professional ground-based
observatories (Hainaut and Williams, 2020), making
it imperative to set up a process to estimate concrete
impact on the quality of large digital sky surveys (Lu,
2024), avoid disturbances and then correct data if pos-
sible (Tyson et al., 2020). The effect is significant: as
recent studies have shown (Lawler, 2023; Barentine
et al., 2023), the increase in traffic in low-Earth or-
bit will inevitably lead to a loss of astronomical data
and therefore reduce the possibilities of discoveries
on the ground, as weak astrophysical signals are in-
creasingly lost in the noise. The International As-
Parisot, O. and Jaziri, M.
Impact of Satellites Streaks for Observational Astronomy: A Study on Data Captured During One Year from Luxembourg Greater Region.
DOI: 10.5220/0012787800003756
Paper published under CC license (CC BY-NC-ND 4.0)
In Proceedings of the 13th International Conference on Data Science, Technology and Applications (DATA 2024), pages 417-424
ISBN: 978-989-758-707-8; ISSN: 2184-285X
Proceedings Copyright © 2024 by SCITEPRESS – Science and Technology Publications, Lda.
417

tronomical Union (IAU) recently published a ’Call to
Protect the Dark and Quiet Sky from Harmful Inter-
ference by Satellite Constellations’
1
. Furthermore,
it’s a hot topic for space-based observatories like Hub-
ble (Kruk et al., 2023), which adds a number of con-
straints that are difficult to resolve, especially given
the cost of operating such facilities in space.
In this article, we propose the study of a dataset
made up of astronomical images captured over a year
with a smart telescope, in conditions accessible to am-
ateurs, and we evaluate the quantity of images effec-
tively impacted by satellite trails. The rest of the pa-
per is structured as follows. In Section 2, we present
a brief review of the state of the art concerning the
detection of satellite streaks in astronomical images.
Section 3 describes the dataset of images captured
by the author, while Section 4 proposes a study of
this dataset using different methods. In Section 5, we
discuss the results, before concluding and proposing
some perspectives in Section 6.
2 RELATED WORKS
For many years now, the scientific community has
proposed many techniques to detect and track satel-
lites, and to deal with the trails they cause in astro-
nomical images (Nir et al., 2018; Calvi et al., 2021;
Jiang et al., 2023). Specific software for astronom-
ical images processing propose features to manage
this problem, like SharpCap
2
. It is important to note
that all types of fast-moving Near-Earth Objects, such
as meteors, satellites or even cosmic rays, can leave
streaks, trails and linear features on astronomical im-
ages (Nir et al., 2018).
In the Python software ecosystem, we can mention
these tools:
• ASTRiDE aims to detect streaks in astronomical
images (Kim, 2016) with boundary-tracing and
morphological parameters. ASTRiDE can detect
not only long streaks, but also relatively faint,
short or curved ones. As we will see later in this
article, this is also a problem because it tends to
confuse real streaks with tracking problems – so it
requires a fine configuration like in (Duarte et al.,
2023).
• Authors of (Danarianto et al., 2022) proposed a
Python pipeline for lightweight streak detection,
identification and initial orbit determination from
FITS raw files captured by amateur-grade tele-
scopes – but it was tested on only a few images
1
https://cps.iau.org/documents/49/techdoc102.pdf
2
https://www.sharpcap.co.uk
captured around the celestial equator (85). FITS
(Flexible Image Transport System) is a file format
most commonly used into store astronomical data.
• A research team applied the probabilistic Hough
transform through a Python scripts using well-
known open source libraries like openCV and
scikit-images, and by using GPU-specific compu-
tation to detect streaks in FITS files captured by
the Tomo-e Gozen camera at Kiso Observatory in
Japan (Cegarra Polo et al., 2021). Unfortunately,
the source code is not available.
• pyradon is a Python package based on Fast Radon
Transform (FRT) to find streaks in 2D astronomi-
cal images (Nir et al., 2018).
Some existing approaches are based on Deep
Learning. For instance, an approach based on YOLO
(You Only Look Once) was proposed by (Varela et al.,
2019) to detect streaks in images captured by a multi-
camera wide field of view system. The authors note
that the labelling of training dataset is an issue. Fur-
thermore, a recent work compared two techniques
based on Deep Convolutional Neural Networks: an
extended feature pyramid network (EFPN) with faster
region-based CNNs (Faster R-CNN) and a feature
pyramid network (FPN) with Faster R-CNN (El-
hakiem et al., 2023). This approach is elaborated but
it was only tested on synthetic data.
In this paper, we compare an existing approach
with a dedicated technique combining Deep Learn-
ing and eXplainable Artificial Intelligence to search
for streaks in astronomical data that we have captured
ourselves using smart telescopes.
3 DATA ACQUISITION
Nowadays, Electronically Assisted Astronomy
(EAA) is increasingly applied by astronomers to
observe Deep Sky Objects (DSO), i.e. astronomical
objects that are not individual stars or Solar System
objects, like nebulae, galaxies or clusters. By cap-
turing images directly from a camera coupled to a
telescope and applying lightweight image process-
ing, EAA allows to generate and display enhanced
images on screens (laptop, tablet, smartphone), even
in places heavily impacted by light pollution and
poor weather conditions. The recent years brought
the emergence of smart telescopes, making sky
observation more accessible (Parisot et al., 2022).
Even the scientific community is taking advantage of
these instruments to study astronomical events (i.e.
asteroids occultations, exoplanets transits, eclipses) .
In this context, MILAN Sky Survey is a set of raw
images with DSO visible from the Northern Hemi-
DATA 2024 - 13th International Conference on Data Science, Technology and Applications
418
sphere (galaxies, stars clusters, nebulae, etc.), col-
lected during 205 observation sessions (Parisot et al.,
2023). These images were captured between March
2022 and February 2023 from Luxembourg Greater
Region by using the built-in alignment and stacking
features of a Stellina smart telescope, based on an Ex-
tra Low Dispersion doublet with an aperture of 80 mm
and a focal length of 400 mm (focal ratio of f/5), and
equipped with a Sony IMX178 CMOS sensor with a
resolution of 6.4 million pixels. A CLS filter (City
Light Suppression) is placed in front of the camera
sensor. The Dawes Limit of the instrument is 1.45
arc-seconds.
The dataset and the data acquisition process is
deeply is described in (Parisot et al., 2023), here is
a short summary:
• The default settings of Stellina were applied, i.e.
10 seconds of exposure time and 20 dB of gain
for each single image. These values are a sat-
isfying trade-off to obtain good images with the
alt-azimuth motorized mounts of the instruments
(higher value of exposure time may cause a reduc-
tion in captured image quality, particularly with
moving blur (Loke, 2017), higher gain may in-
crease the noise level).
• For each observation session, the instrument was
installed in a dark environment (no direct light)
and properly balanced using a bubble level on a
stable floor (it’s mandatory to ensure a good track-
ing).
• Observation sessions were conducted only when
the sky was clear and of reasonable quality. The
authors were always present during observations
to deal with any weather-related issues such as
wind, cloud, fog, rain, or disturbance from ani-
mals.
In total, 205 observation sessions, leading to
50068 FITS images of resolutions 3096 × 2080 were
obtained (corresponding to a field of view of approx-
imately 1° × 0.7°). As each image was obtained with
an exposure time of 10 seconds, it represents a total
cumulative time of 139 hours, 4 minutes and 40 sec-
onds.
4 METHOD
We have analyzed the MILAN Sky Survey dataset
with different methods, to count FITS files contain-
ing streaks, and so the maximum of images impacted
by satellites. The computations were realized with
the following hardware: 40 cores and 128 GB RAM
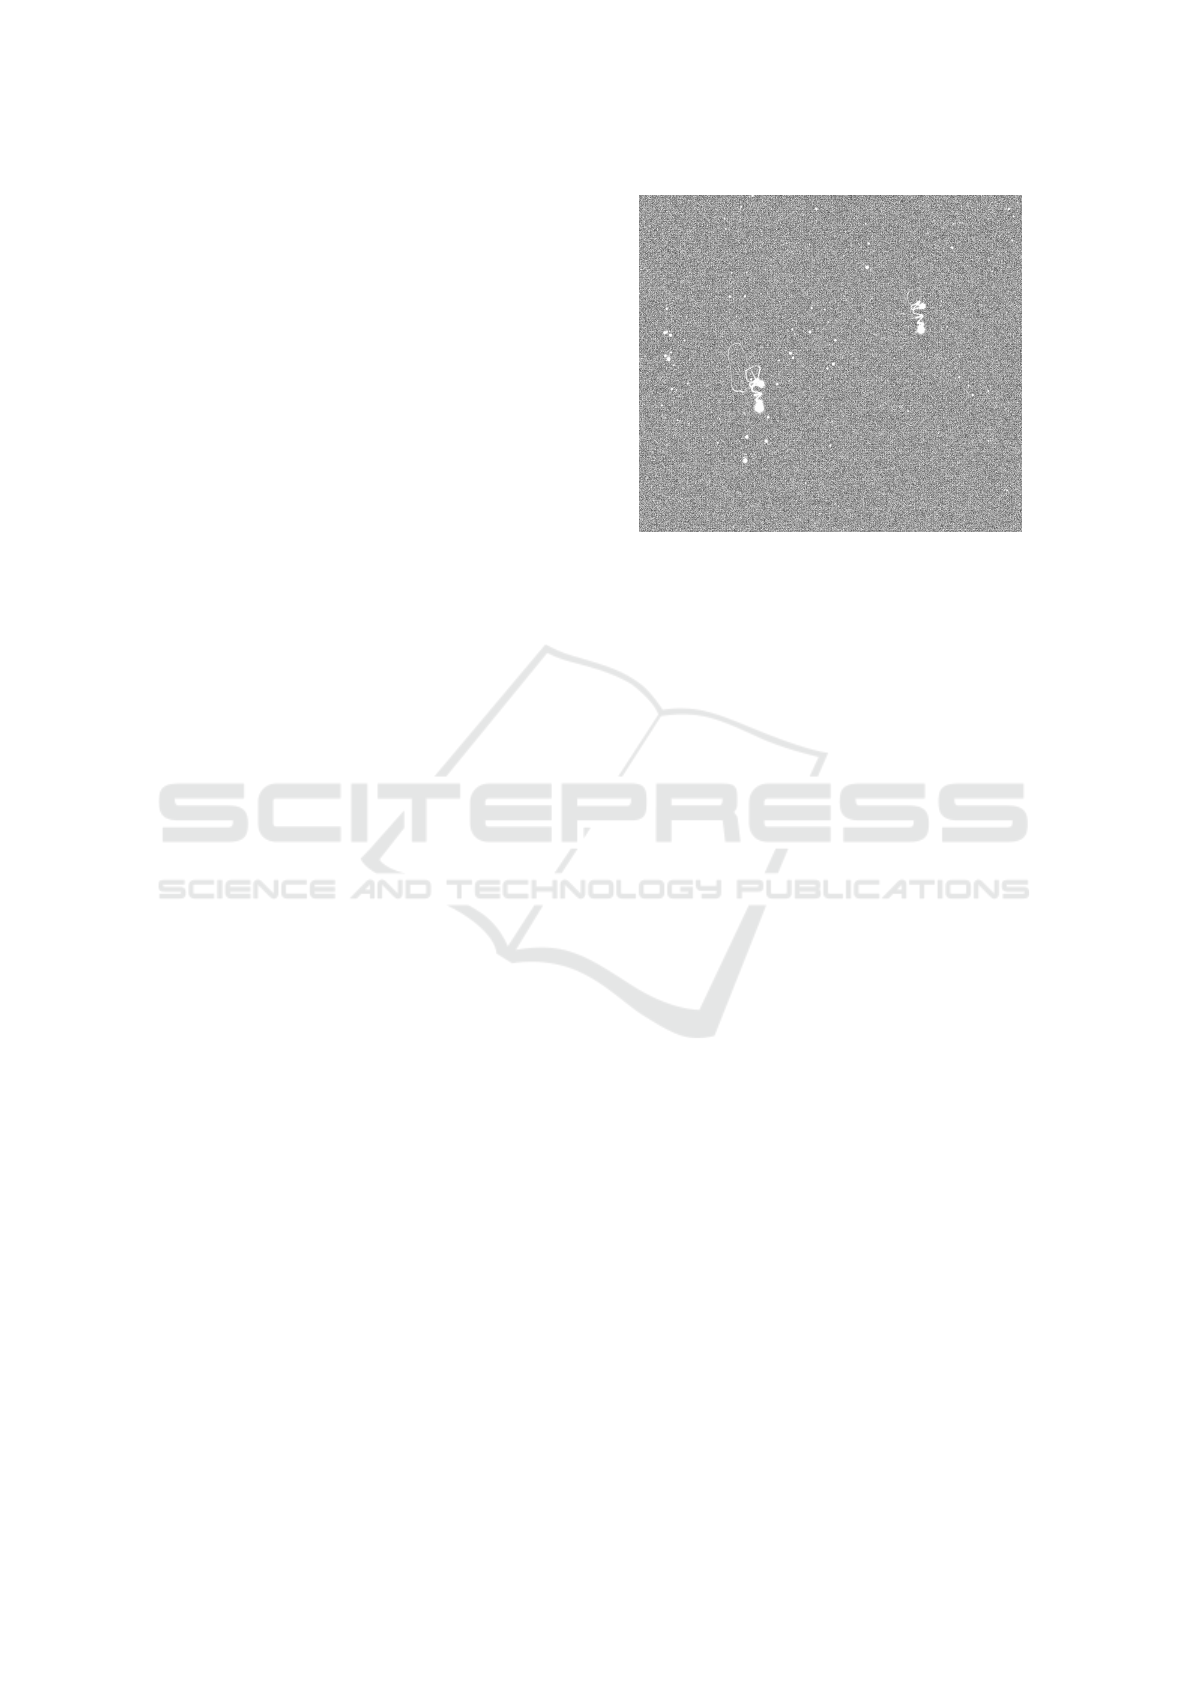
Figure 1: False positive example of streak, due to tracking
error. The FITS file is stored in NGC457-20220807.zip.
(Intel(R) Xeon(R) Silver 4210 CPU @ 2.20GHz) and
NVIDIA Tesla V100-PCIE-32GB.
4.1 Detection with ASTRiDE
First, we have tested ASTRiDE, by using differ-
ent settings and by filtering the results (Table 1).
ASTRiDE first pre-processes the image by remov-
ing the background using its level and standard de-
viation before searching for streaks (Kim, 2016). It
then computes the contour map to identify all ob-
ject borders within the image. ASTRiDE then ana-
lyzes the morphologies of each object, as determined
by the morphological parameters, to differentiate be-
tween streaks and stars.
By using the default parameters (contour thresh-
old=3, shape cut=0.2), and by considering FITS im-
ages with at least one detected streak, we observed
this selection is too large, retaining images with just
blurred stars due to tracking errors (example: Figure
1).
To make a more restrictive selection, we have fil-
tered FITS images with at least one streak with a min-
imal perimeter (128 pixels), and we have found that
streaks are detected in 1316 FITS files for a total of
50068 files, i.e. 2.6 %. In other words, it detected
than 137 observation sessions are impacted for a total
of 205, i.e. 66 % (Figure 2.
With the standard settings of ASTRiDE, the se-
lection is too large. Moreover, and given the fact that
FITS files have an high resolution, the computation
may be slow (the tools does not use GPU to speed-
up the analysis – the ASTRiDE’ authors advice is to
deal with parameters to find a good trade-off between
accuracy and speed).
So we have tried with optimized settings which
Impact of Satellites Streaks for Observational Astronomy: A Study on Data Captured During One Year from Luxembourg Greater Region
419
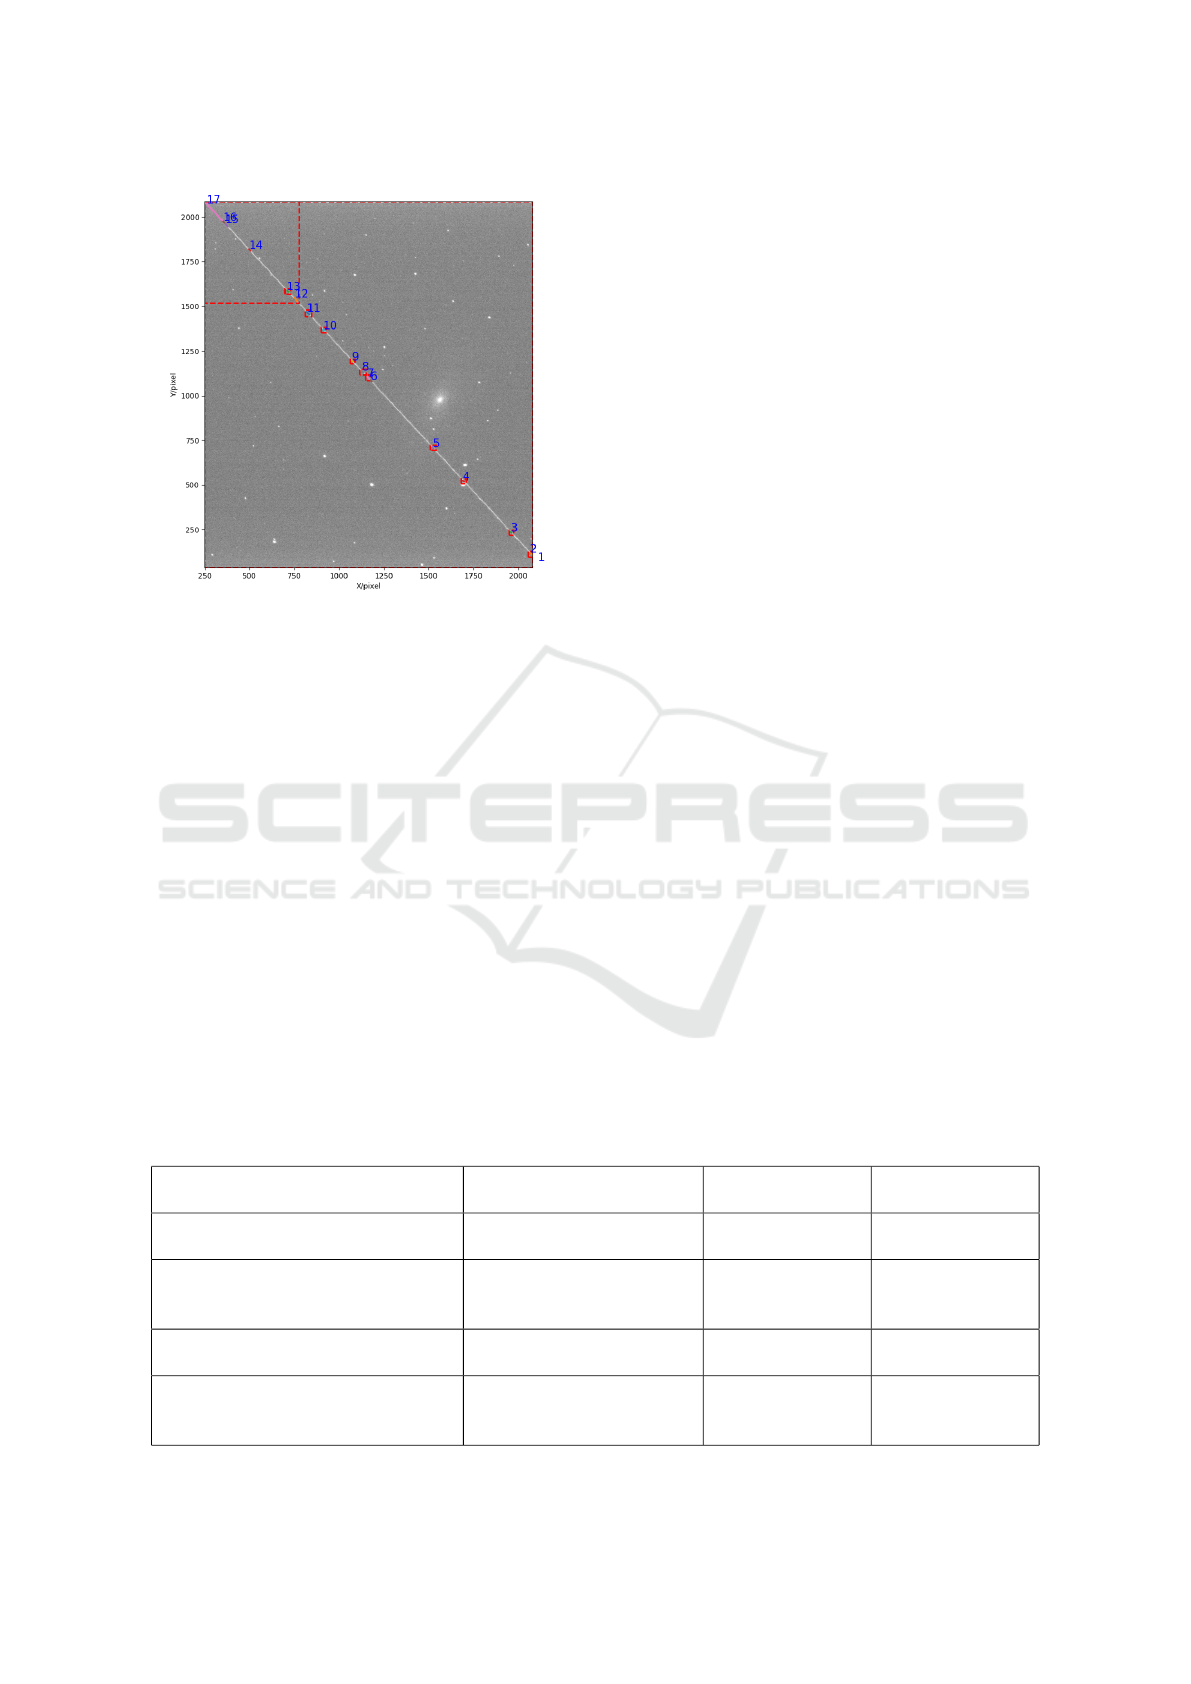
Figure 2: Graphical output of ASTRiDE, after the detec-
tion of a large streak in a FITS file captured during an ob-
servation session of the Messier 81 galaxy (stored in M81-
20220308.zip).
are proposed by ASTRiDE authors on the official
source code repository (Kim, 2016): by increasing
contour threshold and by reducing shape cut, we
avoided selecting FITS files that are impacted by mi-
nor tracking errors. Nevertheless, the selection was
still too large.
One of the advantage of ASTRiDE is its ability
of detecting faint streaks, allowing to detect images
damaged by bad tracking (wind, unexpected move-
ment of telescopes, etc.). For this use-case, and keep-
ing into account that our FITS raw images are noisy
and far from perfect (especially due to tracking prob-
lems), this tool is too sensitive and it is difficult to find
the configuration that leads to the detection of streaks
produced by satellites by ignoring other issues (Fig-
ure 1).
4.2 Detection with a Dedicated
ResNet50 Classifier and XRAI
We trained a dedicated classifier to detect images with
real streaks – and ignoring defects due to tracking.
As we have seen in the previous sections, there are
many tools available for this task, the aim is not to
re-invent the wheel. Our aim here is rather to have a
model that is fully compatible with our input data and
its specific characteristics (in particular the fact that it
is raw, unfiltered and not debayered).
To this end, we used ASTRiDE to filter FITS im-
ages without any streak and/or defect, as ASTRiDE
is a sensible and efficient tool for this task. Starting
from these images, we generated a dataset with syn-
thetic streaks to train and evaluate a binary classifier.
In practice, here are the steps followed:
• From the raw data described in Section 3, we built
a set of 25070 RGB images with 224x224 pixels
– cutting FITS images into patches to get a reso-
lution that fits to ResNet50 models.
• For each image, we applied a basic stretch to ad-
just the brightness and contrast to bring out details
and make faint structures more visible.
• Random synthetic streaks have been added on
half of the images, then we formed two distinct
groups, so as to associate a class with each im-
age: images with and images without streaks (we
made sure that each group was balanced – to have
a classifier with good recall). These streaks were
generated by drawing random lines, with different
thickness, sizes and color intensity.
• We made 3 sets: training, validation and test
(80%, 10%, 10%).
• A dedicated Python prototype was developed to
train a ResNet50 model to learn this binary clas-
sification. The basic image processing tasks were
Table 1: Experiments with ASTRiDE to detect streaks in FITS images of MILAN Sky Survey. Different settings for ASTRiDE
have been tested and compared.
Settings Filter FIST Files with
detected streaks
Observation ses-
sions impacted
Default (contour threshold=3, shape
cut=0.2)
At least one streak 8704/50068 198/205
Default (contour threshold=3, shape
cut=0.2)
At least one streak with
perimeter higher than 128
pixels
1316/50068 137/205
Optimized (contour threshold=5,
shape cut=0.1)
At least one streak 903/50068 101/205
Optimized (contour threshold=5,
shape cut=0.1)
At least one streak with
perimeter higher than 128
pixels
404/50068 82/205
DATA 2024 - 13th International Conference on Data Science, Technology and Applications
420
performed following best practices for optimizing
CPU/GPU usage (Castro et al., 2023).
• Empirically, the following hyper-parameters were
used for training: ADAM optimizer, learning rate
of 0.001, 50 epochs, 32 images per batch. We thus
obtained a ResNet50 model with an accuracy of
97% on the validation dataset. Note that other
architectures were also tested (such as VGG16
and MobileNetV2), but the results here are largely
similar.
• At the end, we obtained a model with a precision
of 0.940, a recall of 0.805 and then a F1-score of
0.867 (Table 2).
Inspired by recent works in the industrial (Roth
et al., 2022) and health domains (Chaddad et al.,
2023), and to check the robustness of the trained
Resnet50 model, we analysed the output with XRAI
(Region-based Image Attribution) (Kapishnikov et al.,
2019). Frequently used in eXplainable Artificial In-
telligence for Computer Vision tasks, XRAI is an in-
cremental method that progressively builds the attri-
bution scores of regions (i.e. the regions of the im-
age that are most important for classification). XRAI
is built upon Integrated Gradients (IG) (Sundararajan
et al., 2017) which uses a baseline (i.e. an image)
to create the attribution map. The baseline choice
is application-dependent, and in our case we oper-
ate under the assumption that a black one is appro-
priated because it corresponds to the sky background,
and the attribution maps is calculated according to
the XRAI integration path and reduces the attribution
scores given to black pixels. In practice, we used the
Python package saliency
3
and analysed the output of
the last convolution layer. To generate a heatmap indi-
cating the attribution regions with the greatest predic-
tive power, we keep only a percentage of the highest
XRAI attribution scores here (for instance, 10 %).
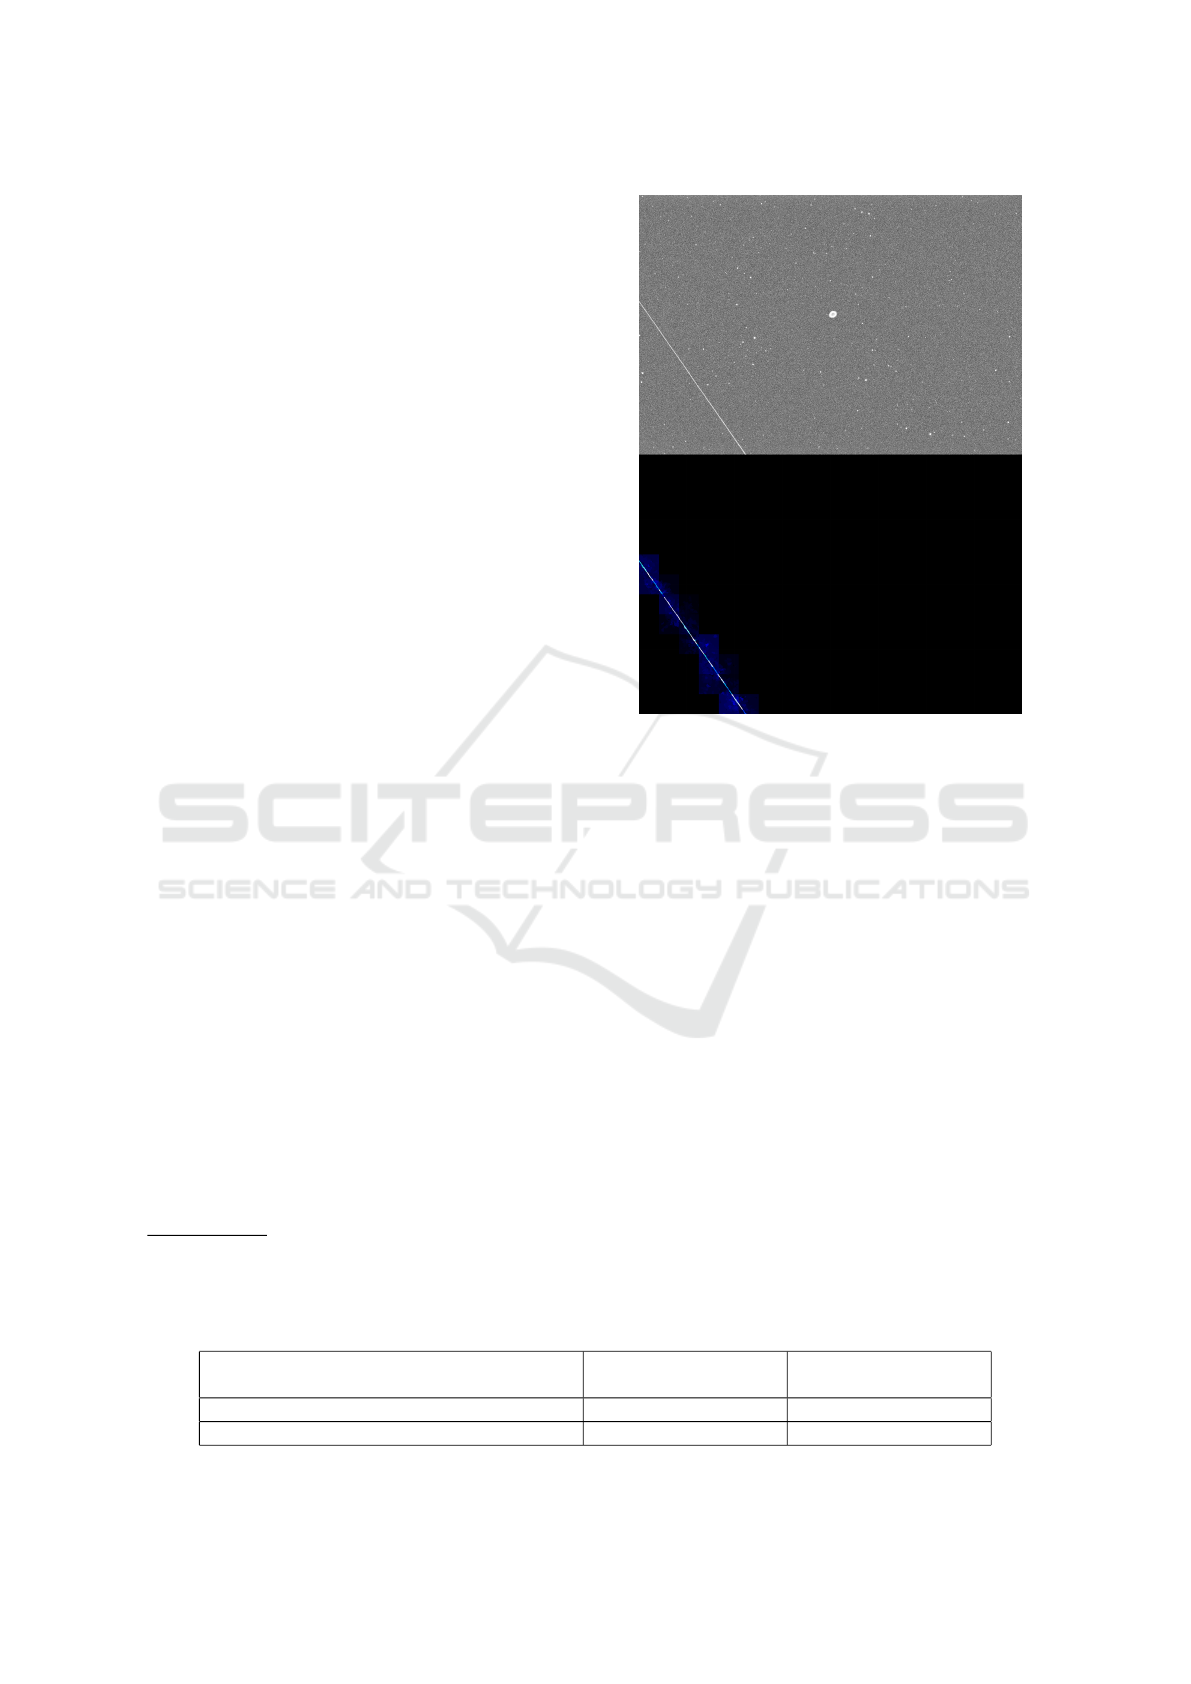
With this pipeline, we have found that streaks are
detected in 25 FITS files for a total of 50068 files,
i.e. less than 0.05 %; it detected than 18 observa-
tion sessions are impacted for a total of 205, i.e. 0.1
%. In this case, we visually noted with the heatmap
that the streaks are not caused by tracking problems,
but by objects passing through the instrument’s field
3
https://pypi.org/project/saliency/
Figure 3: At the top, a stretched 10-second frame of Messier
57. At the bottom, the XRAI heatmap highlighting the pix-
els that are considered by the Resnet50 classifier for detect-
ing the presence of streaks, by keeping 10% of the highest
XRAI attribution scores.
of view during observation, and very probably by
satellites. For example, we can mention the follow-
ing files present in (Parisot et al., 2023): image 44
in Barnard142-143-20220922.zip, image 22 in M17-
20220723.zip, image 40 in M57-20220602.zip, im-
age 87 in M65-20220426.zip, image 40 in M103-
20220808.zip, image 167 in M10-20220615.zip.
4.3 Fast Approximation with a Pix2Pix
Model
Computing a heatmap with XRAI comes at a cost: it
requires more computational time and resources than
a simple inference of the ResNet50 model. If we con-
sider the analysis of a 3584 × 3584 astronomical im-
age: with no overlap, it may be necessary to evalu-
ate the ResNet50 prediction and the XRAI heatmap
Table 2: Confusion matrix with results of the Resnet50 model on test set (i.e. set of images with synthetic streaks that were
randomly added).
Synthetic streak(s) de-
tected: NO
Synthetic streak(s) de-
tected: YES
FITS images without synthetic streak(s) 1886 103
FITS images with synthetic streak(s) 393 1619
Impact of Satellites Streaks for Observational Astronomy: A Study on Data Captured During One Year from Luxembourg Greater Region
421
for 256 patches of 224 × 224 pixels – this may take
some time depending on the hardware. To minimise
the number of calculations required, we can apply two
simple strategies:
• Reduce the size of the image to decrease the num-
ber of patches to be evaluated.
• Process only a relevant subset of patches – for
example, ignoring those for which the ResNet50
classifier detects nothing.
An other solution consists in estimating the
XRAI heatmap with Generative Adversarial Net-
works (GAN), a class of Deep Learning frameworks
that are frequently applied for Computer Vision tasks.
A GAN is composed of two Deep Learning mod-
els: a generator that ingests an image as input and
provides another image as output, and a discrimina-
tor which guides the generator during the training by
distinguishing real and generated images. Both are
trained together through a supervised process – with
the goal to obtain a generator that produces realistic
images. Among the numerous existing GAN archi-
tectures, we selected Pix2Pix – a conditional adver-
sarial approach that was designed for image to image
translation (Isola et al., 2017), and applied in many
use-cases such as image colouration and enhancement
(KumarSingh et al., 2023).
Thus, a Pix2Pix model has been designed to learn
the transformation from images with synthetic streaks
(like in Section 4.2) and images with the same syn-
thetic streaks but with an other color. We applied the
standard Pix2Pix architecture as described and imple-
mented with Tensorflow
4
, taking input images of 256
× 256 pixels, with the same resolution for outputs.
The loss function was based on the Peak Signal-to-
Noise Ratio (PSNR), and we trained the model dur-
ing 100 epochs, the batch size was set to 1, and the
process was realized with a learning rate of 0.0001.
To improve the training phase, as described in (Tran
et al., 2021), we applied random data augmentation
during each epoch with the imgaug Python package
(Jung, 2019).
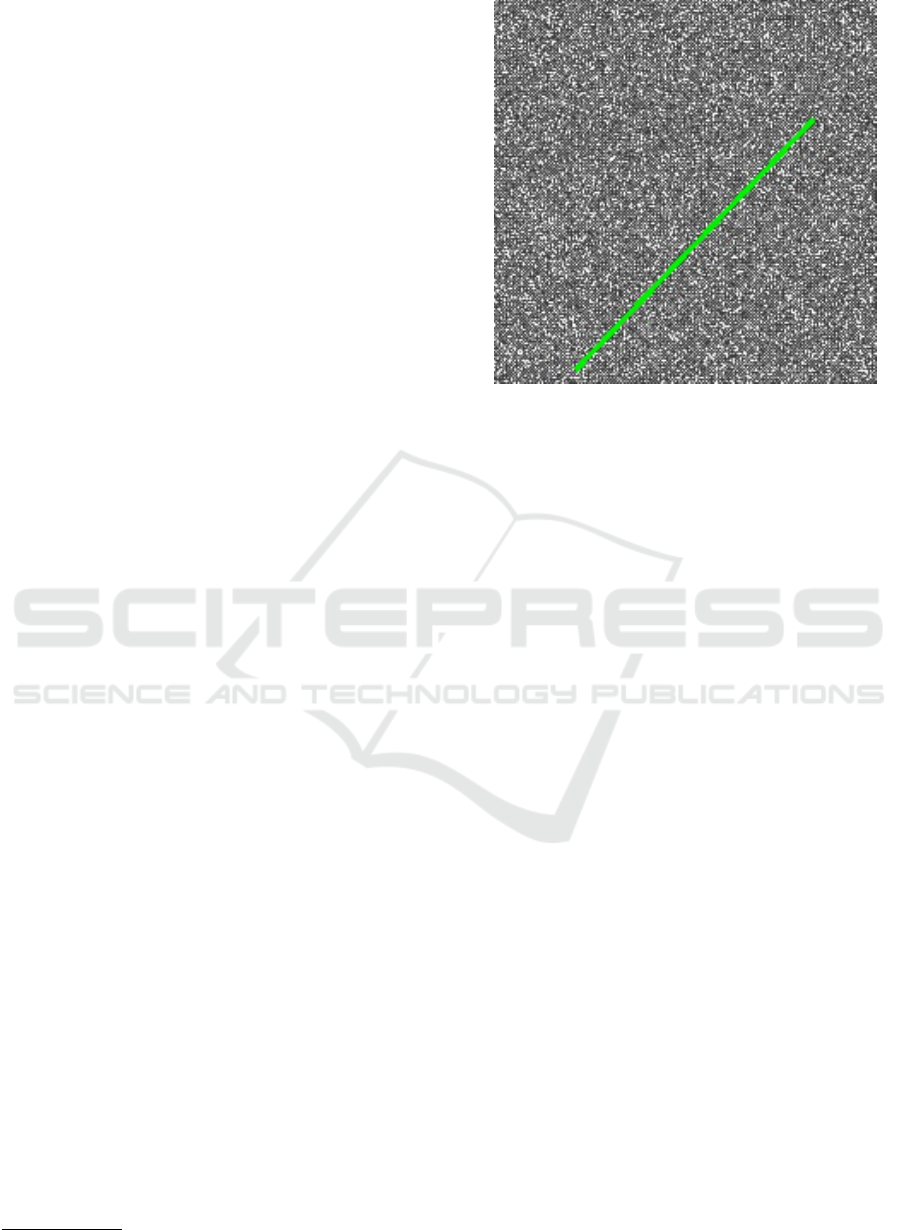
It led to a Pix2Pix model with a good PSNR
(higher that 38.5) – able to reproduce an annotated
image (Figure 4), similar to what can be obtained with
ResNet50 and the XRAI heatmap. We simply note
that this model is slightly more sensitive to noise, es-
pecially if it is grouped in zones (and this can some-
times happen with hot pixels (O’Brien, 2023)).
In terms of performances, running an inference
with the Pix2Pix model on a patch of 256 × 256 pix-
els is a better alternative to calculating a heatmap with
4
https://github.com/affinelayer/pix2pix-tensorflow
Figure 4: Example of 256x256 patch generated with a
Pix2Pix model – with highlighted streaks.
XRAI on a patch of 224 × 224 pixels: for example,
execution time is halved on a laptop without a GPU.
In practice, we used this Pix2Px model to visually
check the results obtained in the previous section, by
generating and then viewing the output of each image
in which a streak was detected.
5 DISCUSSIONS
As it is infeasible to check several tens of thousands
of raw images manually, we used different automated
methods to filter potentially affected images. It is pos-
sible that certain cases have not been identified, in
particular when obstacles in the image, tracking prob-
lems and streaks can be found in the same images.
Furthermore, the different approaches were tested
on images obtained with specific equipment (aper-
ture of 80mm, focal length of 400mm, recent CMOS
sensors, alt-azimuth mount) and imperfect conditions.
They can therefore be applied to images obtained
with identical equipment or with similar characteris-
tics (i.e. other models of smart telescopes with similar
technical characteristics). Conversely, applying these
techniques on images obtained with smaller or larger
focal length instruments would require constituting a
dataset that would contain this type of data, to then
re-train models.
DATA 2024 - 13th International Conference on Data Science, Technology and Applications
422

6 CONCLUSION AND
PERSPECTIVES
This paper presents various approaches based on
Deep Learning to detect streaks from astronomical
images captured with smart telescopes from Luxem-
bourg Greater Region, which required collecting data
for over 188 different targets visible from the North-
ern Hemisphere, with equipment accessible to ama-
teurs.
One approach consists in using ASTRiDE, and
this tool is efficient to detect images without streak.
The second one is a pipeline combining a ResNet50
binary classifier and the XRAI method, allowing the
detection of real streaks with a good accuracy. The
last one is an experimental model based on Genera-
tive AI in order to highlight the pixels corresponding
to the detected streaks.
As a result, we observed that less of 0.05 percent
of the captured raw images are damaged by streaks,
potentially caused by satellites. In this case it’s not
much, not enough to require special treatment to fix
the affected raw files, a simple filter here may be
enough to ignore them after detection.
In future work, we plan to reproduce and improve
the current tests on recent and future observations,
we plan to gather additional astronomical data
(especially from the South Hemisphere), and we will
work on optimizations to embed the presented Deep
Learning approaches into low resource devices.
Data Availability: The MILAN Sky Survey can
be accessed by following the links listed in (Parisot
et al., 2023). Additional materials used to support
the findings of this study may be available from the
corresponding author upon request.
ACKNOWLEDGEMENTS
This research was funded by the Luxembourg
National Research Fund (FNR), grant reference
15872557. Tests were realized on the LIST AIDA
platform, thanks to Raynald Jadoul and Jean-Franc¸ois
Merche.
REFERENCES
Barentine, J. C., Venkatesan, A., Heim, J., Lowenthal, J.,
Kocifaj, M., and Bar
´
a, S. (2023). Aggregate effects of
proliferating low-earth-orbit objects and implications
for astronomical data lost in the noise. Nature Astron-
omy, 7(3):252–258.
Calvi, J., Panico, A., Cipollone, R., De Vittori, A., Di Lizia,
P., et al. (2021). Machine learning techniques for de-
tection and tracking of space objects in optical tele-
scope images. In Aerospace Europe Conference 2021
(AEC-21), pages 1–17.
Castro, O., Bruneau, P., Sottet, J.-S., and Torregrossa, D.
(2023). Landscape of high-performance python to de-
velop data science and machine learning applications.
56(3).
Cegarra Polo, M., Yanagisawa, T., Kurosaki, H., Ohsawa,
R., and Sako, S. (2021). Streaks detection algorithm
implemented in gpu for the tomo-e camera at kiso ob-
servatory. In 8th European Conference on Space De-
bris, page 170.
Chaddad, A., Peng, J., Xu, J., and Bouridane, A. (2023).
Survey of explainable AI techniques in healthcare.
Sensors, 23(2):634.
Danarianto, M., Maharani, A., Falah, B., and Rohmah,
F. (2022). Prototype of automatic satellite streak
detection, identification and initial orbit determina-
tion pipeline from optical observation. In Journal
of Physics: Conference Series, volume 2214, page
012018. IOP Publishing.
Duarte, P., Gordo, P., Peixinho, N., Melicio, R., Val
´
erio,
D., Gafeira, R., et al. (2023). Space surveillance
payload camera breadboard: Star tracking and debris
detection algorithms. Advances in Space Research,
72(10):4215–4228.
Elhakiem, A., Ghoniemy, T., and Salama, G. (2023). Streak
detection in astronomical images based on convolu-
tional neural network. In Journal of Physics: Confer-
ence Series, volume 2616, page 012024. IOP Publish-
ing.
Hainaut, O. R. and Williams, A. P. (2020). Impact of satel-
lite constellations on astronomical observations with
eso telescopes in the visible and infrared domains. As-
tronomy & Astrophysics, 636:A121.
Isola, P., Zhu, J.-Y., Zhou, T., and Efros, A. A. (2017).
Image-to-image translation with conditional adversar-
ial networks. In Proceedings of the IEEE conference
on computer vision and pattern recognition, pages
1125–1134.
Jiang, Y., Tang, Y., and Ying, C. (2023). Finding a needle
in a haystack: Faint and small space object detection
in 16-bit astronomical images using a deep learning-
based approach. Electronics, 12(23):4820.
Jung, A. (2019). Imgaug documentation. https://imgaug.r
eadthedocs.io/.
Kapishnikov, A., Bolukbasi, T., Vi
´
egas, F., and Terry, M.
(2019). XRAI: Better attributions through regions. In
Proceedings of the IEEE/CVF International Confer-
ence on Computer Vision, pages 4948–4957.
Kim, D.-W. (2016). ASTRiDE: Automated Streak Detec-
tion for Astronomical Images. Astrophysics Source
Code Library, pages ascl–1605.
Kruk, S., Garc
´
ıa-Mart
´
ın, P., Popescu, M., Aussel, B., Dill-
mann, S., Perks, M. E., Lund, T., Mer
´
ın, B., Thomson,
R., Karadag, S., et al. (2023). The impact of satellite
Impact of Satellites Streaks for Observational Astronomy: A Study on Data Captured During One Year from Luxembourg Greater Region
423

trails on hubble space telescope observations. Nature
Astronomy, 7(3):262–268.
KumarSingh, N., Laddha, N., and James, J. (2023). An en-
hanced image colorization using modified generative
adversarial networks with pix2pix method. In 2023
International Conference on Recent Advances in Elec-
trical, Electronics, Ubiquitous Communication, and
Computational Intelligence (RAEEUCCI), pages 1–8.
IEEE.
Langston, S. and Taylor, K. (2024). Evaluating the benefits
of dark and quiet skies in an age of satellite mega-
constellations. Space Policy, page 101611.
Lawler, S. (2023). Bright satellites are disrupting astronomy
research worldwide.
Loke, S. C. (2017). Astronomical image acquisition using
an improved track and accumulate method. IEEE Ac-
cess, 5:9691–9698.
Lu, Y. (2024). Impact of starlink constellation on early
lsst: a photometric analysis of satellite trails with brdf
model. arXiv preprint arXiv:2403.11118.
Nir, G., Zackay, B., and Ofek, E. O. (2018). Optimal and
efficient streak detection in astronomical images. The
Astronomical Journal, 156(5):229.
O’Brien, M. (2023). Computer control of a telescope. In
A Deep Sky Astrophotography Primer, pages 73–94.
Springer.
Parisot, O., Bruneau, P., Hitzelberger, P., Krebs, G., and
Destruel, C. (2022). Improving accessibility for deep
sky observation. ERCIM News, 2022(130).
Parisot, O., Hitzelberger, P., Bruneau, P., Krebs, G., De-
struel, C., and Vandame, B. (2023). MILAN Sky Sur-
vey, a dataset of raw deep sky images captured during
one year with a Stellina automated telescope. Data in
Brief, 48:109133.
Roth, K., Pemula, L., Zepeda, J., Sch
¨
olkopf, B., Brox,
T., and Gehler, P. (2022). Towards total recall in
industrial anomaly detection. In Proceedings of the
IEEE/CVF Conference on Computer Vision and Pat-
tern Recognition, pages 14318–14328.
Sundararajan, M., Taly, A., and Yan, Q. (2017). Axiomatic
attribution for deep networks. In International confer-
ence on machine learning, pages 3319–3328. PMLR.
Tran, N.-T., Tran, V.-H., Nguyen, N.-B., Nguyen, T.-K.,
and Cheung, N.-M. (2021). On data augmentation for
GAN training. IEEE Transactions on Image Process-
ing, 30:1882–1897.
Tyson, J. A., Ivezi
´
c,
ˇ
Z., Bradshaw, A., Rawls, M. L., Xin,
B., Yoachim, P., Parejko, J., Greene, J., Sholl, M., Ab-
bott, T. M., et al. (2020). Mitigation of leo satellite
brightness and trail effects on the rubin observatory
lsst. The Astronomical Journal, 160(5):226.
Varela, L., Boucheron, L., Malone, N., and Spurlock, N.
(2019). Streak detection in wide field of view im-
ages using convolutional neural networks (cnns). In
Advanced Maui Optical and Space Surveillance Tech-
nologies Conference, page 89.
Venkatesan, A., Lowenthal, J., Prem, P., and Vidaurri, M.
(2020). The impact of satellite constellations on space
as an ancestral global commons. Nature Astronomy,
4(11):1043–1048.
Walker, C., Hall, J., Allen, L., Green, R., Seitzer, P., Tyson,
T., Bauer, A., Krafton, K., Lowenthal, J., Parriott, J.,
et al. (2020). Impact of satellite constellations on op-
tical astronomy and recommendations toward mitiga-
tions. Bulletin of the American Astronomical Society,
52(2).
DATA 2024 - 13th International Conference on Data Science, Technology and Applications
424
