
Strategic Placement of Data Centers for Economic Analysis: An Online
Algorithm Approach
Christine Markarian and Claude Fachkha
College of Engineering and Information Technology Department, University of Dubai, Dubai, U.A.E.
Keywords:
Data Center Location, Economic Growth, Data Analytics, Competitive Analysis, Online Algorithms.
Abstract:
Governments worldwide have increasingly recognized the transformative potential of data analytics in eco-
nomics, leading to the establishment of specialized research centers dedicated to economic analysis. These
centers serve as hubs for experts to dissect economic indicators, inform policymaking, and foster sustainable
growth. With data analytics playing a pivotal role in understanding economic trends and formulating policy
responses, the strategic placement of data centers becomes crucial. In this paper, we address the strategic
placement of data centers in urbanized environments within the framework of online algorithms. Online algo-
rithms are designed to make sequential decisions without complete information about future inputs, making
them suitable for dynamic urban environments. Specifically, we formulate the problem as the Online Data
Center Placement problem (ODCP) and design a novel online algorithm for it. To gauge our algorithm’s
effectiveness, we use competitive analysis, a standard method for assessing online algorithms. This method
compares our algorithm’s solutions with those of the optimal offline solution. Our study aims to provide a sys-
tematic approach for informed decision-making, optimizing resource usage, and fostering economic growth.
1 INTRODUCTION
Governments globally have acknowledged the power
of data analytics in economics. This led to the cre-
ation of research centers focused on analyzing eco-
nomic data, forecasting trends, and guiding policy-
making. These efforts highlight data analytics’ vi-
tal role in shaping economic policy, fostering inno-
vation, and promoting sustainable growth (Johnson
et al., 2021).
These specialized research centers are hubs of
economic analysis. They gather experts in statistics,
econometrics, and data science. Together, they dis-
sect economic indicators, understand market dynam-
ics, and identify emerging trends. Institutions like
central banks, finance ministries, and economic plan-
ning departments have set up dedicated research units.
These units have expertise in data analytics. They
support evidence-based policymaking and economic
analysis.
The benefits of data analytics in economics are
manifold. It helps governments gain valuable in-
sights into the economy’s health, make informed pol-
icy decisions, and respond effectively to economic
challenges. Economic indicators like Gross domes-
tic product (GDP) growth and inflation rates are an-
alyzed to understand economic trends, identify ar-
eas of concern, and formulate appropriate policy re-
sponses. Data analytics also facilitates the assessment
of policy interventions, the evaluation of program ef-
fectiveness, and the monitoring of progress towards
economic goals (Awan et al., 2021).
Recent government initiatives have witnessed the
establishment of new centers for data analytics in eco-
nomics globally. Examples range from the Bank of
England’s Data and Statistics Division (Bank of Eng-
land, 2024) to the United States (U.S.) Census Bu-
reau’s specialized units (United States Census Bu-
reau, 2024), alongside institutions like the German
Institute for Economic Research (DIW Berlin) (Ger-
man Institute for Economic Research (DIW Berlin),
2024) and the National Institute of Economic and
Social Research (NIESR) in the United Kingdom
(UK) (National Institute of Economic and Social Re-
search (NIESR), 2024). Moreover, governments in
Singapore, Australia, and other countries have in-
vested in data analytics capabilities to support eco-
nomic research, policy analysis, and forecasting (Liu
et al., 2023).
The focus of this paper centers around the strate-
gic placement of data centers to harness the transfor-
mative potential of data analytics in economics. As
Markarian, C. and Fachkha, C.
Strategic Placement of Data Centers for Economic Analysis: An Online Algorithm Approach.
DOI: 10.5220/0012788500003756
Paper published under CC license (CC BY-NC-ND 4.0)
In Proceedings of the 13th International Conference on Data Science, Technology and Applications (DATA 2024), pages 425-433
ISBN: 978-989-758-707-8; ISSN: 2184-285X
Proceedings Copyright © 2024 by SCITEPRESS – Science and Technology Publications, Lda.
425

governments worldwide increasingly recognize the
importance of data-driven insights in shaping eco-
nomic policy and fostering sustainable growth, the es-
tablishment of specialized research centers dedicated
to analyzing economic data has become paramount.
The strategic placement of data centers presents
challenges and objectives for governments. They aim
to maximize the effectiveness and accessibility of data
analytics capabilities while ensuring equitable access
to resources across regions. This involves considering
geographic distribution, population centers, partner-
ships, infrastructure, economic factors, and strategic
priorities.
Geographic distribution is crucial for govern-
ments. They aim to ensure equitable access to data
analytics resources across diverse regions, promot-
ing inclusivity and regional development initiatives.
Major urban areas serve as hubs of economic activ-
ity and innovation. They drive the placement of data
centers to leverage existing infrastructure and talent
pools. Collaborative initiatives with academic institu-
tions and private-sector partners shape the placement
of data centers. This amplifies the impact of data an-
alytics initiatives.
Robust infrastructure and connectivity are crucial
for data analytics platforms to work effectively, im-
pacting where data centers are located Governments
focus on places with good economic conditions and
incentives to attract investment, spurring economic
growth and job creation. Data center locations are
chosen to support strategic goals like regional de-
velopment, innovation clusters, and specific industry
sectors, aiming for sustainable economic progress.
Online algorithms and competitive analysis are
crucial in decision-making processes, notably in sit-
uations like placing research centers in urban areas
(Borodin and El-Yaniv, 2005; Albers, 2003). Online
algorithms decide sequentially without information
about future inputs. They’re vital in dynamic settings
where real-time decisions are needed based on incom-
plete or uncertain data. In location problems, like data
center placement, online algorithms help find the best
locations as demands change over time (Borodin and
El-Yaniv, 2005; Albers, 2003).
Competitive analysis uses the competitive ratio to
measure how well online algorithms work compared
to optimal offline ones. It gives insights into their ef-
fectiveness in real-world scenarios. The competitive
ratio compares the cost of the online algorithm to that
of an optimal offline solution. A ratio of 1 means the
online algorithm matches the offline one’s cost in the
worst-case scenario (Borodin and El-Yaniv, 2005; Al-
bers, 2003).
Achieving a competitive ratio of 1 is tough due to
real-world uncertainties. In location problems, chang-
ing demands, resource limits, and geography affect
online algorithm performance (Borodin and El-Yaniv,
2005; Albers, 2003). Analyzing the competitive ra-
tio in data center placement helps understand how on-
line algorithms handle dynamic decisions and uncer-
tainties. It helps governments and organizations im-
prove decision-making and resource allocation for ur-
banization and economic development (Borodin and
El-Yaniv, 2005; Albers, 2003).
Using online algorithms for data placement, es-
pecially in urbanization contexts, is advantageous
because they operate effectively under uncertainty.
These algorithms can make decisions without know-
ing the future, which suits dynamic and unpredictable
urban environments. While regrets may occur, evalu-
ating them with competitive analysis guarantees per-
formance.
2 OUR CONTRIBUTION
Data center placement in urban environments is a
complex problem that requires careful consideration
of many factors in order to achieve the best possi-
ble technological and economic outcomes. Let’s take
an example where a city administration has to choose
where to locate 100 possible data centers within its
urban area. Each data center’s establishment incurs
significant costs, covering initial construction, equip-
ment procurement, and infrastructure development,
averaging around C500,000 per center. Moreover,
annual operational expenses, including utility bills,
maintenance, and staffing, amount to approximately
C50,000 per center. Additionally, connecting these
data centers to 50 strategically located hubs intro-
duces further financial complexity, with connectiv-
ity costs averaging C100,000 per connection. These
costs fluctuate based on factors such as distance and
technological requirements. Furthermore, each data
center must handle incoming demands for data ana-
lytics services, incurring transportation and process-
ing complexity costs. Transportation costs, associ-
ated with data movement to and from the centers,
are estimated at C10,000 per demand-center pair,
while processing complexity costs amount to approx-
imately C20,000 per pair. The overarching objective
is to minimize establishment, operation, connectivity,
transportation, and processing complexity costs, en-
suring efficient delivery of data analytics services.
In this paper, we tackle the problem of strate-
gically positioning data centers in urbanized envi-
ronments from the perspective of online algorithms.
Specifically, we formulate the latter as the Online
DATA 2024 - 13th International Conference on Data Science, Technology and Applications
426

Data Center Placement problem (ODCP), outlined
below. We design an online algorithm for ODCP and
assess its performance using the competitive analy-
sis framework, widely recognized as the standard ap-
proach for evaluating online algorithms.
In this rapidly urbanizing world, the dynamic na-
ture of urban environments, characterized by continu-
ous population growth, evolving infrastructure needs,
and shifting socio-economic dynamics, presents a
complex challenge in strategically placing data cen-
ters. Our study aims to offer a systematic approach
to navigate this complexity, enabling informed deci-
sions that optimize resource utilization and stimulate
economic growth.
3 PROBLEM DESCRIPTION:
ONLINE DATA CENTER
PLACEMENT PROBLEM
(ODCP)
Given:
• A set L = {l
1
,l
2
,... ,l
m
} of potential locations
where data centers can be established. This set
represents the available locations where data cen-
ters can be built to serve the demands for data an-
alytics services.
• A set H = {h
1
,h
2
,. .. ,h
k
} of hub locations. These
locations serve as focal points for managing and
coordinating the network of data centers, facili-
tating communication, data aggregation, and cen-
tralized decision-making.
• Each potential data center location l
i
can be con-
nected to one of the hubs in H, incurring a con-
nectivity cost cc
ih
associated with establishing
and maintaining the network connection between
the potential data center l
i
and the hub h in H.
• A sequence D = {d
1
,d
2
,. .. ,d
n
} of demands rep-
resenting the arrival of data analytics needs over
time. These demands correspond to various fac-
tors such as geographical regions, population cen-
ters, economic hubs, and social or environmen-
tal contexts where data analytics services are re-
quired.
• Establishment costs ec
i
associated with estab-
lishing a data center at location l
i
. These costs
represent the expenses involved in setting up a
data center at each location l
i
. They include initial
construction costs, equipment procurement, and
infrastructure development.
• Operation costs oc
i
are expenses related to main-
taining and running a data center at location l
i
.
They encompass ongoing expenditures necessary
for efficient operations, including utility bills,
equipment maintenance, staffing, security mea-
sures, and other recurring expenses essential for
sustained functionality of the data center.
• Transportation costs tc
i j
associated with each
demand and data center pair. This cost represents
the expenses associated with transporting data or
resources to and from the data center to fulfill de-
mand d
j
. These costs include factors such as ship-
ping, logistics, and distribution expenses required
to move data or equipment to the designated data
center and deliver services to customers or de-
mands efficiently.
• Processing complexity costs pcc
i j
associated
with each demand and data center pair. This cost
reflects the computational resources and expertise
required to analyze and process the data associ-
ated with a particular demand at a specific data
center.
4 OBJECTIVE
In the online setting, demands arrive sequentially and
decisions regarding data center establishment, data
center-hub connections, and demand assignment must
be made without knowledge of future demands. Ad-
ditionally, once decisions are made, they cannot be
reversed. Upon the arrival of each demand, a decision
must be made whether to assign it to an existing data
center or to establish a new one and allocate the de-
mand accordingly. Furthermore, once a data center is
established, it must be promptly connected to one of
the designated hubs to ensure network functionality.
This can be more formally expressed as follows:
1. Each demand d
j
must be assigned to one data cen-
ter.
∑
i∈L
x
i j
= 1 for all j ∈ D
2. Each data center l
i
used for serving demands must
be connected to one hub. U is used to denote the
set of data centers to which demands are assigned.
∑
h∈H
y
ih
= 1 for all i ∈ U
Minimizing the total sum of establishment, op-
eration, connectivity, transportation, and processing
complexity costs associated with setting up and main-
taining the network of data centers, ensuring efficient
delivery of data analytics services across diverse geo-
graphical regions and demand scenarios, is our objec-
tive. This can be more formally expressed as follows:
Strategic Placement of Data Centers for Economic Analysis: An Online Algorithm Approach
427

Minimize:
∑
i∈L
ec
i
+
∑
i∈L
oc
i
+
∑
i∈L
∑
h∈H
cc
ih
+
∑
i∈L
∑
j∈D
tc
i j
+
∑
i∈L
∑
j∈D
pc
i j
The aim is to construct an online algorithm that
has a competitive ratio as close to 1 as possible. In this
pursuit, we adopt the oblivious adversary model for
our online algorithm, wherein the adversary’s actions
are predetermined and independent of the algorithm’s
decisions. Below is a summary of the Online Data
Center Placement problem (ODCP).
Online Data Center Placement Problem
Input:
• Set L = {l
1
,l
2
,. .. ,l
m
} of potential data
center locations.
• Set H = {h
1
,h
2
,. .. ,h
k
} of hub
locations.
• Sequence D = {d
1
,d
2
,. .. ,d
n
} of
demands.
• Establishment costs ec
i
.
• Operation costs oc
i
.
• Connectivity costs cc
ih
.
• Transportation costs tc
i j
.
• Processing complexity costs pcc
i j
.
Output:
• Demands arrive sequentially, prompting
decisions made without knowledge of
future demands.
• Upon each demand arrival d
j
, a decision
must be made to assign it to an existing
data center or establish a new one.
• Once a data center is established, it
must be promptly connected to one of
the designated hubs.
• The goal is to minimize establishment,
operation, connectivity, transportation,
and processing complexity costs, aiming
for a competitive ratio as close to 1 as
possible.
5 RELATED WORK
The problem at hand, the Online Data Center Place-
ment problem (ODCP), represents a broader form
of the Non-metric Online Facility Location problem
(NOCF). NOCF entails a scenario where a set of po-
tential facility locations, a set of client locations (ar-
riving sequentially over time), and a function repre-
senting the facility opening cost are given. The objec-
tive is to assign each client to an open facility while
aiming to minimize the total assignment and facility
opening costs. This broadness becomes evident when
we consider a specific instance of ODCP. Setting the
operation costs, the connectivity costs, the process-
ing complexity costs, and the number of hubs to zero
transforms the problem into NOCF. In this transfor-
mation, the transportation costs would correspond to
assignment costs and establishment costs to facility
opening costs.
NOCF, along with its variants, has garnered sig-
nificant attention within the online algorithm commu-
nity. Its lower bounds are followed by those for the
Online Set Cover problem (OSC) (Alon et al., 2003;
Korman, 2004). On the positive side, Alon et al. de-
vised a randomized O(log m log n)-competitive online
algorithm for NOCF., with m denoting the number of
facility locations and n the number of client locations.
Another approach involves reducing NOCF instances
to OSC instances and employing a deterministic al-
gorithm for OSC. This yields an O((logn + log m) ·
(logn + loglog m))-competitive ratio. More recently,
Bienkowski et al. (Bienkowski et al., 2021) intro-
duced an online deterministic polynomial-time algo-
rithm surpassing this bound, achieving an O(logm ·
(logn + loglog m))-competitive ratio. Other variants
of NOCF have been explored in the context of service
installation, service quality, and leasing (Markarian,
2021; Markarian, 2022; Markarian and auf der Heide,
2019).
It is important to note that the decisions in ODCP
regarding data center establishment, hub connectivity,
and demand assignment are interrelated. The choice
to establish a new data center impacts connectivity
costs, as it necessitates establishing connections with
one of the designated hubs. Therefore, these decisions
cannot be made independently but must be considered
together to optimize the overall cost and performance
of the network. Hence, while algorithms designed for
NOCF may provide insights, they cannot be directly
applied to ODCP due to the unique constraints and
interdependencies inherent in data center placement
and network optimization.
6 GRAPH-BASED
FORMULATION FOR ODCP
In this section, we formulate ODCP as an edge-
weighted graph problem, outlining the nodes, edges,
and objective of the problem.
DATA 2024 - 13th International Conference on Data Science, Technology and Applications
428

Nodes:
• We designate r as the root node.
• We pair each potential data center location l
i
from
the set L = {l
1
,l
2
,. .. ,l
m
} with two nodes. One is
identified as the original data center node l
i
, while
the other is its replica denoted as l
′
i
. Here, the set
L denotes the original data center nodes, while L
′
represents their corresponding replicas.
• We pair each hub h
i
from the set H =
{h
1
,h
2
,. .. ,h
k
} with a node, which we denote as
the hub node h
i
. Here, the set H represents the
hub nodes.
• Whenever a demand d
i
from the set D =
{d
1
,d
2
,. .. ,d
n
} arrives, we create a node for it,
denoted as the demand node d
i
. Here, the set D
represents the demand nodes.
Edges:
• An edge directed from each demand node to each
data center node is added. The edges’ weight is
set to the sum of the associated transportation and
processing complexity costs corresponding to the
demand and data center.
• An edge directed from each demand node d
i
to
each data center node l
j
is added. The edges’
weight corresponds to the sum of transportation
and processing complexity costs, denoted as tc
i j
and pcc
i j
respectively, for demand d
i
and data
center l
j
.
• An edge directed from each data center node l
i
to
its replica l
′
i
is added. The edges’ weight corre-
sponds to the sum of the establishment and op-
eration costs, denoted as ec
i
and oc
i
respectively,
associated with the data center l
i
.
• An edge directed from each replica data center
node l
′
i
to each hub node h
j
is added. The edges’
weight corresponds to the connectivity cost asso-
ciated with the data center and hub, denoted as
cc
i j
.
• An edge directed from each hub node h
i
to the root
node r is added and the weights of these edges are
adjusted to zero.
Figure 1 presents an example of a graph generated
from an input consisting of two demands, five data
center locations, and two hubs.
Objective: The problem asks the following. When-
ever a demand arises, the objective is to find, from
the demand node to the root node r, a directed path.
According to the problem formulation, this path com-
prises a data center node and a hub node. Once this
path is determined, we can identify the associated hub
with the hub node and the data center location with the
data center node along the path. The costs associated
with the solution are equivalent to the weights on the
edges. Specifically, we pay the costs associated with
the data center and the hub chosen along the path de-
termined by the solution. This mapping allows us to
derive a solution for the original non-graph problem,
the Online Data Center Placement problem (ODCP).
This strategic mapping not only enables us to de-
rive a solution for the original non-graph problem, the
Online Data Center Placement problem (ODCP), but
also ensures that the competitive ratio remains consis-
tent. This is achieved by inherently maintaining the
cost alignment within the formulation itself, thereby
preserving parity between the graph-based problem
and the original non-graph problem formulation.
7 ONLINE ALGORITHM DESIGN
We introduce, in this section, an online algorithm for
the Online Data Center Placement problem (ODCP),
utilizing the graph formulation outlined earlier.
An instance of ODCP consists of a set L of po-
tential data center locations and a set H of hub loca-
tions, accompanied by their respective establishment,
operation, and connectivity costs. The sequence D of
demands unfolds incrementally as the algorithm ad-
vances. Each step introduces a new demand, along
with its associated transportation and processing com-
plexity costs.
The algorithm initiates by building the nodes,
edges, and their associated weights for the data center
and hub sets. Subsequently, as each demand is un-
veiled, the algorithm generates a node, incorporating
its relevant edges and weights.
A demand d
i
∈ D arrives. We represent the graph
created by the aforementioned formulation as G =
(V,E). We refer to the graph problem variant of
ODCP as ODCP
g
. The algorithm associates each
edge e ∈ E with a fractional value that is set to 0
and increases gradually as the algorithm progresses.
These fractions collectively form a fractional solution
for ODCP
g
. The algorithm primarily focuses on con-
structing a fractional solution for ODCP
g
and incre-
mentally converting it into an integral solution upon
the arrival of new demands. We let c
e
denote the cost
and f
e
the fraction of edge e. For each demand that ar-
rives, the algorithm outputs a collection of edges that
form a path from the demand node d
i
to the root node
r. Once such a path is established, we can identify the
corresponding hub and data center nodes along the
path.
Strategic Placement of Data Centers for Economic Analysis: An Online Algorithm Approach
429
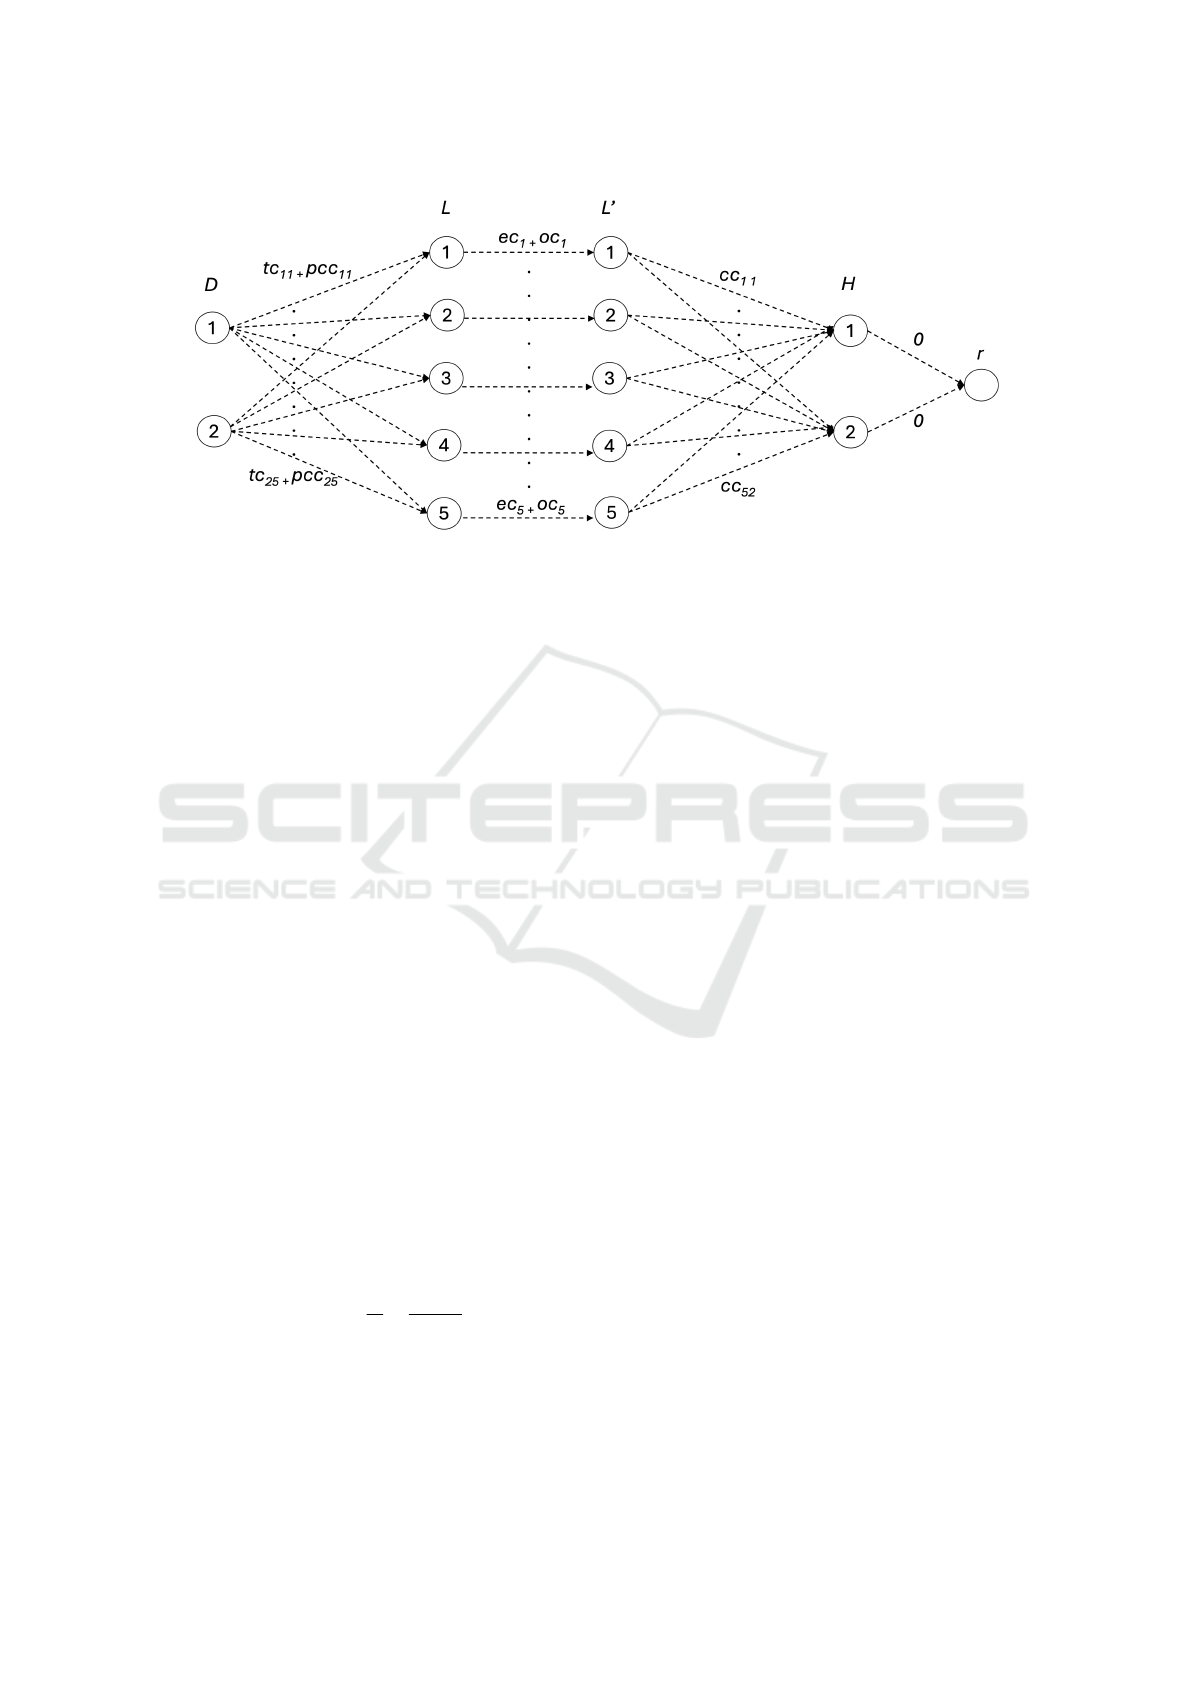
Figure 1: ODCP Instance - Graph Formulation.
The algorithm utilizes a stochastic decision-
making procedure governed by a parameter α. This
parameter is calculated as the smallest value within
2⌈log(n + 1)⌉ independently selected random vari-
ables, with uniform distribution between 0 and 1, with
n denoting the count of demands. Further clarification
regarding this selection is provided in the competitive
analysis segment.
The algorithm involves concepts related to net-
work flows and connectivity, specifically focusing on
the principles of maximum flow and minimum cut.
The maximum flow between node u and node v in a
graph represents the minimum cut from u to v—the
smallest total fraction of edges that, if do not exist
anymore, would disconnect u from v.
Input: L = {l
1
,l
2
,. .. ,l
m
}, H = {h
1
,h
2
,. .. ,h
k
},
d
i
∈ D, and the associated establishment, operation,
connectivity, transportation, and processing complex-
ity costs.
Output: Set E
′
⊂ E of edges of G = (V, E) corre-
sponding to the data centers, hubs, and demand-data
center assignments forming the current solution for
ODCP
g
.
The algorithm works as follows:
1. As long as the maximum flow from d
i
to r in G
is below 1, form a minimum cut Q from d
i
to r
in G. Observe every edge e ∈ Q and augment the
following fraction:
f
e
= f
e
+
f
e
c
e
+
1
|
Q
|
· c
e
2. Output every edge e if f
e
exceeds α.
3. If the edges in the current solution do not create a
feasible path for demand d
i
, find a feasible path of
minimum cost and add its edges to the solution.
4. Add the data center(s) and hub(s) associated with
the edges outputted in the previous phase. Assign
the demand to the data center associated with the
solution path.
8 COMPETITIVE ANALYSIS AND
PERFORMANCE EVALUATION
In the third and fourth phases of the algorithm, edges
are acquired. In the third phase, selections are in-
fluenced by a stochastic process, while in the fourth
phase, choices are tailored to ensure a feasible output.
Let Optimal
solution
represent the cost of the opti-
mal offline solution and f rac signify the cost of the
fractional solution formed by the algorithm.
Selections Based on Stochastic Process: Consider
S
′
as the collection of edges acquired in the algo-
rithm’s third phase, with C
S
′
denoting its anticipated
cost. These edges are procured according to the
stochastic process previously outlined. Let’s desig-
nate l as an integer ranging from 1 to 2
⌈
log(n + 1)
⌉
,
and e as an edge. We define X
e,l
as the variable indi-
cating whether e is selected by the algorithm through
the stochastic process.
C
S
′
=
∑
e∈S
′
2⌈log(n+1)⌉
∑
l=1
Expectation[X
e,l
] · c
e
= 2
⌈
log(n + 1)
⌉
∑
e∈S
′
f
e
c
e
(1)
Consider that the summation of c
e
f
e
over all edges
in S
′
is bounded above by the cost of the fractional so-
lution. This comparison can be drawn against the op-
timal offline solution. The underlying concept is that
DATA 2024 - 13th International Conference on Data Science, Technology and Applications
430

whenever the algorithm increases a fraction, it does
not surpass 2. Additionally, the total count of fraction
increments can be gauged in relation to the cost of the
optimal offline solution.
Each edge e in a minimum cut Q contributes to
a fraction increase, quantified as
f
e
c
e
+
1
|
Q
|
·c
e
. The
algorithm executes a fraction increase solely when the
maximum flow is under 1. Thus,
∑
e∈Q
f
e
< 1 before
any such increment. Consequently, the upper limit for
each fraction increase is:
∑
e∈Q
f
e
c
e
+
1
|
Q
|
· c
e
· c
e
< 2 (2)
Ultimately, in each minimum cut Q, the algorithm
is ensured to include an edge e from the optimal of-
fline solution, as Q necessitates having an edge from
every path by definition. Referring to the equation
governing the fraction increase, once O(log |Q|) frac-
tion increases occur, the fraction f
e
for e reaches 1,
and further increments are precluded since e won’t
appear in any subsequent minimum cut. The magni-
tude of any minimum cut is limited by m, denoting the
number of facilities or the maximum available paths
from d
i
to the root r. Consequently, we are now able
to constrain the fractional solution:
O(logm ·Optimal
solution
) ≥ frac (3)
Equations 1, 2, and 3 allow us to deduce an up-
per bound for the expected cost C
S
′
of the edges pur-
chased in the third phase of the algorithm:
O(log(kn)logm ·Optimal
solution
) ≥ C
S
′
(4)
Choices Ensuring Feasibility: Consider S
′′
as the
collection of edges acquired in the fourth phase of the
algorithm, with C
S
′′
representing its anticipated cost.
These edges are procured by the algorithm solely
when a path hasn’t been acquired via the stochastic
process in the third phase. With each path purchase in
this stage, the algorithm ensures that its cost doesn’t
surpass Optimal
solution
, as it acquires a path of mini-
mum cost.
Consider a specific demand d
i
. Let Q
j+1
denote a
minimum cut created after the algorithm has procured
a path from d
i
to r and has finished the first phase.
The probability of acquiring this path in the l-th trial,
where 1 ≤ l ≤ 2
⌈
log(n + 1)
⌉
, is:
∏
e∈Q
j+1
(1 − f
e
) ≤ e
−
∑
e∈Q
j+1
f
e
e
−
∑
e∈Q
j+1
f
e
≤
1
e
It’s notable that the last inequality is true because
the algorithm guarantees that
∑
e∈Q
j+1
f
e
≥ 1 by the
end of the first phase (as per the Max-flow min-cut
theorem). The expected cost of acquiring the ( j + 1)
th
path across all 1 ≤ l ≤ 2
⌈
log(n + 1)
⌉
trials is less than
1/n
2
· Optimal
solution
.
– (individual demand cost) Let’s initiate by assess-
ing the anticipated cost attributed to a single de-
mand. Select a demand d
i
. Assume Q
j+1
as the
minimum cut formed after the algorithm procures
a path and concludes the first phase. The probabil-
ity of acquiring the path for a single trial, denoted
by 1 ≤ l ≤ 2
⌈
log(n + 1)
⌉
, can be expressed as:
∏
e∈Q
j+1
(1 − f
e
) ≤ e
−
∑
e∈Q
j+1
f
e
≤ 1/e
– (cumulative cost of all demands) The total ex-
pected cost incurred by all n
′
incoming demands
is bounded by:
n
′
·1/n
2
·Optimal
solution
≤ n·1/n
2
·Optimal
solution
= 1/n · Optimal
solution
Consequently, the expected cost C
S
′′
of the edges
purchased in the fourth phase of the algorithm is
given by:
C
S
′′
≤ 1/n · Optimal
solution
(5)
Hence, we can infer the subsequent theorem.
Theorem 1. For the Online Data Center Place-
ment problem (ODCP), a randomized algorithm oper-
ates online with a competitive ratio of O(log n log m).
Here, m refers to the number of data center locations
and n denotes the quantity of demands.
9 NUMERICAL EXAMPLE
Consider an urbanized area with significant economic
activity and technological infrastructure. In this sce-
nario, there are 1000 potential locations suitable for
data center deployment and 500 hub locations strate-
gically positioned to ensure efficient network connec-
tivity. With the increasing reliance on digital ser-
vices in urban environments, there are 5000 demands
for various digital applications, reflecting the diverse
needs of the population.
Applying competitive analysis for the Online Data
Center Placement problem (ODCP), we find that a
randomized algorithm operates online with a compet-
itive ratio of O(log n log m), with m denoting the num-
ber of data center locations (1000) and n the quantity
of demands (5000). Thus, in our numerical example,
the competitive ratio is O(log5000×log 1000), which
ensures the algorithm’s efficiency and effectiveness in
Strategic Placement of Data Centers for Economic Analysis: An Online Algorithm Approach
431

handling the substantial demands and data center lo-
cations in the urban environment.
Moreover, the scalability of the algorithm is ev-
ident in its ability to handle even larger numbers of
demands and potential data center locations. No mat-
ter how many more demands arise or how many ad-
ditional potential data center locations are identified,
the algorithm’s competitive ratio remains consistent,
making it a highly scalable solution for data center
placement in urbanized environments.
10 ALGORITHMIC
TECHNIQUES AND KEY
INSIGHTS
The techniques we use are commonly used to tackle
problems within the realm of online algorithm design.
Our algorithm utilizes network flow analysis princi-
ples to determine the path from each demand node to
the root node in a graph representing the Online Data
Center Placement problem. It employs a stochastic
decision-making process introducing randomness to
enhance decision flexibility. By constructing frac-
tional solutions iteratively, the algorithm incremen-
tally converts them into integral solutions, facilitat-
ing adaptability to evolving demands. Employing a
greedy augmentation strategy, the algorithm gradu-
ally increases the flow along edges forming minimum
cuts, aiming to approach the maximum flow limit ef-
ficiently. Additionally, it constructs minimum-cost
paths when the current solution does not form a fea-
sible solution for the current demand, ensuring cost-
effective connectivity. These algorithmic techniques
collectively enable the algorithm to efficiently solve
the Online Data Center Placement problem.
Several mathematical methods, such as graph the-
ory, stochastic processes, and probabilistic theory, are
integrated in the evaluation of the algorithm for the
Online Data Center Placement problem. The prob-
lem is modeled as a graph using the concepts of graph
theory, where nodes stand in for data centers, hubs,
and demand locations, and edges for the connections
and expenses that exist between them. In the third
stage of the algorithm, edge selection is guided by
stochastic processes, which introduce randomness to
adjust to changing conditions and optimize cost. This
stochastic process is supported by probability the-
ory, which allows the algorithm to make probabilis-
tic decisions based on random variables and distribu-
tions. These mathematical methods are combined by
the algorithm to produce a competitive ratio analysis,
which sheds light on how well it functions in online
scenarios.
We provide a comprehensive framework for data
center placement in urban environments using our al-
gorithmic approach, which has demonstrable bene-
fits for cost-effectiveness, scalability, flexibility, and
real-time decision-making as well as urban devel-
opment planning. By leveraging online algorithms,
our approach facilitates prompt responses to chang-
ing demands and emerging trends in dynamic ur-
ban environments, enhancing agility and adaptability
in decision-making processes. Through competitive
analysis, our algorithm provides cost-effective solu-
tions relative to optimal offline algorithms, empower-
ing governments and organizations to make informed
decisions within budgetary constraints and resource
allocations. With its scalable and flexible nature, our
algorithm accommodates diverse demand levels, ge-
ographical distributions, and infrastructure require-
ments, ensuring adaptability to evolving urban land-
scapes and economic dynamics. Moreover, our al-
gorithm contributes to evidence-based urban develop-
ment planning by analyzing data-driven insights and
economic indicators to strategically place data cen-
ters, fostering economic growth, innovation, and re-
gional development in alignment with broader urban
planning objectives and sustainability goals.
11 CONCLUSION AND FUTURE
DIRECTIONS
In conclusion, our study sheds light on the criti-
cal role of data analytics in shaping economic pol-
icy and fostering sustainable growth, underscored by
the strategic placement of data centers. Through the
lens of online algorithms, we address the challenge
of dynamically situating data centers in urbanized en-
vironments, considering factors such as geographic
distribution, infrastructure, and economic priorities.
Our novel approach, encapsulated in the Online Data
Center Placement problem formulation and algorithm
design, offers a systematic framework for decision-
making amidst uncertainty and evolving demands.
One possible future direction is to investigate the
application of our algorithm in data centers and ur-
banized environments, either in real or simulated en-
vironments. Practical testing allows for evaluation
under real-world conditions, taking into account fac-
tors like data variability and constraints related to
urban infrastructure, while competitive analysis of-
fers insightful information about theoretical worst-
case scenarios. We can learn more about the algo-
rithm’s performance in dynamic urban landscapes and
its strengths and limitations in handling real-time data
DATA 2024 - 13th International Conference on Data Science, Technology and Applications
432

and decision-making in the context of data center
placement strategies by conducting practical evalua-
tions in urbanized environments.
Further research could expand our model to in-
corporate data security and infrastructure resilience.
Infrastructure resilience is the process of strategically
placing data centers to fortify urban infrastructure net-
works against external shocks such as cyberattacks
and natural disasters. To reduce failures and increase
redundancy, this involves determining key sites. In-
tegrating data security goals also guarantees privacy
requirements are followed and sensitive data is pro-
tected. By taking these aspects into account, data cen-
ter location techniques are improved and help create
safe and dependable urban data ecosystems, which
are essential for reliable data-driven urban develop-
ment projects.
Combining data center location methods with
more general smart city initiatives to improve urban
efficiency, sustainability, and quality of life is an in-
triguing new direction for future research. With this
integration, there is a chance to use data analytics to
improve public services, transit networks, urban in-
frastructure, and even data center locations. Cities
may optimize the benefits of data-driven approaches
to societal issues and create synergies by matching
data center site decisions with smart city objectives.
REFERENCES
Albers, S. (2003). Online algorithms: a survey. Mathemat-
ical Programming, 97:3–26.
Alon, N., Awerbuch, B., and Azar, Y. (2003). The on-
line set cover problem. In Proceedings of the Thirty-
Fifth Annual ACM Symposium on Theory of Comput-
ing, STOC ’03, page 100–105, New York, NY, USA.
Association for Computing Machinery.
Awan, U., Shamim, S., Khan, Z., Zia, N. U., Shariq, S. M.,
and Khan, M. N. (2021). Big data analytics capabil-
ity and decision-making: The role of data-driven in-
sight on circular economy performance. Technologi-
cal Forecasting and Social Change, 168:120766.
Bank of England (Accessed: 2024). Bank of England
Statistics Research Datasets.
Bienkowski, M., Feldkord, B., and Schmidt, P. (2021). A
nearly optimal deterministic online algorithm for non-
metric facility location. In Bl
¨
aser, M. and Monmege,
B., editors, 38th International Symposium on Theoret-
ical Aspects of Computer Science (STACS 2021), vol-
ume 187 of Leibniz International Proceedings in In-
formatics (LIPIcs), pages 14:1–14:17, Dagstuhl, Ger-
many. Schloss Dagstuhl – Leibniz-Zentrum f
¨
ur Infor-
matik.
Borodin, A. and El-Yaniv, R. (2005). Online computation
and competitive analysis. cambridge university press.
German Institute for Economic Research (DIW Berlin) (Ac-
cessed: 2024). German Institute for Economic Re-
search (DIW Berlin).
Johnson, M., Jain, R., Brennan-Tonetta, P., Swartz, E., Sil-
ver, D., Paolini, J., Mamonov, S., and Hill, C. (2021).
Impact of big data and artificial intelligence on indus-
try: developing a workforce roadmap for a data driven
economy. Global Journal of Flexible Systems Man-
agement, 22(3):197–217.
Korman, S. (2004). On the use of randomization in the on-
line set cover problem. Weizmann Institute of Science,
2.
Liu, R., Sun, W., and Hu, W. (2023). Placement of high
availability geo-distributed data centers in emerging
economies. IEEE Transactions on Cloud Computing.
Markarian, C. (2021). Online non-metric facility location
with service installation costs. In ICEIS (1), pages
737–743.
Markarian, C. (2022). Online non-metric facility location
with service-quality costs. In ICEIS (1), pages 616–
622.
Markarian, C. and auf der Heide, F. M. (2019). Online algo-
rithms for leasing vertex cover and leasing non-metric
facility location. In ICORES, pages 315–321.
National Institute of Economic and Social Research
(NIESR) (Accessed: 2024). National Institute of Eco-
nomic and Social Research (NIESR).
United States Census Bureau (Accessed: 2024). United
States Census Bureau Special Census Program.
Strategic Placement of Data Centers for Economic Analysis: An Online Algorithm Approach
433
