
Discretization Strategies for Improved Health State Labeling in
Multivariable Predictive Maintenance Systems
Jean-Victor Autran
1,2
, V
´
eronique Kuhn
1
, Jean-Philippe Diguet
2
, Matthias Dubois
1
and C
´
edric Buche
3
1
ArianeGroup, Issac, France
2
IRL CROSSING, CNRS, Adelaide, Australia
3
ENIB, Brest, France
Keywords:
Data Labeling, Discretization, Predictive Maintenance, Data Preprocessing.
Abstract:
In machine learning, effective data preprocessing, particularly in the context of predictive maintenance, is a
key to achieving accurate predictions. Predictive maintenance datasets commonly exhibit binary health states,
offering limited insights into transitional phases between optimal and failure states. This work introduces an
approach to label data derived from intricate electronic systems based on unsupervised discretization tech-
niques. The proposed method uses data distribution patterns and predefined failure thresholds to discern the
overall health of a system. By adopting this approach, the model achieves a nuanced classification that not only
distinguishes between healthy and failure states but also incorporates multiple transitional states. These states
act as intermediary phases in the system’s progression toward potential failure, enhancing the granularity of
predictive maintenance assessments. The primary objective of this methodology is to increase anomaly detec-
tion capabilities within electronic systems. Through the utilization of unsupervised discretization, the model
ensures a data-driven approach to system monitoring and health evaluation. The inclusion of multiple tran-
sitional states in the labeling process facilitates a more precise predictive maintenance framework, enabling
informed decision-making in maintenance strategies. This article contributes to advancing the effectiveness of
predictive maintenance applications by addressing the limitations associated with binary labeling, ultimately
encouraging a more nuanced and accurate understanding of system health.
1 INTRODUCTION
Labels in datasets are crucial in the use of super-
vised machine learning, their quality directly affects
the performance of prediction (Budach et al., 2022).
For instance, in predictive maintenance, a crucial en-
deavor is reducing failures and associated costs by
predicting issues (Mobley, 2002; Ran et al., 2019).
The quality of labels is then directly linked to the reli-
ability of whether or not failures are predicted before
they occur and deviate from optimal states.
While machine learning techniques have shown
promise in predictive maintenance (Carvalho et al.,
2019), the reliance on traditional supervised labeling
methods presents significant challenges. Manual an-
notation of data is time-consuming, often requiring
expert knowledge, and can lead to limitations in scal-
ability and efficiency. Moreover, in the context of
electronic systems, the dynamic and intricate nature
of data poses challenges for accurate labeling with
health indicators or Remaining Useful Life (RUL).
Consequently, this research aims to explore data la-
beling within complex electronic systems.
In response to the limitations of traditional label-
ing methods, the goal of this study is to propose an
approach of unsupervised labeling using discretiza-
tion techniques for electronic systems. Discretiza-
tion methods, such as Equal Width (EW) and Equal
Frequency (EF) (Catlett, 1991), provide an unsuper-
vised method for classifying parameters into cate-
gories such as health states. By incorporating failure
thresholds, a clear distinction can be established be-
tween healthy, failure, and transition states for each of
the system parameters. By combining those, a global
state of the system can be created, giving a more de-
tailed system health assessment compared to common
binary states in public datasets (Tan and Raghavan,
2010).
The proposed approach significantly enhances the
details by determining new transition states to assess
the system’s health. This detailed prediction capabil-
ity facilitates decision-making since it provides more
434
Autran, J., Kuhn, V., Diguet, J., Dubois, M. and Buche, C.
Discretization Strategies for Improved Health State Labeling in Multivariable Predictive Maintenance Systems.
DOI: 10.5220/0012788800003756
Paper published under CC license (CC BY-NC-ND 4.0)
In Proceedings of the 13th International Conference on Data Science, Technology and Applications (DATA 2024), pages 434-441
ISBN: 978-989-758-707-8; ISSN: 2184-285X
Proceedings Copyright © 2024 by SCITEPRESS – Science and Technology Publications, Lda.
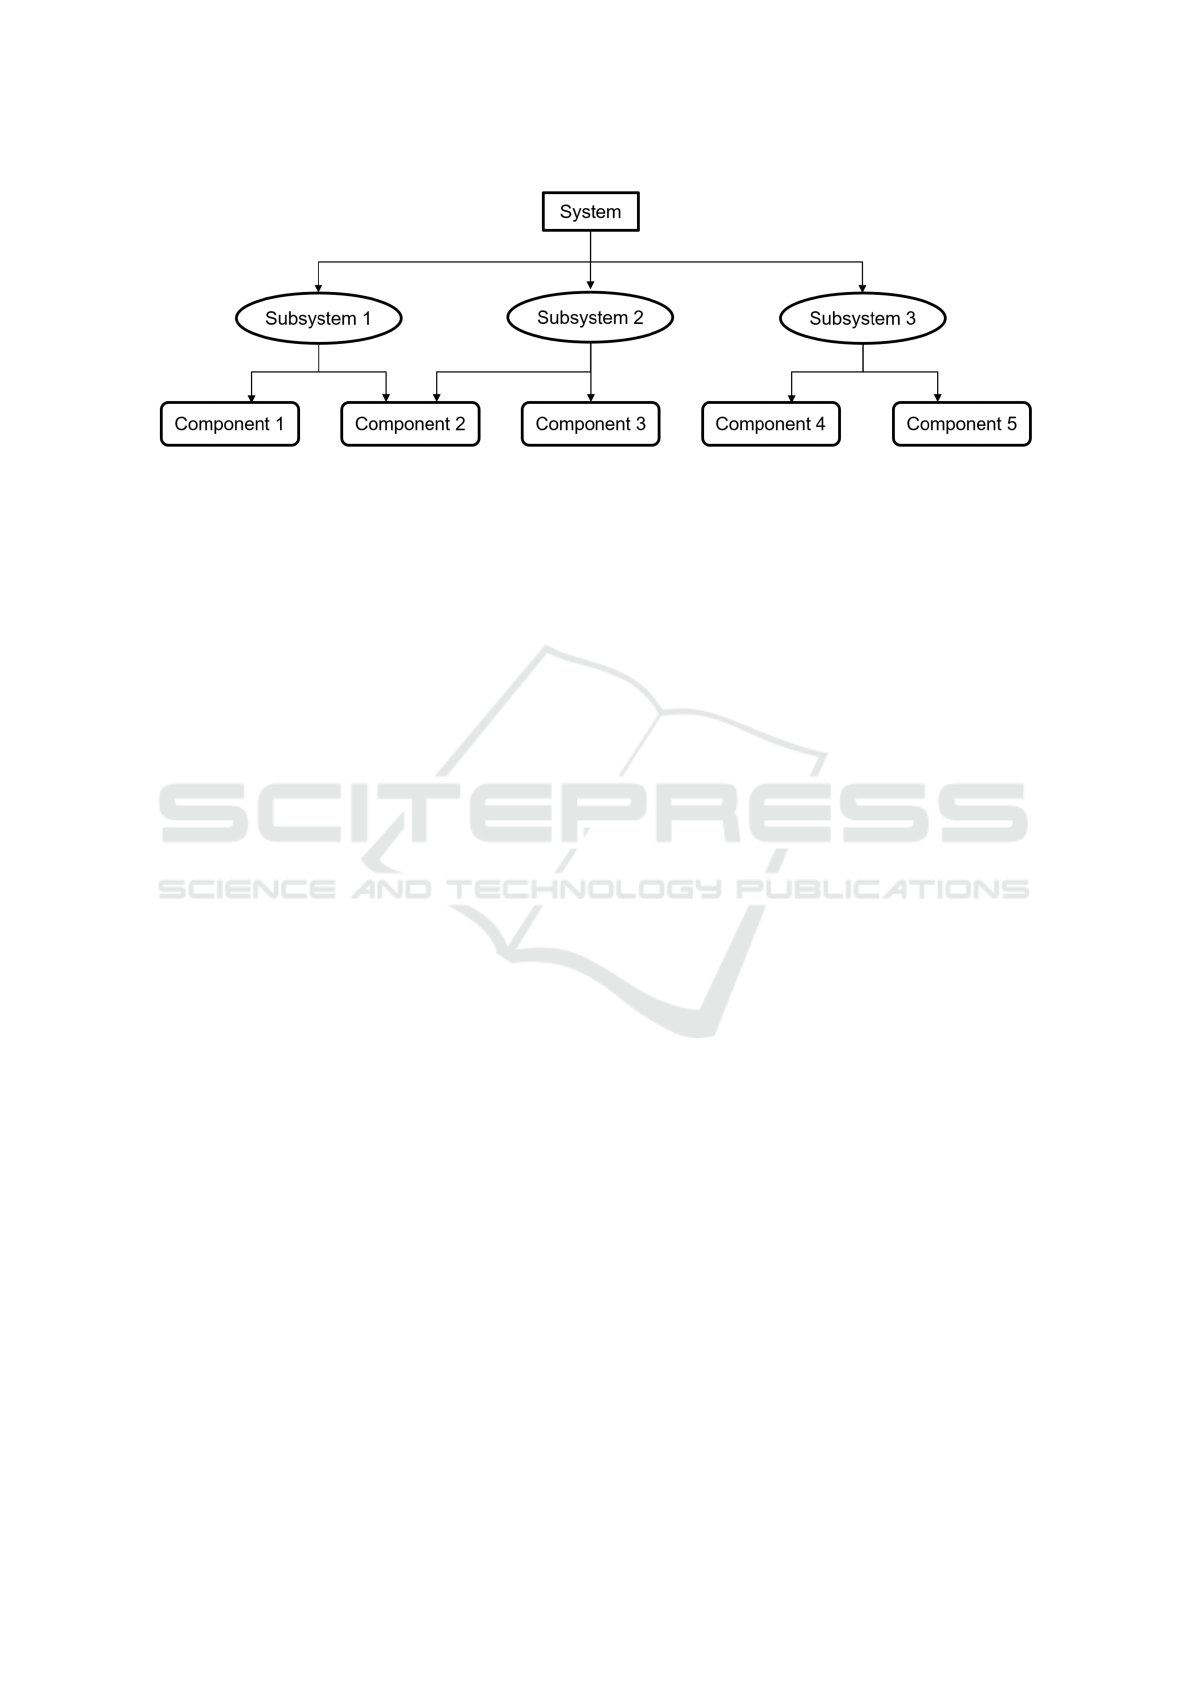
Figure 1: Example of a multilevel system’s structure.
information. It enables system administrators to take
proactive actions, thereby minimizing downtime and
optimizing system reliability (Mobley, 2002). The
proposed method is versatile and scalable. It can be
generalized to handle complex, multi-component sys-
tems, broadening its applicability in system health la-
beling.
The article is organized as follows. First, the
context of predictive maintenance and labeling is
explored in the domain of electronic maintenance.
Secondly, the proposed labeling methodology is ex-
plained, discussing the application of unsupervised
discretization methods. Then the results of labeling
are presented and discussed for a public dataset. Fi-
nally, the last part concludes and summarizes the key
findings while providing recommendations for future
research.
2 ELECTRONIC SYSTEM
MAINTENANCE
2.1 Context
As illustrated in Figure 1, the studied system con-
sists of several electronic subsystems that perform
different functions. Each subsystem is composed of
multiple components which can be part of several
subsystems. Different parameters of each subsystem
are monitored by collecting data at regular intervals.
These measurements are organized into control runs
that verify if each component is operating within its
nominal range and does not exceed any failure thresh-
old. If this threshold is reached, the component is con-
sidered as non-functioning and needs to be repaired.
A single threshold proves insufficient for a com-
prehensive characterization of a system’s state. In
many instances, the goal is to establish a more nu-
anced health assessment, typically manifesting as a
health indicator, health state, or Remaining Useful
Life (RUL) of the system (Lei et al., 2018a). The
health indicator represents a numerical value evalu-
ating the overall condition of the system. Similarly,
the health state, while similar to the health indica-
tor, adopts a categorical form rather than a numerical
value. On the other hand, RUL estimation is directed
towards predicting the remaining lifespan of the sys-
tem. Each of these indicators offers valuable insights
crucial for informed decision-making in maintenance
practices.
2.2 Health Diagnosis
Heath indicators are either physics-based or virtual
(Hu et al., 2012). The difference between these two
types lies in the method used for their calculations.
The physical indicator can be calculated using statis-
tical methods or signal processing techniques based
on measurements related to the equipment. It is often
the root mean square of signals (Huang et al., 2017),
but it can be calculated in many other ways depend-
ing on the data processed, such as vibrations (Soualhi
et al., 2015). The virtual indicators are based on the
fusion of multiple physical health indicators or several
signals. Principal Component Analysis is the method
generally used for this type of approach, but there are
also many methods possible to determine it (Lei et al.,
2018b). For instance, it can be estimated using unsu-
pervised ML algorithms (Kurrewar et al., 2021).
Health states are often created by dividing a health
indicator into multiple states by identifying trends in
the indicator values. A simple strategy for two-state
division involves checking if the indicator exceeds an
alarm threshold. Various methods are used to deter-
mine this threshold (Lei et al., 2018b).
When degradation trends of machinery are incon-
sistent and cannot be expressed using a single model,
multi-state division is used. This division can be
achieved through various methods such as the anal-
ysis of change points in health indicators (Hu et al.,
2016) or by applying clustering algorithms (Scanlon
Discretization Strategies for Improved Health State Labeling in Multivariable Predictive Maintenance Systems
435

et al., 2013). Machine learning classifiers can also be
applied to multi-stage division (Soualhi et al., 2015).
To conclude, health states’ labeling is a crucial step
to precisely describe the behavior of the studied sys-
tem. Yet it presents several challenges in the context
of predictive maintenance.
2.3 Challenges of Data Labeling in
Predictive Maintenance
Data labeling stands as a critical phase in supervised
machine learning, where labeled data are imperative
for training models effectively. However, in the do-
main of predictive maintenance, datasets often con-
tain only binary labels indicating normal or failure
states (Jovicic et al., 2023), unfortunately, transition
states are frequently missing. These intermediate
states represent crucial transition phases and are rele-
vant in the context of predictive maintenance. How-
ever, the same level of certainty is not easily achiev-
able when it comes to identifying transitional states
between these two conditions.
The challenge in data labeling for predictive main-
tenance increases when dealing with failure events.
The quantity of failure labels in databases is often lim-
ited due to preventive maintenance strategies, where
components are replaced before actual failure occurs.
This strategy decreases the number of recorded fail-
ures, complicating the labeling process and affecting
the model’s ability to generalize effectively.
2.4 Dataset
For this study, multiple public datasets were consid-
ered to benchmark the studied method such as popu-
lar datasets: CMAPSS (Saxena et al., 2008), bearing
dataset (Lee et al., 2007), or milling dataset (Agogino
and Goebel, 2007). However, the majority does not
provide or consider failure thresholds, which is a cru-
cial element in predictive maintenance analysis in the
presented context. For this reason, the AI4I predictive
maintenance dataset (Matzka, 2020) has been chosen
due to its feature of providing failure thresholds.
Including 10,000 data points with five features, the
dataset includes a ’machine failure’ label indicating
various failure modes. Notably, three of these modes
are threshold-dependent: Heat Dissipation Failure
(HDF), Power Failure (PWF), and Overstrain Failure
(OSF). While Tool Wear Failure (TWF) and Random
Failures (RNF) are based on random occurrences.
To enhance the dataset, modifications were made
to introduce columns specifying the defined failure
thresholds. This adjustment ensures that limits are set
for individual parameters rather than combinations,
facilitating the analysis of failure states. It is impor-
tant to highlight that, despite its robust representation
of failures, the dataset does not include explicit in-
formation on transition states. This limitation under-
scores the need for the proposed method, which fo-
cuses on addressing this gap.
The following sections of this paper will exam-
ine existing methodologies and propose new strate-
gies to enhance data labeling in the context of predic-
tive maintenance, ultimately contributing to the relia-
bility and performance of predictive maintenance sys-
tems.
3 PROPOSED LABELING
TECHNIQUES
3.1 Overview of Discretization
Approaches
Discretization is a process that transforms continuous
data into discrete categories, typically finite sets of
distinct intervals. Several methods exist for this pur-
pose, they can be classified as supervised or unsuper-
vised (Garc
´
ıa et al., 2013).
Supervised methods use labeled data to guide
the process of dividing continuous features into dis-
crete categories. They generally outperform unsu-
pervised methods due to their context-specific nature
(Dougherty et al., 1995). For this reason, the most
common methods for discretization are ChiMerge
(Kerber, 1992), Minimum Description Length prin-
ciple (Rissanen, 1986), or entropy-based techniques
(Fayyad and Irani, 1993). However, they have to use
data with class information. In practical cases, man-
ual annotation of data is often used to create labeled
data before using those approaches. However, in the
case of the presented dataset (Section 2.4), labels for
discretization have not been created, so such super-
vised techniques cannot be used and unsupervised
methods are the only choice.
Unsupervised discretization methods, such as the
EW discretization method, divide the range of con-
tinuous values into a predetermined number of inter-
vals of equal width. This approach is straightforward
to implement and computationally efficient. How-
ever, it is sensitive to outliers, as extreme values can
significantly affect the width of intervals, leading to
a suboptimal representation of the data distribution
(Catlett, 1991). The EF discretization method par-
titions the data into intervals that contain approxi-
mately the same number of data points, aiming to ad-
dress the sensitivity to outliers seen in EW discretiza-
DATA 2024 - 13th International Conference on Data Science, Technology and Applications
436
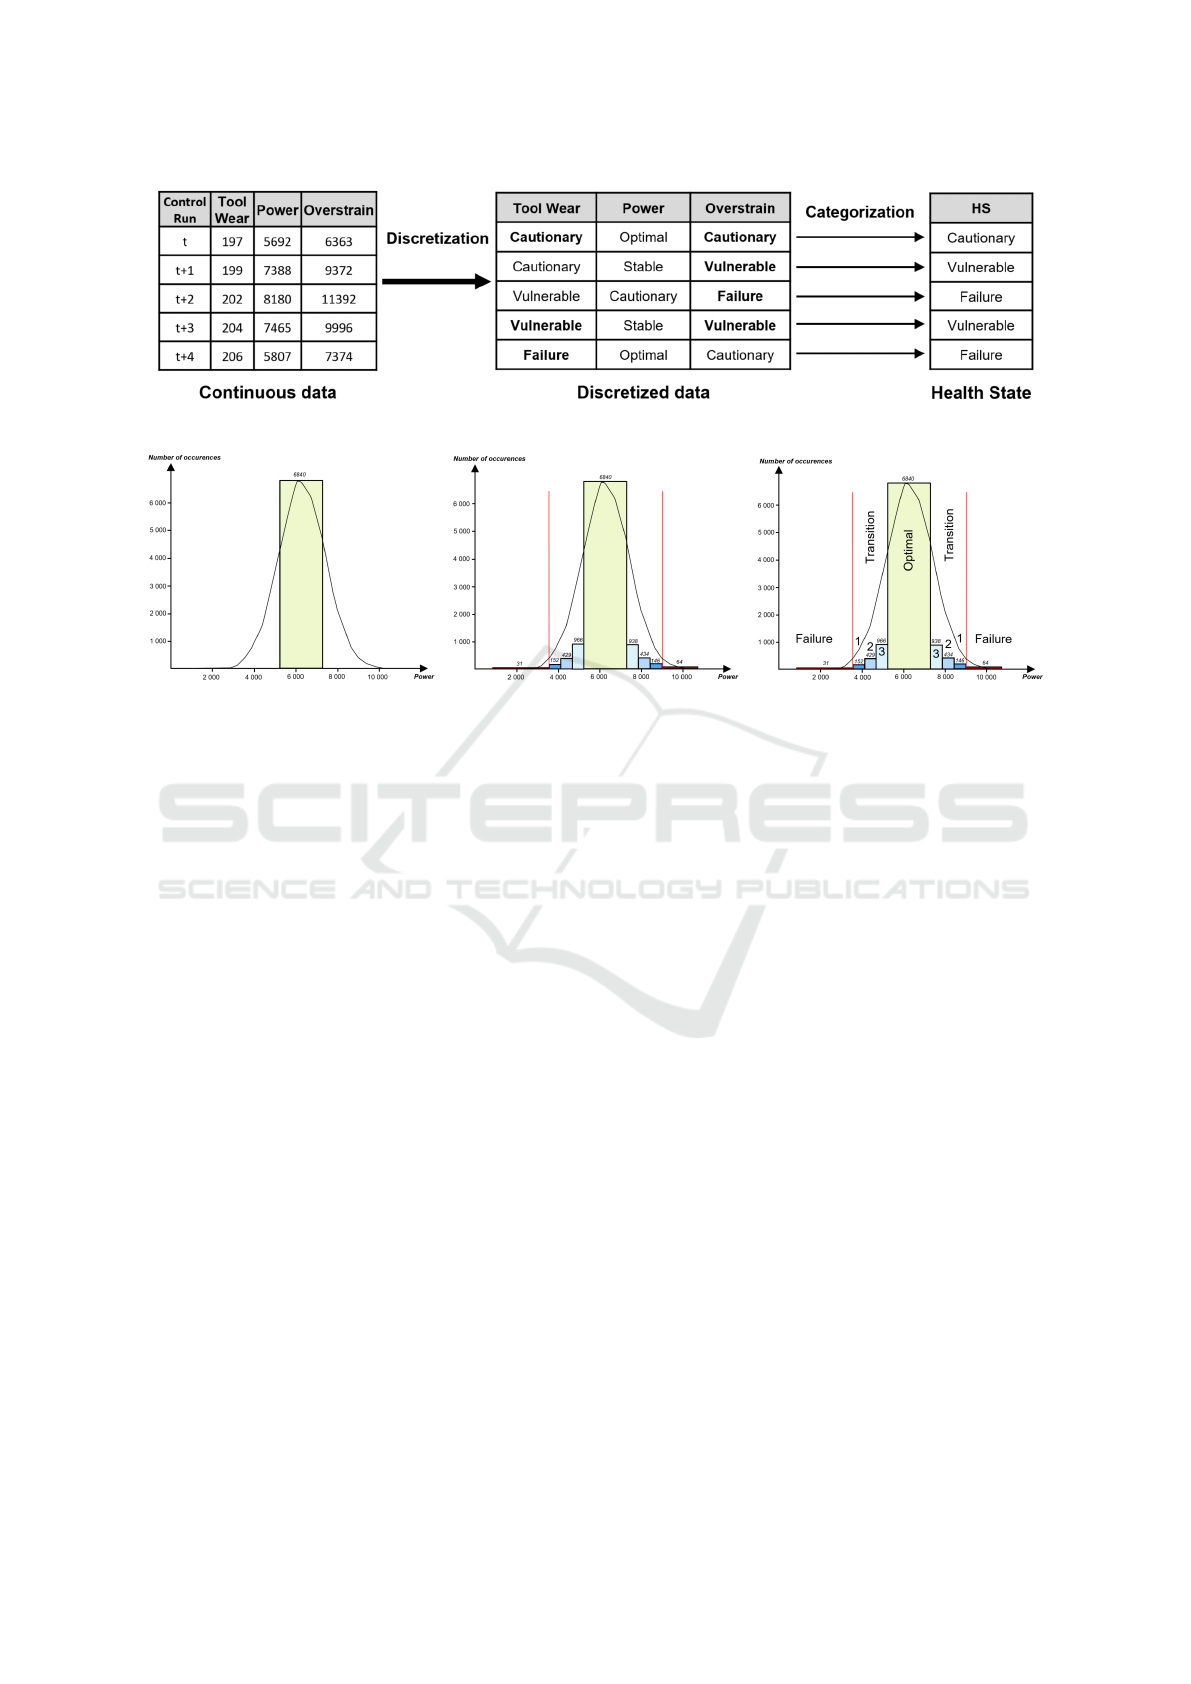
Figure 2: Labeling process by discretization.
(a) Standard deviation approach to cre-
ate the optimal state.
(b) Addition of the others categories of
health state.
(c) Labelization of the different health
states.
Figure 3: Distribution of the power parameter (1 = Vulnerable state, 2 = Cautionary state and 3 = Stable state).
tion. However, it may struggle with uneven data dis-
tributions, where certain intervals may capture sparse
or dense regions of data. This method is particularly
useful when the goal is to ensure each category has a
comparable number of instances.
Both of those approaches can be used in the con-
text of discretization, but in the following section, the
new approach is presented using discretization tech-
niques as a way of unsupervised data labeling.
3.2 Multivariable System Labeling
Through Discretization Approach
It is common for predictive maintenance databases to
lack detailed health states, often merely indicating a
binary state of failure or non-failure. The proposed
Multivariable System Labeling through Discretiza-
tion (MSLD) approach creates these health states for
a multivariable system using unsupervised discretiza-
tion of the acquired data. This method enhances
the granularity of system health assessment, enabling
more detailed predictions and effective maintenance
strategies.
The proposed method consists of two main steps:
discretization and categorization as shown in Fig-
ure 2.
In the discretization step, each measured parame-
ter from control runs is converted into discrete values
based on its distribution. A standard deviation-based
approach has been used to identify the optimal oper-
ating range for each parameter. It corresponds to the
values that fall within plus or minus one standard de-
viation from the mean value to identify outliers.
For example, in Figure 2, the power parameter
has an average value of 6279 and a standard devia-
tion of 1067. In this case, values between 5212 and
7347 are considered optimal (Figure 3a). The size of
the optimal class is arbitrary and can be adjusted by
experts based on the stability of the studied system.
Any values outside this range are considered as non-
optimal. Furthermore, two additional categories are
also created for values that exceed the failure thresh-
olds on either side, representing a failure state for the
equipment. The failure thresholds for the power pa-
rameter are 3500 and 9000. The values between the
failure threshold and the optimal state are further di-
vided into multiple intervals using the EW discretiza-
tion method. The EW method is used to have similar
size bins to reflect the actual distribution of the data.
This way, with the example of three transition states,
values between 7347 to 7898 are categorized as the
stable state, 7898 to 8449 as the cautionary state, and
8449 to 9000 as the vulnerable state. The same type
of state is applied to the other side of the Gaussian
curve (Figure 3b). The number of transition states
on each side is determined by experts depending on
the system. In the case of this article, the choice of
Discretization Strategies for Improved Health State Labeling in Multivariable Predictive Maintenance Systems
437
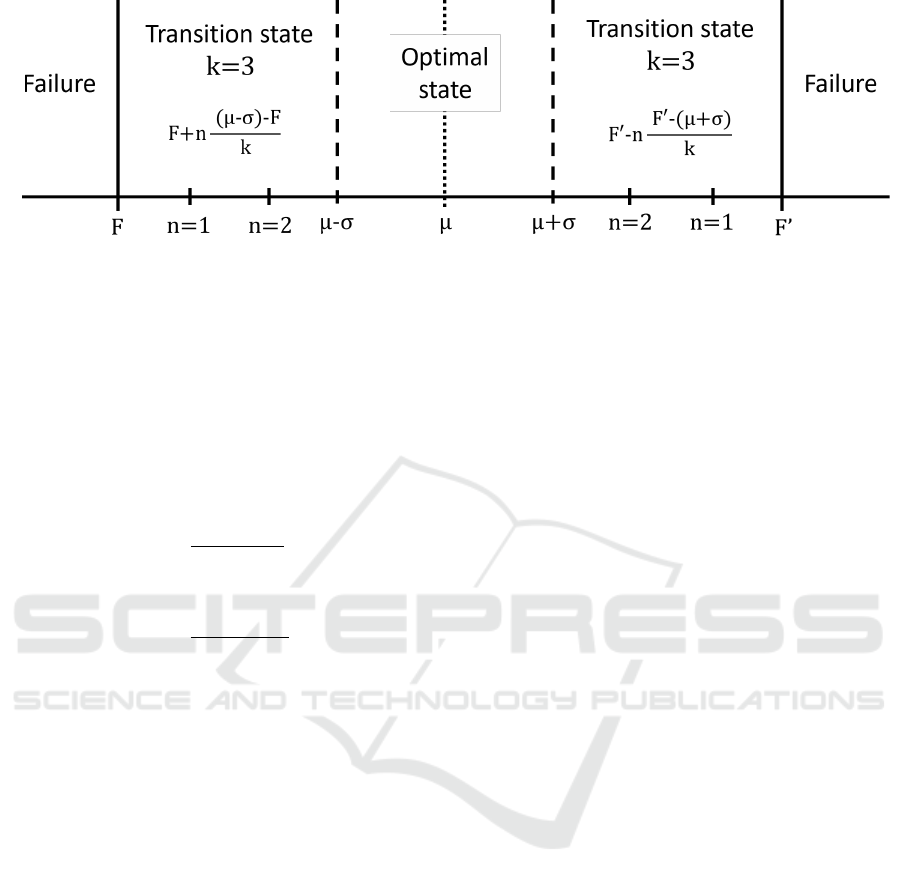
Figure 4: Labeling process by discretization.
three transition states is based on the results obtained
in Sec. 4.
Figure 4 represents the discretization step. F and
F
′
represent the failure thresholds, µ the mean value
and σ the standard deviation. The optimal state is then
defined by the values between µ−σ and µ+σ. k is the
number of transition states and n defines the limit be-
tween the different transition states with the following
formula for value inferior to the optimal:
F + n
(µ − σ) − F
k
And for value superior the optimal:
F
′
− n
F
′
− (µ + σ)
k
In the categorization step, each control run is as-
signed a specific category. This assignment is based
on the discretized values of its parameters. The cat-
egory assigned to the control run corresponds to this
most deviated parameter. This deviation is measured
in terms of how far the parameter’s value is from its
normal range. This is based on the assumption that
the health status of the system is determined by the
state of its most degraded component. In other words,
if one component of the system is in a poor state, it
significantly affects the overall health of the system,
regardless of the state of the other components.
With the example of three transition states, the fol-
lowing states can be defined as vulnerable, cautionary,
and stable. They represent different levels between
the failure and optimal state. The vulnerable state
indicates a condition closest to the failure state, sig-
nifying a potential early warning or indication of an
impending issue. The cautionary state reflects an in-
termediate condition between the failure state and an
optimal state, suggesting a moderate level of concern.
The stable state, on the other hand, is the closest to the
optimal state, indicating a state with minimal risk or
deviation from normal system operation (Figure 3c).
These states provide a nuanced understanding of the
system’s health, with transitions between them serv-
ing as key indicators for effective predictive mainte-
nance.
This approach allows for a more detailed and com-
prehensive understanding of the system’s health. Po-
tential issues can be identified early and appropriate
corrective measures can be taken, thereby enhancing
the effectiveness of the predictive maintenance strate-
gies.
4 RESULTS AND DISCUSSION
4.1 Results
After introducing the new labeling approach, this
section will discuss the results and effectiveness of
this method. The presented results of the discretiza-
tion step are for the power parameter from the AI4I
dataset, aiming to identify distinct states of the sys-
tem. This method is applied to all parameters, leading
then to categorization. Figure 3 illustrates the distri-
bution of the power parameter, categorized into differ-
ent states with the previously described approach in
Sec. 3.2. The optimal state, denoted by the green cate-
gory, encompasses 68% of the dataset, while the tran-
sition state (blue) represents 31% and failure states
(red) constitute 1%. These categories serve as cru-
cial indicators of the system’s health, with transitions
playing a pivotal role in precise predictive mainte-
nance.
Table 1 presents the distribution of the power pa-
rameter for three different discretization techniques:
EW, EF, and MSLD. Depending on the discretization
method used, the distribution can greatly vary. Be-
cause of the way EF works, there is a high number of
values in extreme bins which leads to an unbalanced
diagnosis after categorization 2. EW and MSLD are
more adapted to discretize parameters because they
do not alter the shape of the data distribution.
The effectiveness of various discretization tech-
DATA 2024 - 13th International Conference on Data Science, Technology and Applications
438
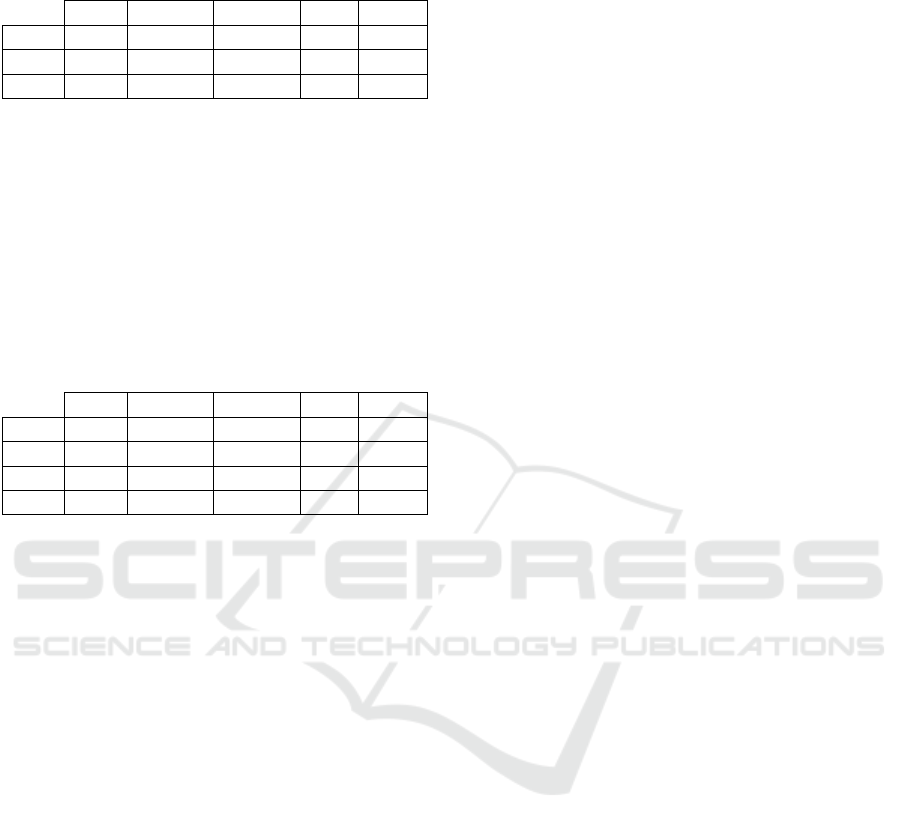
Table 1: Different distributions for the ”Power” parameter
with different discretization techniques.
Failure Vulnerable Cautionary Stable Optimal
EW 95 451 1415 3240 4799
EF 95 2453 2464 2453 2439
MSLD 95 298 863 1904 6840
niques for all parameters, when applying the same
categorization step is provided in Table 2. The out-
comes of health states after the categorization step
are heavily dependent on the discretization method.
It becomes evident that the simple EW and EF meth-
ods are suboptimal for the discretization step of the
MSLD approach. MSLD discretization step approach
provides much more details and transition states than
EW and EF methods.
Table 2: Table of the different distribution of system states
depending on the discretization technique.
Failure Vulnerable Cautionary Stable Optimal
Binary 348 0 0 0 9652
EW 348 3851 5186 615 0
EF 348 7421 1928 303 0
MSLD 348 2074 3290 3290 998
As shown in Table 2, the original binary scenario,
with only failure and non-failure states, lacks gran-
ularity. This could lead to missed opportunities for
early intervention before a system failure occurs. The
EW and EF methods provide more detailed states,
which could allow for more proactive maintenance
strategies. However, the absence of optimal states
might indicate an over-prediction of system issues,
potentially leading to unnecessary interventions. The
MSLD method seems to provide a more balanced
distribution across all states, including optimal ones.
This could offer a more nuanced understanding of
system health, allowing for targeted interventions and
efficient resource allocation.
As seen with EF and EW when obtaining the diag-
nosis from the weakest link among all parameters, the
attribution of an excessive number of values at the ex-
tremities of the binning fails to accurately depict the
actual health state of the system. The MSLD method
outperforms the others, offering a more balanced rep-
resentation of different system states with the help of
failure thresholds.
Table 3 presents the performance of different ma-
chine learning algorithms (Decision Tree (DT), Ran-
dom Forest (RF), K-Nearest Neighbours (KNN), and
XGBoost) using previous discretization methods (EF,
EW, MSLD) and the original binary states dataset.
The performance is measured by the F1 score for dif-
ferent numbers of classes.
From the table, it is evident that the performance
generally decreases as the number of classes in-
creases. This is expected as increasing the number
of classes adds complexity to the model, making it
harder to achieve high accuracy. However, the rate of
decrease varies depending on the algorithm and dis-
cretization method used.
For instance, the XGBoost algorithm maintains
relatively high performance across all numbers of
classes and discretization methods, with the F1 score
only slightly decreasing as the number of classes in-
creases. This suggests that XGBoost is robust to the
increase in class numbers and can handle the added
complexity well. On the other hand, the other three
algorithms, especially KNN, show a significant drop
in performance as the number of classes increases, in-
dicating that it may not be the best choice for this par-
ticular problem.
In terms of the discretization methods with XG-
Boost, EF, and EW perform similarly with MSLD
across all numbers of classes. But, as seen previ-
ously in Table 2, the distribution of system states from
MSLD is more balanced.
Considering the trade-off between performance
and the number of classes, choosing nine classes
seems to be a good balance. It corresponds to three
transition states on each side, two failure states, and
the optimal state. This choice provides more granu-
larity than the original binary states while still main-
taining relatively high performance across all algo-
rithms and discretization methods. Specifically, the
XGBoost algorithm with the more balanced MSLD
discretization method is a more robust performance
across different numbers of classes.
4.2 Discussion and Limitations
The proposed approach relies on an unsupervised
method, which means the role of the expert is impor-
tant in selecting the right number of transition states.
This choice is based on the results obtained with the
different configurations.
The number of transition states as well as the size
of the optimal state need to be configured correctly
depending on the dataset.
The MSLD approach presented here can be ap-
plied in a generalized manner to various databases
with failure thresholds, to determine transition states.
The presented approach provides a more granular
understanding of system transitions. By discretizing
data and accounting for transition states, the preci-
sion of health state labeling is enhanced. Although
this method may not necessarily yield superior pre-
diction performance compared to other approaches,
Discretization Strategies for Improved Health State Labeling in Multivariable Predictive Maintenance Systems
439
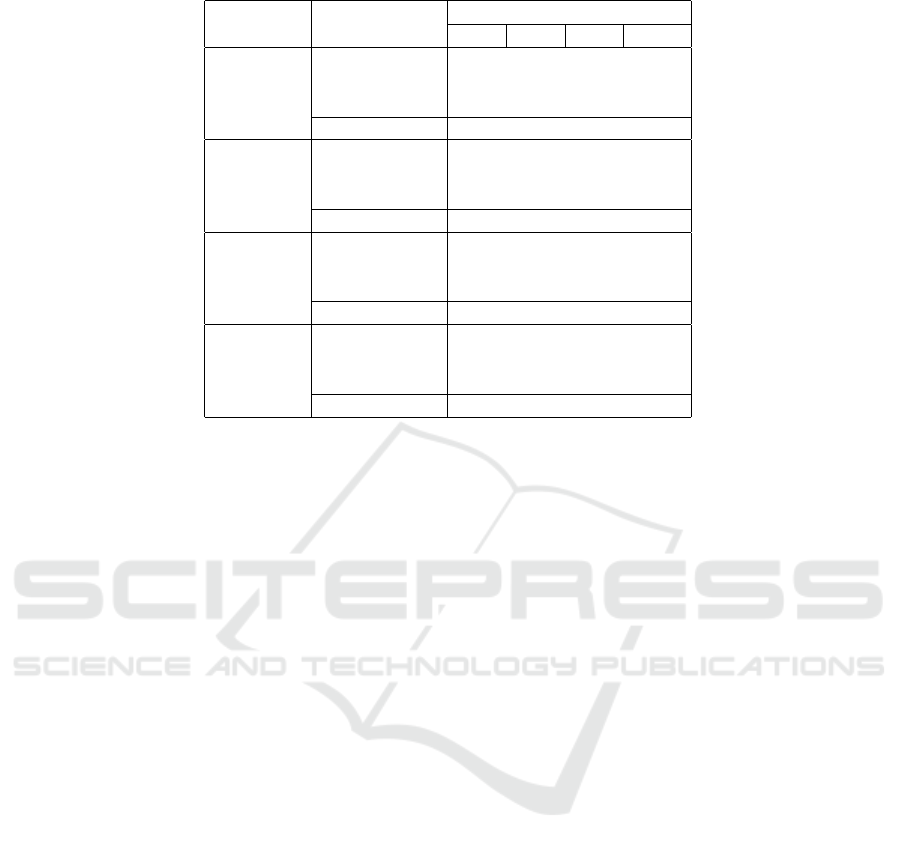
Table 3: Results with different ML algorithms, discretization methods, and number of transition classes.
Algorithm
Discretization
Method
F1Score with n classes
n=5 n=7 n=9 n=11
DT
EF 97.3 89.3 85.4 79.2
EW 97.0 92.7 77.2 75.9
MSLD 93.6 81.7 74.1 63.9
Binary 96.7
RF
EF 96.4 91.1 82.9 85.2
EW 96.7 92.0 85.5 82.7
MSLD 94.7 84.8 80.1 75.4
Binary 99.1
KNN
EF 53.6 50.2 47.2 45.4
EW 66.8 60.3 60.4 59.0
MSLD 54.1 52.6 48.9 48.1
Binary 97.3
XGBoost
EF 98.5 97.9 97.9 97.1
EW 98.2 98.3 97.4 97.5
MSLD 98.7 97.8 97.9 96.7
Binary 98.8
its strength lies in its ability to accurately classify a
wider range of health states, thereby improving de-
scriptive abilities without necessarily impacting over-
all predictive performance.
This method is limited to datasets with failure
thresholds which give context for the creation of tran-
sition states. In many cases, it restricts the use of
this method because failure thresholds are not always
present. But, if there are no failure thresholds, expert
knowledge can be used to determine them.
The discussed methods use manual tuning but
it is not always optimal nor efficient. Implement-
ing an automatic parameter optimization could en-
hance both efficiency and accuracy. Future research
will explore these techniques for their applicability in
health state labeling. This could lead to more robust
health state estimation, improving system reliability
and longevity.
5 CONCLUSION
In conclusion, the introduced methodology enhances
predictive maintenance practices by addressing the
limitations associated with binary labeling commonly
found in existing datasets. The unsupervised dis-
cretization technique, guided by data distribution and
failure thresholds, enables a nuanced classification
of multiple transitional states. It allows the experts
to rapidly decide the best discretization according to
their knowledge and experience. The research un-
derscores the versatility of the MSLD approach, em-
phasizing its applicability across diverse electronic
systems and databases. By providing a more intri-
cate understanding of a system’s health and incorpo-
rating transitional states as vital indicators, the pro-
posed method enhances anomaly detection. This con-
tribution improves decision-making in maintenance
strategies, contributing to the refinement of predictive
maintenance applications for a more accurate and in-
formed approach to system health assessment.
ACKNOWLEDGEMENTS
This work is supported by ArianeGroup SAS and the
“Agence de l’Innovation de D
´
efense” (French De-
fence Innovation Agency).
REFERENCES
Agogino, A. and Goebel, K. (2007). Milling data set.
Technical report, NASA Ames Research Cen-
ter. url https://www.nasa.gov/intelligent-systems-
division/discovery-and-systems-health/pcoe/pcoe-
data-set-repository/.
Budach, L., Feuerpfeil, M., Ihde, N., Nathansen, A., Noack,
N., Patzlaff, H., Naumann, F., and Harmouch, H.
(2022). The effects of data quality on machine learn-
ing performance. arXiv preprint arXiv:2207.14529.
Carvalho, T. P., Soares, F. A. A. M. N., Vita, R., da P. Fran-
cisco, R., Basto, J. P., and Alcal
´
a, S. G. S. (2019). A
systematic literature review of machine learning meth-
ods applied to predictive maintenance. Computers &
Industrial Engineering, 137:106024.
Catlett, J. (1991). On changing continuous attributes into
ordered discrete attributes. In Kodratoff, Y., edi-
DATA 2024 - 13th International Conference on Data Science, Technology and Applications
440

tor, Machine Learning — EWSL-91, pages 164–178,
Berlin, Heidelberg. Springer Berlin Heidelberg.
Dougherty, J., Kohavi, R., and Sahami, M. (1995). Su-
pervised and unsupervised discretization of continu-
ous features. In Prieditis, A. and Russell, S., editors,
Machine Learning Proceedings 1995, pages 194–202.
Morgan Kaufmann, San Francisco (CA).
Fayyad, U. M. and Irani, K. B. (1993). Multi-interval dis-
cretization of continuous-valued attributes for classi-
fication learning. In Ijcai, volume 93, pages 1022–
1029.
Garc
´
ıa, S., Luengo, J., S
´
aez, J. A., L
´
opez, V., and Herrera,
F. (2013). A survey of discretization techniques: Tax-
onomy and empirical analysis in supervised learning.
IEEE Transactions on Knowledge and Data Engineer-
ing, 25(4):734–750.
Hu, C., Youn, B. D., Wang, P., and Taek Yoon, J. (2012).
Ensemble of data-driven prognostic algorithms for ro-
bust prediction of remaining useful life. Reliability
Engineering & System Safety, 103:120–135.
Hu, Y., Li, H., Liao, X., Song, E., Liu, H., and Chen, Z.
(2016). A probability evaluation method of early dete-
rioration condition for the critical components of wind
turbine generator systems. Mechanical Systems and
Signal Processing, 76-77:729–741.
Huang, Z., Xu, Z., Ke, X., Wang, W., and Sun, Y. (2017).
Remaining useful life prediction for an adaptive skew-
wiener process model. Mechanical Systems and Sig-
nal Processing, 87:294–306.
Jovicic, E., Primorac, D., Cupic, M., and Jovic, A. (2023).
Publicly available datasets for predictive maintenance
in the energy sector: A review. IEEE Access,
11:73505–73520.
Kerber, R. (1992). Chimerge: discretization of numeric
attributes. In Proceedings of the Tenth National
Conference on Artificial Intelligence, AAAI’92, page
123–128. AAAI Press.
Kurrewar, H., Bekar, E. T., Skoogh, A., and Nyqvist, P.
(2021). A machine learning based health indicator
construction in implementing predictive maintenance:
A real world industrial application from manufactur-
ing. In Advances in Production Management Systems.
Artificial Intelligence for Sustainable and Resilient
Production Systems, pages 599–608, Cham. Springer
International Publishing.
Lee, J., Qiu, H., Yu, G., Lin, J., and Services,
R. T. (2007). Bearing data set. Techni-
cal report, NASA Ames Research Center.
url https://www.nasa.gov/intelligent-systems-
division/discovery-and-systems-health/pcoe/pcoe-
data-set-repository/.
Lei, Y., Li, N., Guo, L., Li, N., Yan, T., and Lin, J. (2018a).
Machinery health prognostics: A systematic review
from data acquisition to rul prediction. Mechanical
Systems and Signal Processing, 104:799–834.
Lei, Y., Li, N., Guo, L., Li, N., Yan, T., and Lin, J. (2018b).
Machinery health prognostics: A systematic review
from data acquisition to rul prediction. Mechanical
Systems and Signal Processing.
Matzka, S. (2020). Explainable artificial intelligence for
predictive maintenance applications. In 2020 Third
International Conference on Artificial Intelligence for
Industries (AI4I), pages 69–74.
Mobley, R. K. (2002). An Introduction to Predictive Main-
tenance 2nd edition. Elsevier.
Ran, Y., Zhou, X., Lin, P., Wen, Y., and Deng, R. (2019). A
survey of predictive maintenance: Systems, purposes
and approaches. ArXiv, abs/1912.07383.
Rissanen, J. (1986). Stochastic complexity and modeling.
The annals of statistics, pages 1080–1100.
Saxena, A., Goebel, K., Simon, D., and Eklund, N. (2008).
Damage propagation modeling for aircraft engine run-
to-failure simulation. In 2008 International Confer-
ence on Prognostics and Health Management, pages
1–9.
Scanlon, P., Kavanagh, D. F., and Boland, F. M. (2013).
Residual life prediction of rotating machines using
acoustic noise signals. IEEE Transactions on Instru-
mentation and Measurement, 62(1):95–108.
Soualhi, A., Medjaher, K., and Zerhouni, N. (2015). Bear-
ing health monitoring based on hilbert–huang trans-
form, support vector machine, and regression. IEEE
Transactions on Instrumentation and Measurement,
64(1):52–62.
Tan, C. M. and Raghavan, N. (2010). Imperfect predictive
maintenance model for multi-state systems with mul-
tiple failure modes and element failure dependency.
In 2010 Prognostics and System Health Management
Conference, pages 1–12.
Discretization Strategies for Improved Health State Labeling in Multivariable Predictive Maintenance Systems
441
