
Failure Prediction Using Multimodal Classification of PCB Images
Pedro M. Goncalves
1,2 a
, Miguel A. Brito
2b
and Jose Guilherme Cruz Moreira
1c
1
Bosch Car Multimedia Portugal S.A, Braga, Portugal
2
Centro Algoritmi, University of Minho, Braga, Portugal
Keywords: Machine Learning, Deep Learning, Failure Prediction, PCB, Industry 4.0, Multimodal Classification.
Abstract: In the era of Industry 4.0, where digital technologies revolutionize manufacturing, a wealth of data drive
optimization efforts. Despite the opportunities, managing these vast datasets poses significant challenges.
Printed Circuit Boards (PCBs) are pivotal in modern industry, yet their complex manufacturing process
demands robust fault detection mechanisms to ensure quality and safety. Traditional classification models
have limitations, exacerbated by imbalanced datasets and the sheer volume of data. Addressing these
challenges, our research pioneers a multimodal classification approach, integrating PCB images and
structured data to enhance fault prediction. Leveraging diverse data modalities, our methodology promises
superior accuracy with reduced data requirements. Crucially, this work is conducted in collaboration with
Bosch Car Multimedia, ensuring its relevance to industry needs. Our goals encompass crafting sophisticated
models, curbing production costs, and establishing efficient data pipelines for real-time processing. This
research marks a pivotal step towards efficient fault prediction in PCB manufacturing within the Industry 4.0
framework.
1 INTRODUCTION
In the era of Industry 4.0, integrating digital
technologies into manufacturing processes generates
vast data volumes, optimizing production (Kullu &
Cinar, 2022). This shift offers unprecedented
opportunities but also poses challenges in managing
and extracting insights from extensive datasets. The
manufacturing industry leverages data-driven
approaches to enhance efficiency, quality, and
operational performance.
Printed Circuit Boards are vital in the modern
industrial landscape. The complex manufacturing
process of PCBs requires swift fault detection to
avoid significant economic and safety consequences,
particularly in the automotive sector. Robust fault
detection mechanisms are essential to safeguard
financial interests and end-user safety.
Traditional fault detection in PCB production
relied on conventional classification models, which
have shown limitations and lack widespread
implementation due to their immaturity. This gap
a
https://orcid.org/0009-0004-5918-4999
b
https://orcid.org/0000-0003-4235-9700
c
https://orcid.org/0000-0001-6139-0071
highlights the need for efficient, reliable, and scalable
fault prediction solutions.
Imbalanced datasets in PCB production, where
specific fault classes are underrepresented, are
addressed with techniques like oversampling and
undersampling. Despite these efforts, results have not
met desired satisfaction levels.
Another challenge is the enormous volume of data
generated by manufacturing machines in Industry 4.0,
posing logistical and computational processing
difficulties.
This research proposes a multimodal
classification approach that leverages both PCB
images and structured data to address existing gaps.
This methodology combines rich visual information
from PCB images with structured data, providing a
comprehensive understanding of the manufacturing
process. Conducted in collaboration with Bosch Car
Multimedia as part of their "Quality for
Manufacturing" projects, this study ensures relevance
to contemporary challenges in electronic component
manufacturing.
442
Goncalves, P., Brito, M. and Moreira, J.
Failure Prediction Using Multimodal Classification of PCB Images.
DOI: 10.5220/0012791400003756
Paper published under CC license (CC BY-NC-ND 4.0)
In Proceedings of the 13th International Conference on Data Science, Technology and Applications (DATA 2024), pages 442-449
ISBN: 978-989-758-707-8; ISSN: 2184-285X
Proceedings Copyright © 2024 by SCITEPRESS – Science and Technology Publications, Lda.

2 GOALS
This paper aims to develop and implement a
sophisticated multimodal classification model for
integration into Bosch Car Multimedia's production
lines. The model aims to reduce production costs by
preventing the use of faulty Printed Circuit Boards
(PCBs), thereby avoiding resource wastage. Using
innovative multimodal image analysis, we seek to
enhance fault detection precision and effectiveness,
mitigating financial losses from defective component
assembly. Our research includes a comprehensive
comparative analysis between our multimodal
models, which combine structured data and images,
and traditional classification models using only
tabular data. By examining these approaches, we aim
to validate the multimodal model's effectiveness and
improve fault prediction accuracy.
Additionally, our approach aims to address the
challenge of data imbalance, striving to achieve
enhanced efficacy with reduced data volume. This
involves employing specialized preprocessing
techniques and statistical modeling to rectify data
imbalances, all with the aim of enhancing the overall
predictive capabilities of our models. This dual
emphasis on mitigating data imbalances and
achieving superior outcomes with reduced data
volumes underscores our commitment to efficiency
and efficacy in this research endeavor.
Furthermore, a critical aspect of our research
initiative involves establishing a robust and efficient
data pipeline that seamlessly integrates both PCB
images and structured data. Our objective is to
develop a real-time data processing framework
capable of supporting the multimodal classification
model during deployment. This pipeline plays a
pivotal role in ensuring the sustained adaptability and
relevance of our model amidst the dynamic industrial
environment.
3 RELATED WORK
In the rapidly evolving landscape of Industry 4.0,
ensuring PCB quality remains crucial. Literature
highlights significant advancements in PCB fault
detection. Key contributions from various studies
emphasize traditional image processing and modern
deep learning models, particularly convolutional
neural networks (CNNs). A recurring theme is the
need for extensive datasets, with future directions
focusing on augmenting datasets and improving
detection of smaller components.
(Zakaria et al., 2020) explore defects during the
solder paste printing process, introducing Solder
Paste Inspection (SPI) and Automatic Optical
Inspection (AOI) as essential tools. They delve into
machine learning approaches to enhance detection
efficiency, aiming to improve production yields and
reduce rework costs.
(Cho et al., 2023) present a predictive framework
for semiconductor memory module tests, addressing
imbalanced outcomes through multimodal fusion of
tabular and image data. This framework optimizes
testing strategies, demonstrating its real-world
efficacy and reflecting the broader trend of leveraging
advanced technologies to boost productivity in
semiconductor manufacturing.
In multimodal machine learning, diverse data
sources are used to improve model performance and
diagnostic accuracy. (Huang et al., 2020) advance
pulmonary embolism (PE) diagnosis by integrating
CT imaging with electronic health record (EHR) data,
demonstrating the superiority of a late fusion model
over imaging-only or EHR-only models.
Similarly, (Tang et al., 2022) enhance pulmonary
nodule classification by combining structured and
unstructured data. Their models outperform those
using only unstructured data, highlighting the
importance of integrating patient demographics and
clinical characteristics with medical images for more
accurate diagnoses.
(Yang et al., 2022) provide an overview of
multimodal learning, discussing methods like early
fusion, late fusion, and hybrid fusion. They address
challenges in fusing multimodal features efficiently
and explore model-based fusion methods such as
multiple kernel learning (MKL) and neural networks
(NN) to enhance feature representation.
(Yan et al., 2021) focus on breast cancer
classification using multimodal data. They propose
integrating pathological images with Electronic
Medical Records (EMR), emphasizing the benefits of
denoising autoencoders over dimensionality
reduction. Their feature-level fusion method achieves
higher accuracy by combining images and structured
data, surpassing models using only structured data or
images.
3.1 A Comprehensive Analysis of the
Production Line
To gain a comprehensive understanding of the
production line dynamics, a detailed overview of its
constituent processes is essential, with a specific
focus on the initial three stages (Zakaria et al., 2020).
This targeted approach facilitates early detection of
Failure Prediction Using Multimodal Classification of PCB Images
443

potential issues in Printed Circuit Boards (PCBs)
production.
The initial stages under scrutiny include Laser
Marking PCB, Solder Paste Printing, and Solder Paste
Inspection, each playing a crucial role in ensuring the
quality and functionality of the final product. By
concentrating efforts on these foundational steps, a
proactive approach is adopted to swiftly identify and
rectify any anomalies in the PCB manufacturing
process.
The journey of PCB assembly begins with the
insertion of a "blank" PCB into the initial machine,
devoid of any unique identifiers or data.
Subsequently, the Laser Marking PCB Process takes
precedence in the manufacturing sequence.
The Laser Marking PCB process holds significant
importance across all production plants, focusing on
traceability for utilized parts and materials in Bosch
products. Its objective is to standardize PCB and
panel processing within the Surface Mount
Technology area, assigning unique identifiers
generated by the Manufacturing Execution System to
both panels and their corresponding individual PCBs.
Upon completion of the Laser Marking PCB
process, the PCB proceeds to the Solder Paste
Printing machine. This machine applies solder paste
to the PCBs, with the quality of this application
significantly impacting overall PCB performance.
The Solder Paste Printing process involves stringent
measures to ensure precise application of solder paste
to the PCBs in line, directly influencing the usability
of the final product.
Following Solder Paste Printing, the Printed
Circuit Board undergoes Solder Paste Inspection to
verify and ensure the quality of the solder paste
application. This process serves as a critical
checkpoint to detect defects or irregularities in the
solder paste before advancing to subsequent
manufacturing phases.
The primary objective of Solder Paste Inspection
is to evaluate the accuracy and uniformity of solder
paste deposition on the PCB surface, crucial for
preventing defects such as solder bridges or
insufficient solder. Advanced optical systems and
specialized inspection equipment scan and analyze
the solder paste, facilitating precise examination of
volume, alignment, and distribution across the PCB.
In addition to these processes, efficient
management and storage of data generated during
Laser Marking PCB, Solder Paste Printing, and
Solder Paste Inspection are imperative. Tabular data
from these stages is organized into different tables
and stored in the Hadoop cluster through a pre-
established pipeline, ensuring systematic and
accessible data for future analyses.
A schematic representation provides a visual
depiction of a segment of the production line, serving
as a foundational reference for further discussion on
the intricacies of Laser Marking PCB, Solder Paste
Printing, and Solder Paste Inspection processes.
Figure 1: Production Line First Three Processes.
4 DATA UNDERSTADING
This phase is pivotal in laying the groundwork for
building a multimodal classification model for fault
prediction in PCBs. This section involves a thorough
exploration and analysis of the dataset, including both
structured data and images of PCBs
4.1 Laser Marking PCB
The LMP process is essential to the workflow but
does not alter the components of the printed circuit
board (PCB). It involves scanning the QR code on the
PCB and logging the information into the system.
Most data generated by the LMP process relates to
system metadata rather than the PCB's intrinsic
attributes. PCB-specific characteristics are usually
captured in the SPP or SPI datasets, which detail the
manufacturing and inspection processes.
A key data point is the 'panelmatId' column,
indicating the PCB supplier. Extracting the
'supplierId' from the panelMatId field requires
preprocessing. The panelMatId includes the supplier
number and extraneous details, following a format
like '123456SB32321', where digits before 'SB'
denote the supplier number. For supplier analysis, the
panelMatId data structure was deconstructed, and a
new column was created to isolate the supplier
number.
Due to security, supplier values will not be
disclosed, but a broader analysis of the attribute will
be conducted to understand its characteristics and
implications.
Table 1: LMP Data Distribution.
Attribute Coun
t
N
ull Distinc
t
supplierId 10838198 0 1018
(<1%)
DATA 2024 - 13th International Conference on Data Science, Technology and Applications
444
4.2 Solder Past Printing
The SPP process contrasts with the LMP process by
significantly transforming the printed circuit board
(PCB). While the LMP process involves no
alterations to PCB components, SPP introduces
changes through various parameters and structured
data collected from machines. Operators play a key
role in SPP by selecting these parameters, influencing
the manufacturing outcome. Unlike LMP, which
captures mainly system-related metadata, SPP
records crucial characteristics intrinsic to the PCB.
During the denormalization process, new
variables 'year', 'month', and 'day' were derived from
'eventCreatedAt' to enhance data access speed by
partitioning data storage. The resulting DataFrame
contains 2,048,448 records and 70 fields/columns.
Due to the large size of the dataset, only the most
relevant features indicated by operators and domain
knowledge are discussed in this section.
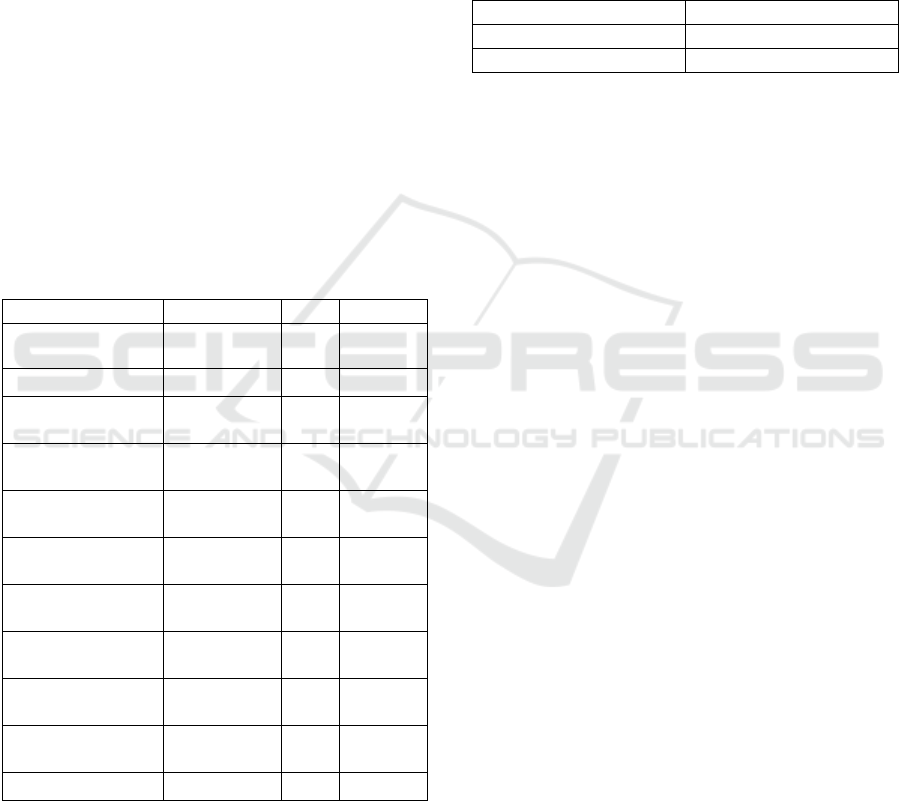
Table 2: SPP Data Distribution.
Attribute Coun
t
N
ull Distinc
t
sppPro
g
1Name 2048488 0 13 (<1%)
sppMaxFiducial
Mark
Deviation
2048488 0 80(<1%)
sppPrintingPres
sureF
orwards and
sppPrintingPres
sureB
ackwards
2048488 0 14(<1%)
sppPrintingSpe
edFor
wards and
sppPrintingSpe
edBac
kwards
2048448 0 6
(<1%)
sppPrintingDist
ance
2048448 0 9
(<1%)
sppSeparationS
p
ee
d
2048448 0 6
(<1%)
sppSnapOff 2048448 0 8 (<1%)
spptemperature 163398 1885050 62 (<1%)
spphumidity 163398 1885050 184 (<1%)
sppCleaningInte
rval
2048448 0 7
(<1%)
sppNumOfPan
elsSinc
eLastCleanin
g
2048448 0 16
(<1%)
sppToolId 2048448 0 149
(<1%)
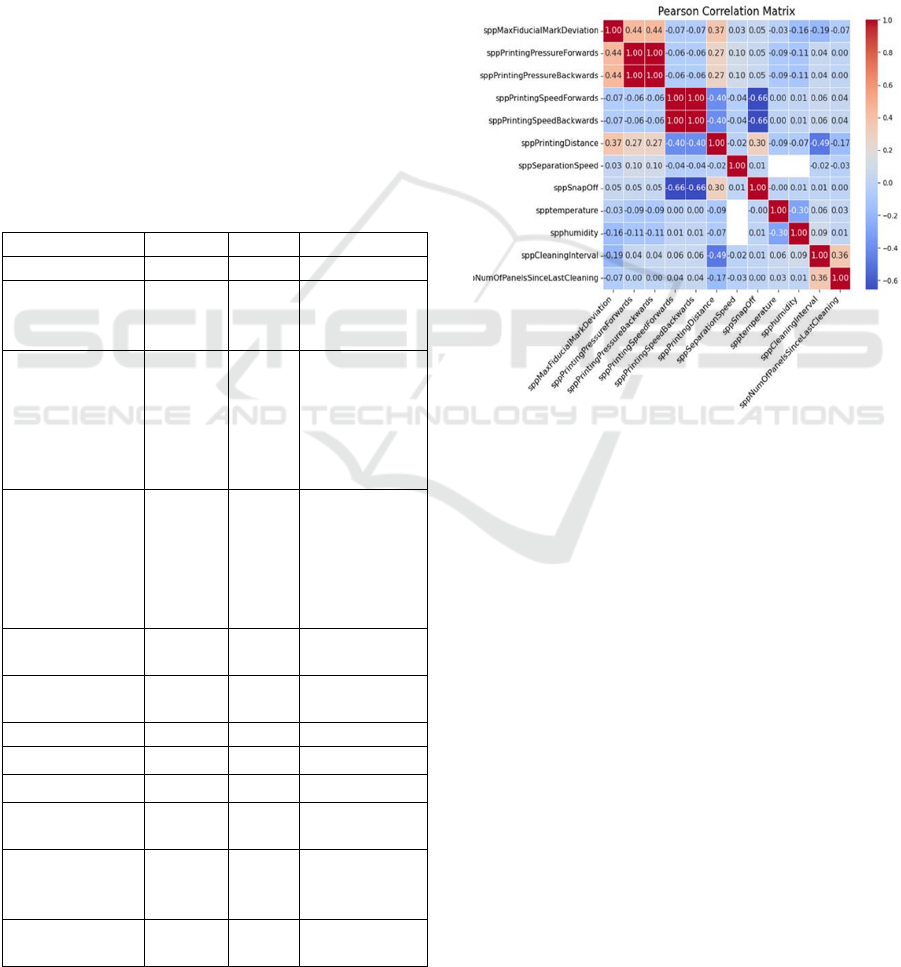
To explore the interrelationships between variables, a
correlation matrix analysis using the Pearson
correlation coefficient was conducted. This
coefficient, ranging from -1 to 1, measures the linear
relationship between two continuous variables.
Values close to 1 indicate a strong positive
correlation, values near -1 indicate a strong negative
correlation, and values around 0 suggest no linear
correlation. The correlation matrix provided insights
into variable dependencies, enhancing understanding
of their interactions and potential predictive
capabilities.
Figure 2: SPP Features Correlation.
The correlation matrix analysis revealed significant
correlations between attributes such as
sppPrintingPressureForwards and
sppPrintingPressureBackwards, and
sppPrintingSpeedForwards and
sppPrintingSpeedBackwards, likely due to consistent
operator settings. Most variables, however, showed
minimal correlation, indicating independent
behavior. Notably, sppCleaningInterval had a
moderate correlation with sppPrintingDistance, but
their distinct functions suggest no direct causal
relationship.
4.3 Solder Past Inspection
The SPI generates significantly more data than SPP
by capturing information at both the board and pad
levels. This comprehensive dataset provides valuable
insights into soldering quality, necessitating careful
preprocessing for meaningful analysis. The SPI
dataset contains 2,988,850,335 entries due to the
Failure Prediction Using Multimodal Classification of PCB Images
445
expansion of arrays for boards and pads, which
dramatically increases data volume and requires
substantial computational resources.
The dataset's vast size constrains analysis,
requiring significant processing power and time, and
posing challenges in storage, speed, and
computational complexity. Strategic sampling
approaches are necessary to make analysis feasible
while leveraging the SPI data's rich insights.
Images critical for quality assessment are
meticulously stored locally, with data utilization
focused on images identified by SPI as defective
PCBs. These images undergo manual operator review
to validate SPI findings, adding a verification layer to
the analysis pipeline.
The SPI system captures a broader array of data
than SPP, with key attributes derived from previous
analyses and domain knowledge. These attributes are
essential for understanding and optimizing the
soldering process, as summarized in the following
table, reflecting their significance for informed
decision-making and process improvement.
Table 3: SPI Data Distribution.
Attribute Coun
t
N
ull Distinc
t
spiMessageTrigge
r
2988850335
0 2 (<1%)
spiProg1Name 2988850335 0 12(<1%)
spiProposedPanel
Result
2988850335
0 3
(<1%)
spiFinalPanelResu
lt
2988850335
0 4
(<1%)
spiProposedBoar
d
Result
2988850335
0 2
(<1%)
spiFinalBoardRes
ult
2988850335
0 3
(<1%)
spiBadMarkedBoa
rd
2988850335
0 2
(<1%)
spiFailureDescrip
t
ion
2988850335
0 11
(<1%)
spiProposedPadRe
sult
2988850335
0 4
(<1%)
spiFinalPadResult
2988850335 0 5
(<1%)
spiPadType
2988850335 0 3 (<1%)
The label, derived from the final stage of
production, represents the ultimate outcome for each
PCB. It encompasses various scenarios encountered
during manufacturing. Some PCBs flagged as
defective by the SPI are deemed acceptable by
operators, allowing them to continue through
production, potentially resulting in both acceptable
and defective outcomes. Conversely, some PCBs
identified as acceptable by the SPI may have varying
final statuses upon reaching the end of the line.
Notably, no PCBs are classified as defective by both
the SPI and operators; such PCBs are scrapped and do
not receive component insertion. This label
distribution is highly imbalanced, as shown in the
following table, reflecting the diverse outcomes
observed throughout the production line.
Table 4: Label Distribution.
Label Coun
t
Goo
d
25838604
N
ot Goo
d
797141
5 MODELING
The modeling phase marks a pivotal stage in the
research, where diverse modeling techniques are
meticulously chosen and implemented, with a focus
on calibrating their parameters to attain optimal
values. This phase is characterized by the exploration
of various scenarios encompassing different
approaches, input models, preprocessing techniques,
and other pertinent variables.
Notably, four scenarios were meticulously crafted
using structured data, each tailored to specific
research objectives and hypotheses. Additionally,
two scenarios were developed to incorporate
multimodality, leveraging both images and structured
data, thus enriching the analysis and capturing
nuanced insights from multiple perspectives.
5.1 First Scenario
The journey begins with thorough data preprocessing,
crucial for preparing the data for classification.
Feature selection is pivotal, with relevant attributes
chosen from data obtained from previous processes
such as SPP, SPI, and LMP. These features cover
various PCB aspects, including dimensions,
materials, components, and results from electrical and
functional tests.
Normalization techniques ensure selected features
are on a comparable scale, facilitating the learning
process for classification algorithms. Additionally,
categorical features are encoded into numerical
values for efficient processing.
The classifier is then trained using various
machine learning algorithms, chosen based on data
type, problem complexity, and interpretability needs.
K-fold cross-validation evaluates algorithm
DATA 2024 - 13th International Conference on Data Science, Technology and Applications
446
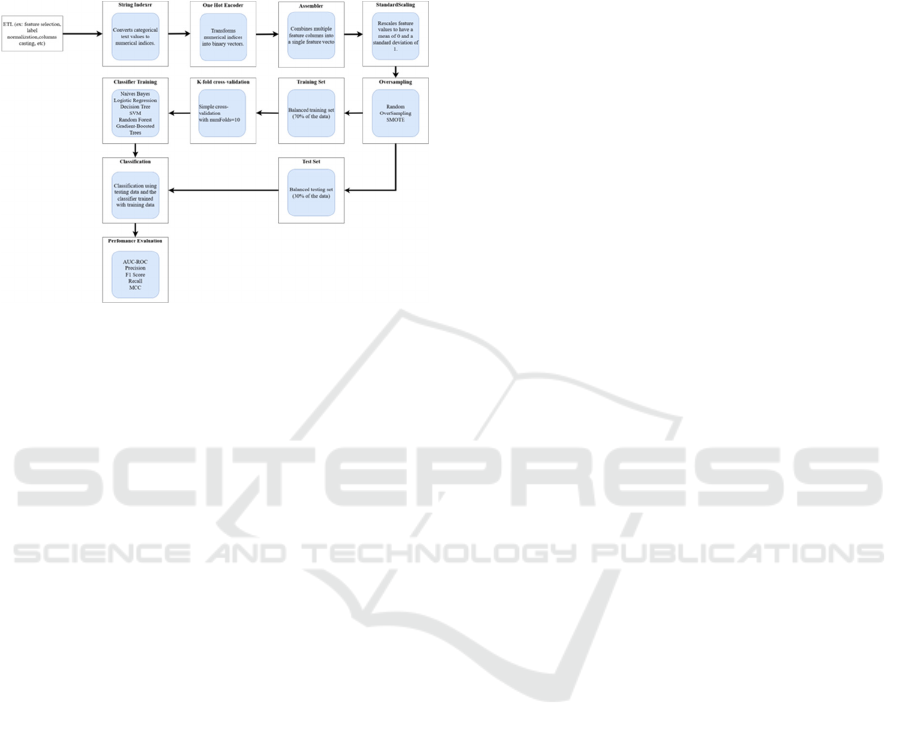
performance and prevents overfitting, ensuring
robustness and generalization to unseen data. To
address data imbalance in PCB classification,
oversampling techniques increase the representation
of faulty PCBs in the training dataset, enhancing the
algorithm's accuracy in classifying such instances.
Figure 3: First Scenario Example Pipeline.
5.2 Second Scenario
In the second scenario, the process closely resembles
the first one, with a focus on accurate data
preprocessing and effective feature selection derived
from previous processes such as SPP, SPI, and LMP,
as outlined in the paper. These features are curated
based on domain expertise and insights from earlier
research stages. Normalization techniques ensure the
comparability of selected features across the dataset,
enabling classification algorithms to effectively learn
from the data.
However, instead of employing oversampling
techniques to address data imbalance, undersampling
techniques are utilized in this scenario.
Undersampling involves reducing the size of the
majority class samples to match the minority class
samples, achieving a more balanced dataset. This
approach aims to mitigate the impact of data
imbalance on classification performance and enhance
the model's ability to accurately classify both good
and faulty PCBs, especially in scenarios where the
occurrence of faulty PCBs is rare.
5.3 Third Scenario
In the fourth scenario, a refined approach was taken,
involving data filtration based on program and
supplier specifications. By segmenting the dataset
according to unique program-supplier pairs, several
advantages were realized.
Firstly, this segmentation resulted in a significant
reduction in data volume, streamlining computational
requirements and allowing for more efficient resource
allocation. Additionally, the focused dataset
facilitated the exploration of a wider range of
modeling techniques, including the incorporation of
XGBoost models, known for their effectiveness with
structured data. Moreover, the targeted segmentation
helped mitigate imbalance within the dataset,
ensuring more equitable class representation and
improving classification accuracy. By prioritizing
critical program-supplier combinations, resources
could be directed towards areas with the greatest
impact on operational performance and PCB quality.
5.4 Fourth Scenario (Multimodal)
In the sixth scenario, we employed a multimodal
approach, incorporating both structured data and
images to enhance our classification process. To
streamline processing, we worked with a one-month
data sample, minimizing computational demands
while capturing the dataset's essence.
We used an early fusion technique, integrating
information from both structured data and images at
the input level. This allowed us to combine features
extracted from structured data with those derived
from images before feeding them into the
classification model.
To execute early fusion, we began by
preprocessing both types of data to extract relevant
features and ensure compatibility. We extracted
features from structured data, selecting or engineering
them to represent key PCB characteristics.
Concurrently, we used convolutional neural networks
(CNNs) to extract features from images, capturing
visual patterns and information.
Next, we concatenated the features from
structured data and images into a single feature vector.
This combined feature vector, representing the fused
input data, incorporates information from both
modalities. We then trained a classification model
using this fused feature vector, employing common
machine learning algorithms or neural network
architectures.
5.5 Fifth Scenario (Multimodal)
In the sixth scenario, we adopted a multimodal
strategy by combining structured data and images to
enhance our classification process. To manage
computational resources, we worked with a one-
month sample of data, ensuring manageable
Failure Prediction Using Multimodal Classification of PCB Images
447
processing demands while capturing the dataset's
essence.
Unlike the early fusion method used previously,
in this scenario, we employed a late fusion approach.
Late fusion involves separately processing structured
data and image data through distinct pathways in the
model before merging the outputs at a later stage.
To implement late fusion, we first preprocessed
both types of data independently, extracting relevant
features and ensuring compatibility with our
classification model. Structured data underwent
feature selection or engineering to highlight pertinent
PCB characteristics, while image data underwent
feature extraction using techniques such as
convolutional neural networks (CNNs) to capture
visual patterns.
Subsequently, we fed the processed structured
data and image data through separate pathways in the
classification model. Each pathway independently
learned representations from its respective data
modality, leveraging machine learning algorithms or
neural network architectures optimized for each data
type.
Finally, the outputs from both pathways were
merged or concatenated at a later stage, creating a
combined representation of the data that captured the
complementary information from both modalities.
This fused representation was then used as input to
the final classification layer of the model.
6 RESULTS
Table 5: Model Predictions Results.
Scenario Model Precision Accurac
y
Recall
1
Gradien
t
-
Boosted
Trees
(
SMOTE
)
0.8889 0.8326 0.0070
2
Gradien
t
-
Boosted
Trees
(Random
Undersampl
in
g)
0.8614
0.8769 0.0067
3 XGBoos
t
0.87786 0.9476 0.0350
4 Earl
y
Fusion 0.9394 0.9389 0.1530
5 Late Fusion 0.9114 0.8732 0.1023
The results presented in the table stem from rigorous
exploration of various methodologies aimed at
developing robust classification models for
distinguishing between good and faulty Printed
Circuit Boards (PCBs). Each scenario represents a
unique experiment characterized by distinct
combinations of sampling techniques, machine
learning algorithms, and data fusion strategies.
It's crucial to emphasize that all experiments
underwent meticulous optimization involving an
exhaustive search for hyperparameters. This
optimization ensured that the models were finely
tuned to the dataset's characteristics and the
classification problem's specific requirements.
Evaluations were conducted in a controlled
environment provided by Bosch, leveraging GPU
clusters, particularly in scenarios involving image
processing. This environment ensured consistency
and reliability in assessing model performance.
The primary objective throughout these
experiments was to optimize precision, prioritizing
the minimization of false positives. Achieving high
precision was crucial as it ensured the classification
system exhibited a high level of certainty and
generated minimal entropy. This approach stemmed
from the understanding that misclassifying a good
PCB as faulty could be costlier than accurately
identifying multiple faulty PCBs. Therefore, the
focus was on developing models that could
confidently distinguish between good and faulty
PCBs while minimizing the risk of false positives.
The best-performing scenario is Scenario 4,
"Early Fusion," with an impressive precision of
0.9394 and an accuracy of 0.9389. While the recall
value is relatively lower at 0.1530, indicating that the
model may miss some faulty PCBs, the high precision
suggests a strong ability to correctly identify faulty
PCBs while minimizing false positives. This
precision-focused approach is vital in manufacturing,
as misclassifying a good PCB as faulty can be more
costly than correctly identifying faulty ones. The
success of Scenario 4 underscores the effectiveness of
the "Early Fusion" technique and its potential for
optimizing precision in classification tasks.
7 CONCLUSIONS
Our exploration of fault prediction scenarios in PCB
manufacturing has yielded insightful findings,
particularly in our best-performing scenario and our
approach to reducing model complexity through
structured data filtration.
In our best scenario, Early Fusion, we achieved
impressive results with a precision of 93.94%,
accuracy of 93.89%, and recall of 15.30%. This
outcome underscores the effectiveness of combining
multimodal data (images and structured data) to
enhance fault prediction accuracy. Leveraging both
DATA 2024 - 13th International Conference on Data Science, Technology and Applications
448

visual and structured information allowed us to
capture nuanced patterns and correlations, leading to
more robust predictions. This holistic approach
represents a significant step forward in fault detection
in PCB manufacturing, aligning with the principles of
Industry 4.0 and bolstering quality control efforts.
Conversely, our exploration of filtering structured
data to reduce model complexity (Scenario 4) sheds
light on the importance of targeted data preprocessing.
By filtering data based on program and supplier
characteristics, we were able to streamline the
modeling process and focus on critical subsets of data.
This approach not only mitigated the challenges
posed by imbalanced datasets but also facilitated the
utilization of advanced modeling techniques such as
XGBoost. The resulting decrease in model
complexity led to improved computational efficiency
and enhanced interpretability, essential factors in
real-world deployment scenarios.
In summary, our research underscores the
significance of adaptive modeling strategies and
targeted data preprocessing techniques in fault
prediction in PCB manufacturing. By embracing
interdisciplinary collaboration and leveraging
advanced data science methodologies, we are poised
to drive meaningful advancements in quality control
and operational efficiency within the electronics
manufacturing industry, ushering in a new era of
innovation and reliability.
ACKNOWLEDGEMENTS
This work has been supported by FCT – Fundação
para a Ciência e Tecnologia within the R&D Units
Project Scope: UIDB/00319/2020
REFERENCES
Cho, H., Koo, W., & Kim, H. (2023). Prediction of Highly
Imbalanced Semiconductor Chip-Level Defects in
Module Tests Using Multimodal Fusion and Logit
Adjustment. IEEE Transactions on Semiconductor
Manufacturing, 36(3). https://doi.org/10.1109/
TSM.2023.3283101
Huang, S. C., Pareek, A., Zamanian, R., Banerjee, I., &
Lungren, M. P. (2020). Multimodal fusion with deep
neural networks for leveraging CT imaging and
electronic health record: a case-study in pulmonary
embolism detection. Scientific Reports, 10(1). https://
doi.org/10.1038/s41598-020-78888-w
Kullu, O., & Cinar, E. (2022). A Deep-Learning-Based
Multi-Modal Sensor Fusion Approach for Detection of
Equipment Faults. Machines, 10(11). https://doi.org/
10.3390/machines10111105
Tang, N., Zhang, R., Wei, Z., Chen, X., Li, G., Song, Q.,
Yi, D., & Wu, Y. (2022). Improving the performance of
lung nodule classification by fusing structured and
unstructured data. Information Fusion, 88. https://
doi.org/10.1016/j.inffus.2022.07.019
Yan, R., Zhang, F., Rao, X., Lv, Z., Li, J., Zhang, L., Liang,
S., Li, Y., Ren, F., Zheng, C., & Liang, J. (2021). Richer
fusion network for breast cancer classification based on
multimodal data. BMC Medical Informatics and
Decision Making, 21. https://doi.org/10.1186/s12911-
020-01340-6
Yang, F., Ning, B., & Li, H. (2022). An Overview
of Multimodal Fusion Learning. Lecture Notes of the
Institute for Computer Sciences, Social-Informatics and
Telecommunications Engineering, LNICST, 451
LNICST. https://doi.org/10.1007/978-3-031-23902-
1_20
Zakaria, S. S., Amir, A., Yaakob, N., & Nazemi, S. (2020).
Automated Detection of Printed Circuit Boards (PCB)
Defects by Using Machine Learning in Electronic
Manufacturing: Current Approaches. IOP Conference
Series: Materials Science and Engineering, 767(1).
https://doi.org/10.1088/1757-899X/767/1/012064
Failure Prediction Using Multimodal Classification of PCB Images
449
