
Adapting Retail Supply Chains for the Race to Sustainable Urban
Delivery
Angie Ramirez-Villamil
1,2 a
, Anicia Jaegler
2 b
and Jairo R. Montoya-Torres
1 c
1
School of Engineering, Universidad de La Sabana, Km 7 Autopista Norte de Bogot
´
a, D.C., Ch
´
ıa, Colombia
2
Kedge Business School, 40 Avenue des Terroirs de France, 75012 Paris, France
Keywords:
Urban Logistics, Supply Chain Management, Sustainability, Two-Echelon Distribution, Cargo Bikes, Retail.
Abstract:
To deal with urban distribution challenges, companies are redesigning their distribution networks. This paper
studies a two-echelon vehicle routing problem, one of the most employed models, with a heterogeneous fleet
between echelons. Vehicles in the first echelon are mobile satellites that supply the vehicles in the second
echelon. Our study aims to minimize the travel time. To solve this complex problem when facing real-life
distribution, a heuristic solution approach is followed by decomposing the components of the problem and
applying the well-known nearest neighbor procedure. This approach is also justified by the very large amount
of delivery points, so the problem dataset can be computationally tractable. Experiments are run using real
data from a delivery company in Paris, France. Different scenarios are evaluated, and results show that the
consideration of cargo bikes has big potential to reduce some of the externalities caused by conventional
delivery systems, while some non-intuitive impacts are also found, such as the increase in land use.
1 INTRODUCTION
Internet shopping offers more shopping possibilities
to consumers, and an additional distribution chan-
nel to retailers (Kull et al., 2007). The pandemic
of COVID-19 has reinforced this trend by demand-
ing supply chain managers to rethink their operations
(Montoya-Torres et al., 2021). Supply chain manage-
ment are the core of activities that are relevant to e-
commerce to support its exponential growth. How-
ever, its complexity has considerably boost since sev-
eral operations (e.g., warehousing, inventory, pack-
aging, product shipping and tracking) have begun to
be considered (Sandhaus, 2019). In addition, de-
mand uncertainty has increased due to its accelerated
growth. Retailers and suppliers should start looking
for different initiatives to minimize stock-outs and
guarantee service levels (Bendoly et al., 2018).
On another side, urbanization is a constant trend
generating problems in freight transportation due to
the delivery of online retail orders. Their increase,
the constraints linked to urban environments and poli-
cies, and environmental pressures force practitioners
a
https://orcid.org/0000-0001-6840-3525
b
https://orcid.org/0000-0002-3014-4561
c
https://orcid.org/0000-0002-6251-3667
to rethink traditional deliveries. Indeed, urban freight
transportation has become an important component
of urban planning. For instance, carriers have been
challenged to provide higher levels of service at lower
costs to satisfy customers’ needs, such as same-day-
delivery (Stroh et al., 2022). They have made efforts
to organize their freight transport systems as they ob-
struct themself and other road users by causing con-
gestion during loading/unloading operations, with as-
sociated negative environmental impacts (air pollu-
tion and noise). In addition, current environmental
agreements, as well as low-emission urban areas, are
requiring freight carriers to reduce the CO
2
equivalent
(CO
2
e) emissions.
City logistics initiatives and strategies have been
developed and modeled to improve efficiency, re-
lieve traffic congestion, and reduce CO
2
e emissions.
One is the redesign of urban distribution networks by
adding intermediate nodes i.e., hubs, satellites, urban
logistic spaces, located in the proximity of an urban
area and allowing the consolidation of freight flows
(Meza-Peralta et al., 2020; Browne et al., 2005). To
make last-mile delivery more efficient. Hence, signif-
icant efforts have been made to design efficient op-
timization models and algorithms capable of support-
ing logistics decision makers (Ramirez-Villamil et al.,
2022; Patier and Browne, 2010).
354
Ramirez-Villamil, A., Jaegler, A. and Montoya-Torres, J.
Adapting Retail Supply Chains for the Race to Sustainable Urban Delivery.
DOI: 10.5220/0012797800003758
Paper published under CC license (CC BY-NC-ND 4.0)
In Proceedings of the 14th International Conference on Simulation and Modeling Methodologies, Technologies and Applications (SIMULTECH 2024), pages 354-362
ISBN: 978-989-758-708-5; ISSN: 2184-2841
Proceedings Copyright © 2024 by SCITEPRESS – Science and Technology Publications, Lda.

When designing the last-mile supply network, the
most employed model is the two-echelon distribu-
tion system, which consists of delivering goods from
one depot to a set of satellites and from there to a
set of customers geographically dispersed within an
urban area (Marrekchi et al., 2021). When dealing
with routing decision, this problem is modeled as a
two-echelon capacitated vehicle routing problem (2E-
CVRP) (Gonzalez-Feliu et al., 2008). It is known to
be NP-hard, which means that the time needed to find
an optimal solution grows exponentially in function
of the size of the instance. Thus, many researchers are
motivated to seek approximate algorithms (heuristics
and metaheuristics) to solve it. The importance and
attractiveness of this research topic concerns its ap-
plicability in real cases of freight transportation plan-
ning, the research opportunity in terms of the devel-
opment of efficient solution methods, the use of novel
disruptive delivery technologies, and the inclusion
of more realistic features (e.g., satellite synchroniza-
tion, use of environmentally friendly vehicles, multi-
ple depots, mobile depots, and considering very large
amount of delivery points) (Carlsson and Song, 2018;
Reed et al., 2022).
In the context of more sustainable deliveries, de-
livery by cargo bikes is booming, as a preferred so-
lution for environmentally oriented decision-makers
(Silva et al., 2023). However, they are constrained in
terms of distance. This paper focuses on the imple-
mentation of mobile urban storage via delivery vans
loading the goods in the satellites for further last-mile
delivery by cargo bikes. Delivery time was also con-
sidered as part of the total travel time, to make the
problem more realistic. To the best of our knowl-
edge, there is no literature that addresses not only a
two-echelon delivery network using mobile satellites
to transport parcels until certain points within the city
where cargo bikes are loaded to perform last-mile de-
livery; but also, that includes the delivery time as part
of the total travel time to make the problem more re-
alistic. The problem includes both the transport from
the depot to satellites (first echelon) and from these
mobile satellites to customers (second echelon). This
delivery network can contribute to the reduction of the
travel distance, and of the number of trucks in cities,
and consequently, it could decrease congestion.
This paper proposes a decomposition heuristic
based on the Nearest Neighbor procedure (NN). As
a real-life case study of a company delivering in the
city of Paris, France is considered, the rationale of
choosing a heuristic to solve the routing problem is
justified by the very large amount of delivery points.
Indeed, although research on VRP has witnessed a va-
riety of solution approaches, including exact, heuris-
tic and meta-heuristic algorithms (e.g., (Cattaruzza
et al., 2017; Vega-Mej
´
ıa et al., 2019; Soeffker et al.,
2022)), the literature has also highlighted the need of
fast yet comprehensive solution algorithms for easy
understanding in practice, instead of black-box com-
plex algorithms (Juan et al., 2015). As an objective
function, the minimization of travel times is consid-
ered. Key performance indicators like, CO
2
e and fine
particles emissions, as well as fixed cost and land use
are also addressed.
The approach is tested over different scenarios
simulating the actual options decision-makers may
encounter in real life. Hence, two scenarios for urban
freight distribution networks are proposed.
The remainder of this paper is organized as fol-
lows. Existent literature is firstly reviewed, followed
by description of the case study. The solution ap-
proach is then described, as well as the results ob-
tained. The paper ends with some conclusions, ex-
plaining some managerial implications, and suggest-
ing future research lines.
2 RELATED LITERATURE
The Internet has created opportunities for retailers to
increase sales (Nguyen et al., 2019), causing an evolu-
tion with the constant expansion of e-commerce. This
phenomenon has generated growth in online retail by
around an average of 10% each year from many years
and approximately 14% in western Europe in 2020
(Lone et al., 2021). Currently, online retailers offer a
variety of delivery options that are the result of com-
bining features such as: delivery speed, time slot, day
or overnight delivery, delivery date and delivery fee.
Over the years, there have been efforts to improve
and make online retail operations more efficient with
the aim of generating value for the customers. (Buijs
et al., 2016) illustrated the importance of leveraging
opportunities in the design and control of a retail dis-
tribution network. The results obtained with the sim-
ulation model applied in a case study in The Nether-
lands show a reduction in travel distance by more than
40% when applying their multi-echelon approach and
demonstrate how even small changes in the distribu-
tion network design can lead to significant improve-
ments in cross-docking performance.
As pointed out before, one of the most widely used
models in urban freight delivery is the 2E-VRP. The
problem has been studied since 1980 (Jacobsen and
Madsen, 1980). However, the first study was pre-
sented by (Crainic et al., 2010), who promoted the use
of satellite platforms to redistribute goods in zones
where big trucks could not circulate due to the physi-
Adapting Retail Supply Chains for the Race to Sustainable Urban Delivery
355
cal or regulatory constraints, and showed a reduction
in the use of large vehicles by up to 72%. Since then,
this VRP variant has been extensively studied. In e-
commerce, (Zhou et al., 2018) proposed a multi-depot
two-echelon vehicle routing problem with delivery
options (MD-TEVRP-DO), where customers are al-
lowed to pick-up orders at intermediate facilities. Af-
ter applying a multi-population genetic algorithm, re-
sults showed that the final cost can be reduced by 16%
(in comparison with the “no pick-up option”).
Nowadays, the use of different types of vehicles
in both first and second echelons has become more
relevant in city logistics, but system becomes more
complex. In the first echelon, trucks supply the satel-
lites, while in the second echelon, other transporta-
tion modes (e.g., cargo bikes, electric vehicles, UAVs,
vans, autonomous vehicles) perform the last-mile de-
liveries (Cattaruzza et al., 2017; Stamadianos et al.,
2023). Moreover, new variants of 2E-VRP have been
studied in sustainable applications. For example, dif-
ferent scenarios using cargo bikes for freight trans-
portation in inner-city areas have been proposed. (An-
derluh et al., 2019) present some of the successful
cases of cargo bikes in Europe for the cities Budapest,
Vienna, and Copenhagen. Other works also evaluated
the use of cargo bikes on different performance indi-
cators including cost and environmental impacts, to
analyze their use alone of as part of a mixed-fleets
with electric vehicles i.e. (Caggiani et al., 2021).
The impact of cargo bikes in system performance was
shown to be very positive. However, none of previ-
ous work in the literature evaluate an extended set of
performance indicators, as in the current paper.
3 PROBLEM DESCRIPTION
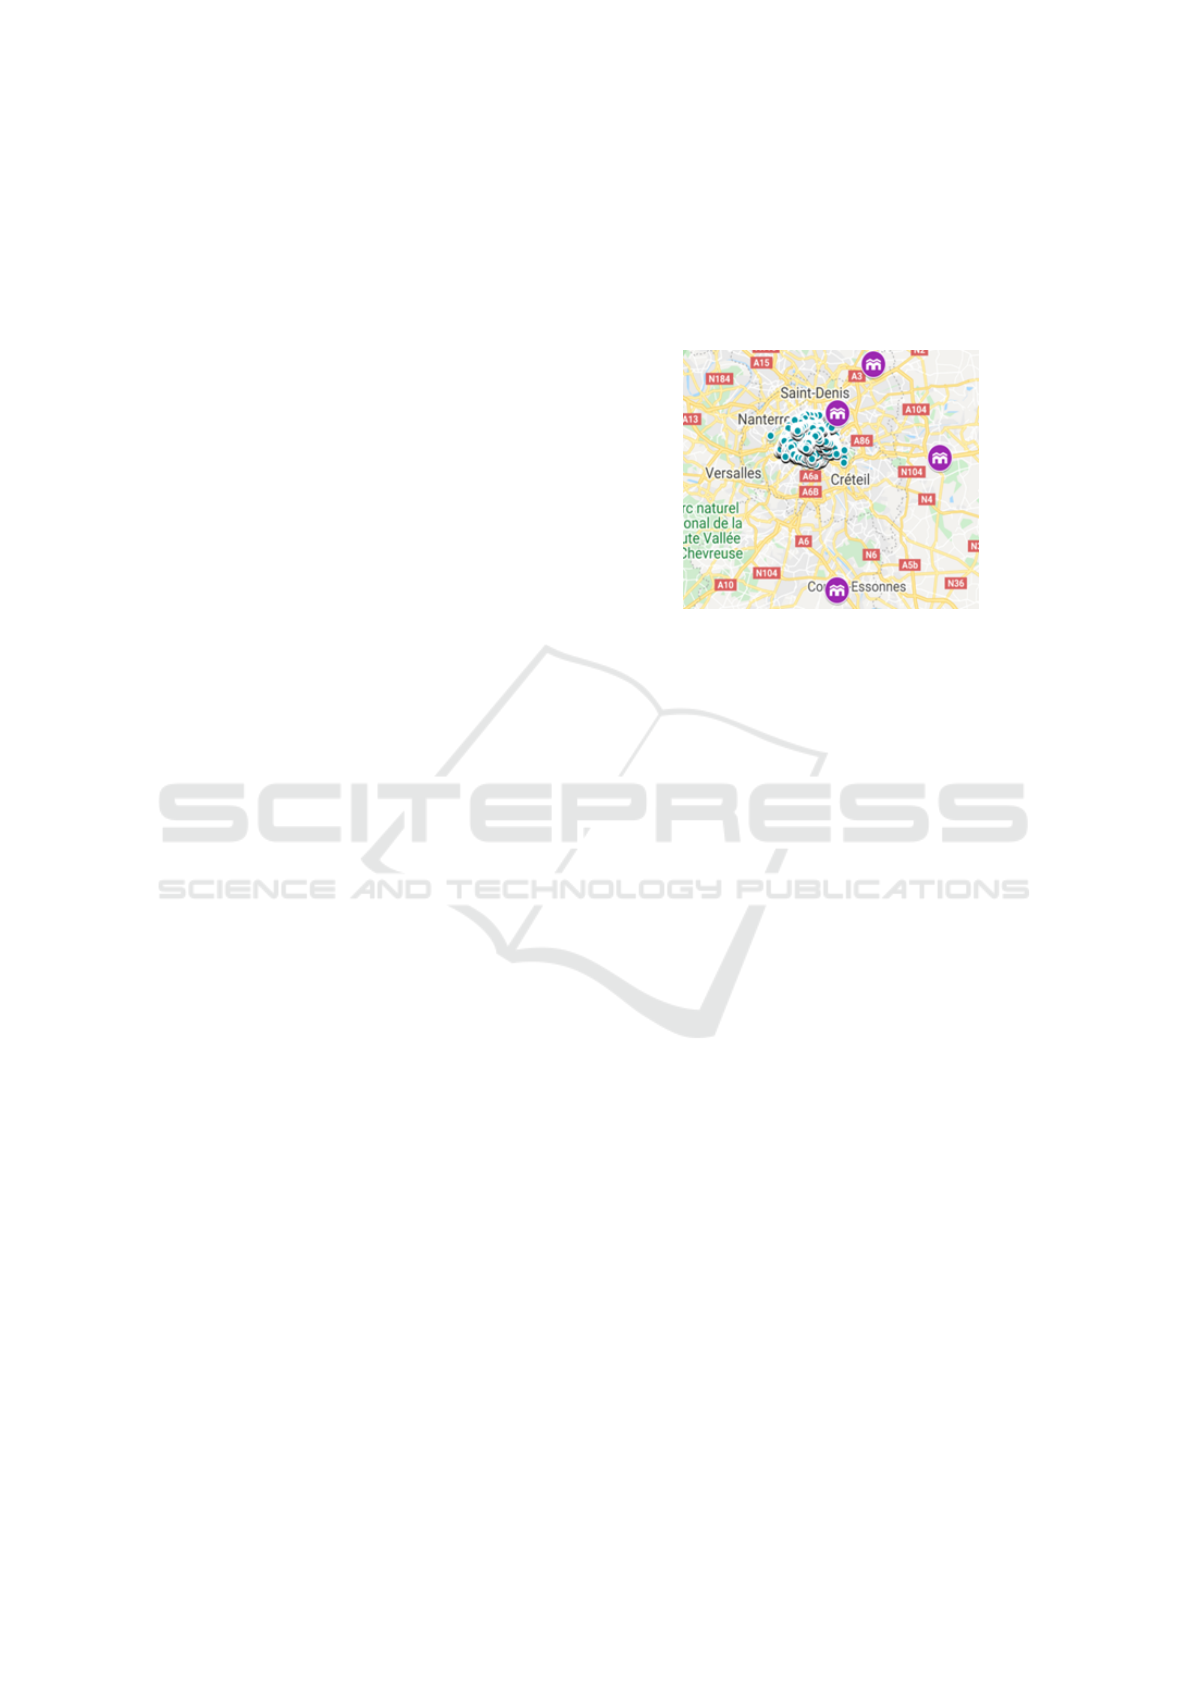
A major French delivery company for the city of Paris
is taken as case study. It is a key player of the last-mile
and a leading brand in delivery, with the distribution
of approximately 63 million parcels. 95% of deliver-
ies are made on the first attempt and 65% of parcels
are delivered directly to mailboxes. Its services are
used by major B2C clients, as well as B2B. For this
study, the company provided the data of 90,627 de-
liveries in Paris from four depots around Paris. Fig-
ure 1 presents the location of the four depots (pur-
ple points) and the location of the 90,627 customers
(green points). Furthermore, Paris is administratively
divided into 20 districts. The data provided are split
according to these districts. Actual demand and lo-
cation of points are kept confidential. Such distribu-
tion problem is modeled as a two-echelon capacitated
vehicle routing problem (2E-CVRP) (Gonzalez-Feliu
et al., 2008). This problem, in its deterministic ver-
sion, is known to be NP-hard, which means that the
time needed to find an optimal solution grows expo-
nentially in function of the number of delivery points.
The sub-problems that will be presented in the next
section depend on the scenarios presented in table 1.
Figure 1: Delivery points in Paris and four warehouses.
4 SOLUTION APPROACH
Since the 2E-CVRP is known for its hard complex-
ity (Gonzalez-Feliu et al., 2008), approximation al-
gorithms are good approaches to obtain feasible so-
lutions for medium- to large-sized instances in rea-
sonable computational time. Since the case study is a
very large-sized instance, a decomposition algorithm
(Figure 2) is proposed and the routing is solved using
the NN procedure (Taiwo et al., 2013). This algorithm
splits the problem into four sub-problems to reduce its
complexity, and aggregates the corresponding results
to guarantee the quality and feasibility of the solutions
and render it computationally tractable.
The first subproblem is the random selection of
the location point for the satellites in each district of
Paris; the second one is to randomly cluster the satel-
lites to the depots; the third sub-problem is to find a
set of routes starting from the depot to serve the cor-
responding satellites (first echelon), and the last step
is to determine the routing from satellites to serve the
clients (second echelon).
4.1 Routing from Depots to Satellites
This subsection explains in a detailed way the heuris-
tic algorithm used to solve the first three sub-
problems. The location of the satellites (first sub-
problem) depend on the scenarios presented in table 1.
So, it is important to note that the number of satellites
and how they operate will depend on the scenario.
The second sub-problem consists of a random al-
location of the previously selected satellites to the
SIMULTECH 2024 - 14th International Conference on Simulation and Modeling Methodologies, Technologies and Applications
356
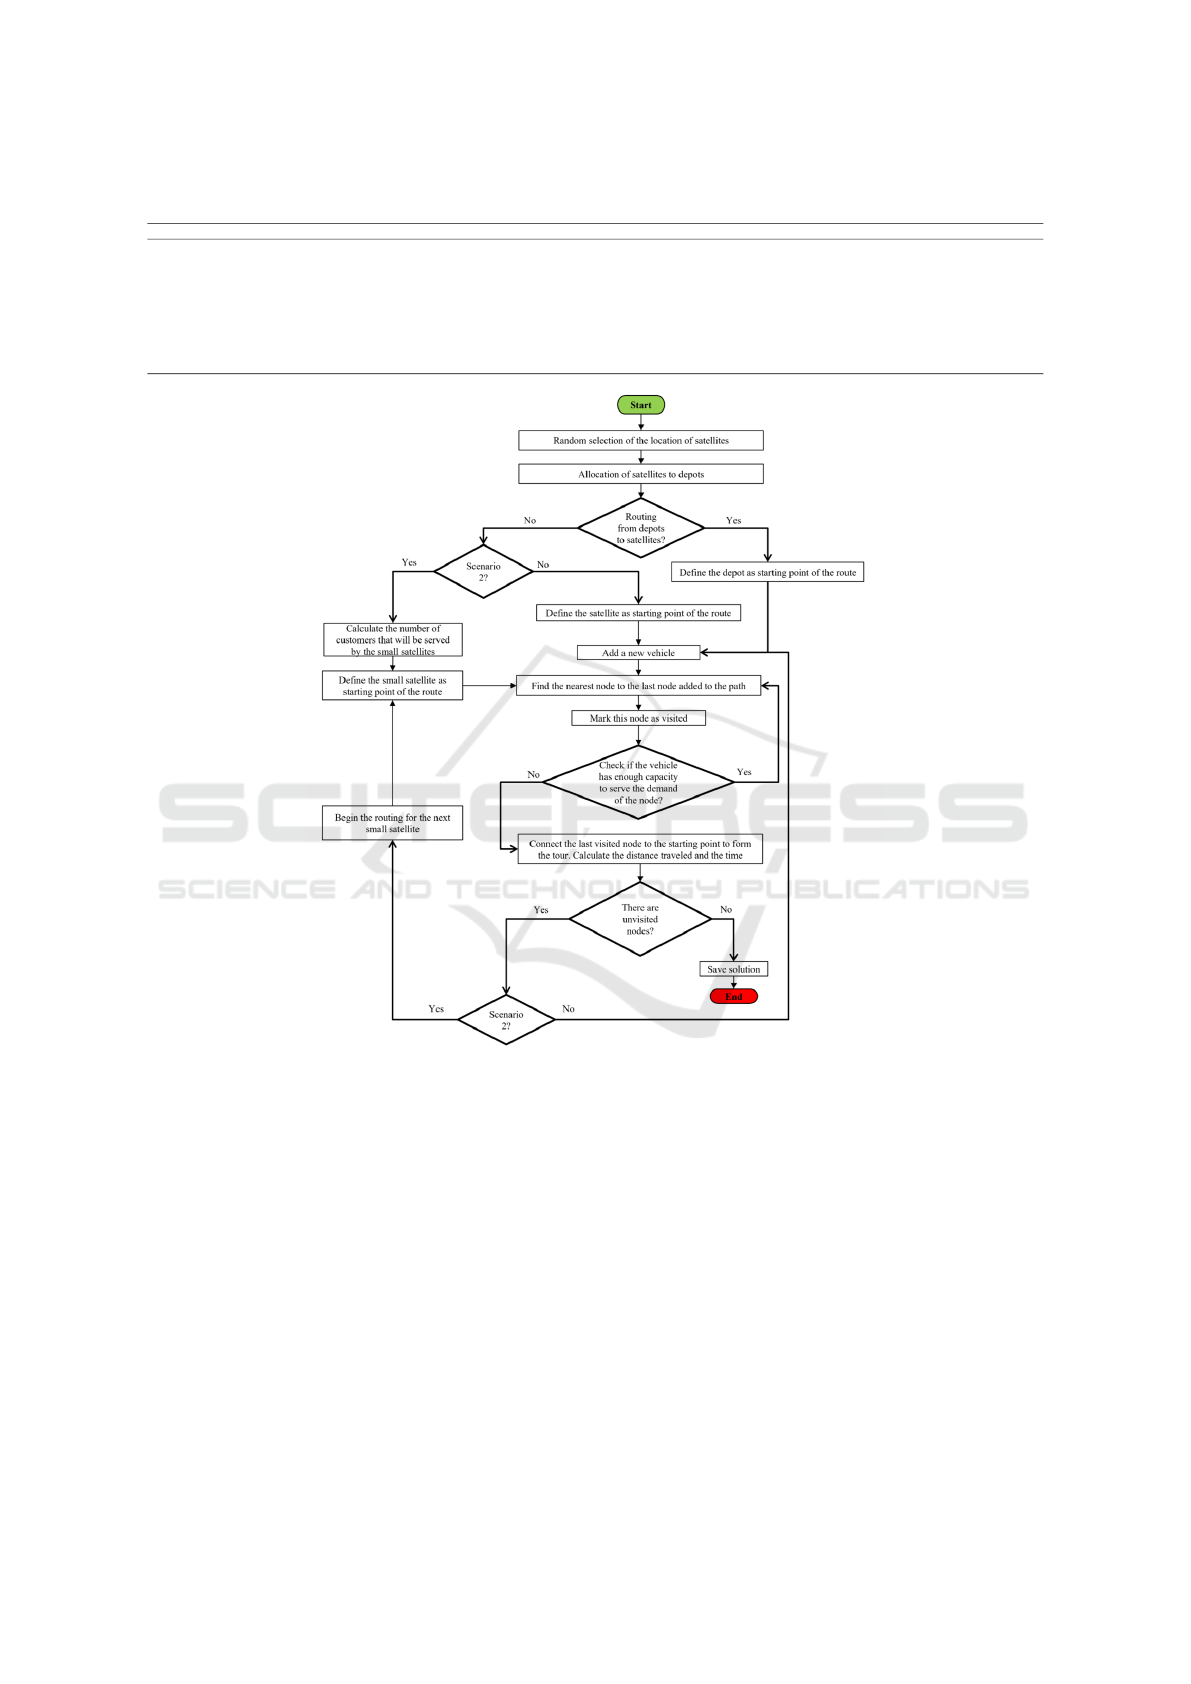
Table 1: Differences between scenarios proposed.
Scenario 1 Scenario 2
From depots to satellites and from satellites to customers (last-mile delivery) From depots to nodes where mobile satellites meet cargo bikes for last-mile delivery
Homogeneous fleet between echelons Heterogeneous fleet between echelons
1st and 2nd echelon transportation mode: Delivery van (800 kg)
1st echelon: Delivery vans as mobile satellites (900 kg)
2nd echelon: Cargo bikes (180 kg)
One node randomly selected to be the satellite in each district of Paris The number of mobile satellites in the district depends on its demand and vehicle capacity
A total 20 satellite facilities with unlimited capacity A total of 96 mobile satellites with a limited capacity of 900 kg
Delivery time was considered
sc2-min: considers a delivery time of 2 min per client
sc2-max: considers a delivery time of 8 min per client
Figure 2: Flowchart of the proposed solution approach.
four depots (Figure 1). For scenario 1, it was decided
that 5 satellites would be assigned to each one of the
depots. While, for scenario 2, 5 districts would be
assigned to each one of the depots.
The third sub-problem is the first-echelon routing
by an algorithm based on the NN procedure and fol-
lows the next steps:
1. Define the starting point of the route (Depot).
2. Find the nearest node to the last node added to the
path. If the nearest node is already in the path,
then choose the next closest.
3. Repeat step 2 until the vehicle reaches its maxi-
mum capacity.
4. Connect the last visited node to the depot to form
the tour. Calculate the distance traveled by the
vehicle and the total route time.
5. If there are unvisited nodes, add one more vehicle
and return to step 2.
4.2 Routing from Satellites to Clients
The last sub-problem is the design of routes for last-
mile delivery (second-echelon). For both scenarios,
satellites can only serve the nodes that belong to the
district assigned to them. It is important to note that
in scenario 1 the solution approach works in the same
way as the algorithm based on the NN procedure pre-
sented before. However, for scenario 2, as it has dif-
Adapting Retail Supply Chains for the Race to Sustainable Urban Delivery
357

ferent number of satellites for each district, the solu-
tion algorithm has some modifications. So, the prob-
lem is solved by following the next steps:
1. Divide the total number of clients of the district
into the number of satellites located into this dis-
trict.
2. Define the starting point of the route (Satellite i).
3. Find the nearest node to the last node added to the
path. If the nearest node is already in the path,
then choose the next closest.
4. Repeat step 3 until the vehicle n reaches its maxi-
mum capacity.
5. Connect the last visited node to the satellite to
form the tour. Calculate the distance traveled by
the vehicle and the total route time.
6. If there are unvisited nodes, add one more vehicle
and return to step 3.
7. If the total number of nodes for the satellite i were
already visited, the procedure for the satellite i + 1
is started (step 2).
8. Execute this procedure until all nodes are visited.
5 SCENARIOS SIMULATION
AND ANALYSIS OF RESULTS
The proposed solution procedure was coded in
Python, and experiments were run on a computer with
processor Intel® Core™ i7-10510U, CPU at 2.3 GHz
and 16 GB RAM. All below values were given by the
delivery firm. Two main scenarios are simulated. Ta-
ble 2 shows the distribution of the 96 satellites into the
20 districts of Paris for scenario 2. In this scenario,
delivery time was considered, which is the time that
the delivery man takes to unload the parcel, deliver
it, and return to the cargo bike to continue his route.
Different values were considered for the delivery time
from a minimum value of 2 minutes per delivery point
to a maximum of 8 minutes. Moreover, the working
hours of the delivery man are included, so the number
of trips required to visit all the delivery points with
5, 5.5 and 6 working hours is calculated. The value
presented for the number of tours is the average of the
three options of working hours.
Key performance indicators (Tables 3 and 4) such
as the number of vehicles, CO
2
e emissions, fine parti-
cles, fixed cost, and land use were considered to make
comparisons between scenarios. Mainly to assess if
the distribution network does not invade public space
in large proportions, if it is sustainable and if the fixed
costs associated with the operation are low.
Table 2: Number of satellites per district in scenario 2.
District
N° of
satellites
District
N° of
satellites
District
N° of
satellites
District
N° of
satellites
D1 2 D6 3 D11 6 D16 8
D2 3 D7 4 D12 6 D17 7
D3 2 D8 5 D13 8 D18 5
D4 2 D9 4 D14 5 D19 3
D5 3 D10 4 D15 10 D20 6
Table 3: Fixed cost in euros per transportation mode.
Indicator / Parameter Cargo bike Vehicle
Private cost per km 0.13 0.45
Time value per hour 8.47 13.10
Revenue index 0.83% 1.00%
Time value per hour according to the revenue 7.03 13.09
Speed (km/h) 14 15
Time value per km 0.50 0.87
Total fixed cost per km (C) 0.63 1.32
Table 4: CO
2
e emission factors, fine particles and land use
per transportation mode. Source: French Environmental
Agency (ADEME).
Cargo bike Vehicles
CO
2
e emission factors according to the average utilization (ton/km)
10% 0 5.099
20% 0 2.55
30% 0 1.7
40% 0 1.275
50% 0 1.020
60% 0 0.85
70% 0 0.728
80% 0 0.637
90% 0 0.567
100% 0 0.510
Fine particles (g/km) 0 0.01
Land use (m2) 1.77 9.15
Regarding the results obtained in the first echelon
(Table 5), it was found that in scenario 2, the num-
ber of vehicles needed to deliver the parcels from the
depot to the satellite in each district of Paris is lower.
Therefore, by using fewer vehicles, CO
2
e emissions
and fine particles, as well as the fixed cost and land
use are also lower. On the other hand, focusing on
Depot 2, it can be observed that the number of vehi-
cles used and the land use are equal in both scenar-
ios, nevertheless, although CO
2
e emissions are lower,
these vehicles are traveling a longer distance to de-
liver the parcels to the assigned satellites, which gen-
erates higher fixed costs and more fine particle emis-
sions, both indicators are dependent on the distance
traveled, that in scenario 1 is 1374.79 km and in sce-
nario 2 is 1376.69 km.
Table 5: Results for the first echelon: Routing from depots
to satellites.
Scenario Number of vehicles CO
2
e emissions (kg) Fine particles (g) Fixed cost ( C) Land use (m2)
Depot 1 sc1 24 1167.6 14.9 1966.3 219.6
sc2 23 1004.7 14.5 1912.7 210.5
Depot 2 sc1 20 1063.6 13.7 1814.7 183.0
sc2 20 949.7 13.8 1817.2 183.0
Depot 3 sc1 37 2818.9 35.8 4722.7 338.6
sc2 34 2288.4 32.7 4313.3 311.1
Depot 4 sc1 18 334.8 4.2 552.4 164.7
sc2 19 269.1 3.9 508.6 173.9
Scenario 2 uses cargo bikes for last-mile delivery,
so CO
2
e and fine particle emissions are zero. Regard-
ing the number of vehicles (Figure 3) and land use,
SIMULTECH 2024 - 14th International Conference on Simulation and Modeling Methodologies, Technologies and Applications
358
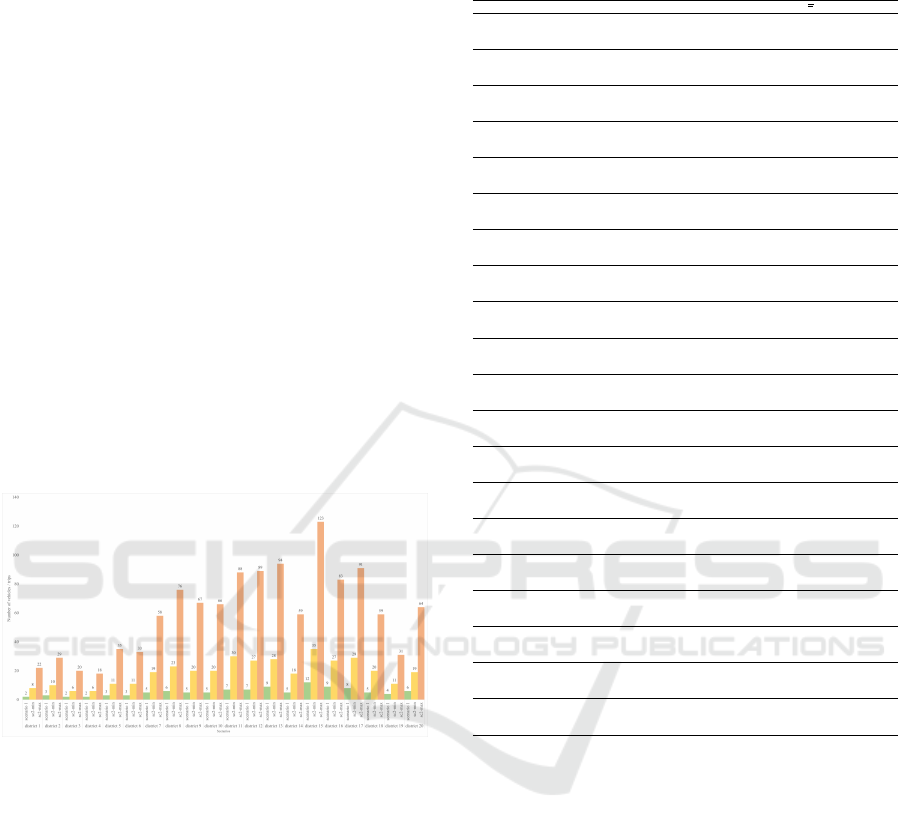
for instance, in district 15 scenario 1, the number of
trips or vehicles needed to deliver all the parcels is 12
which occupy 109.8 m2 of public space. However, in
sc2-min there are 35 trips or cargo bikes using 61.9
m2 of land, which means that in District 15 there is
a reduction in land use of 44% and, in relation to the
fixed cost, the cost of scenario 2 is 48% lower than
scenario 1. It is evident that the larger the district and
its demand, the more cargo bikes or trips using them
will be needed, which would cause a quite remark-
able increase of bicycles parked in different areas of
the city such as bike lanes or sidewalks, then it would
be another way to invade public space. Even between
scenario 1 and scenario 2 there is an average reduction
in terms of land use in the second echelon of 32%, and
56% regarding fixed cost (Table 6). As sc2-min and
sc2-max are the ones that considered cargo bikes, we
can say that 3189.8 kg of CO
2
emissions and 39.7 g of
fine particulate can be saved using this transportation
mode for last-mile delivery either if the delivery time
per node is 2 or 8 minutes. Further studies should
consider the stochasticity of this parameter to make
scenario 2 more realistic.
Figure 3: Number of vehicles or trips per scenario in each
district of Paris (notes: sc2-min refers to the 2min lowest
delivery time, sc2-max to the maximum delivery time of 8
minutes).
About the global results, Table 7 shows the reduc-
tion in CO
2
e emissions and fine particles when using
scenario 2, because the entire operation of the sec-
ond echelon is executed by cargo bikes that will not
affect the environment with CO
2
e emissions. There-
fore, these results should be analyzed together with
the other indicators to evaluate their performance so
the company can better understand the impact of ap-
plying the second scenario in its operations. In terms
of fixed cost, it can be noted that in 95% of the dis-
tricts the cost is lower when considering scenario 2,
with an average reduction of 25%. On the other hand,
when analyzing land use, the average reduction in
this indicator between scenario 1 and sc2-min is 17%,
whereas between sc2-min and s2-max there is an in-
Table 6: Second echelon results: Routing from satellites to
clients.
District Scenario CO
2
e emissions (kg) Fine particles (g) Fixed cost ( C) Land use (m2)
D1 scenario 1 79.1 1.0 127.8 18.3
sc2-min 0.0 0.0 42.0 14.1
sc2-max 0.0 0.0 42.0 38.9
D2 scenario 1 86.9 1.0 131.9 27.5
sc2-min 0.0 0.0 102.0 17.7
sc2-max 0.0 0.0 102.0 51.3
D3 scenario 1 55.8 0.6 84.1 18.3
sc2-min 0.0 0.0 32.7 10.6
sc2-max 0.0 0.0 32.7 35.4
D4 scenario 1 93.5 1.1 138.8 18.3
sc2-min 0.0 0.0 35.8 10.6
sc2-max 0.0 0.0 35.8 31.8
D5 scenario1 88.4 1.1 142.3 27.5
sc2-min 0.0 0.0 66.7 19.4
sc2-max 0.0 0.0 66.7 61.9
D6 scenario 1 84.6 1.0 133.9 27.5
sc2-min 0.0 0.0 55.0 19.4
sc2-max 0.0 0.0 55.0 58.3
D7 scenario 1 115.9 1.6 210.2 45.8
sc2-min 0.0 0.0 83.1 33.6
sc2-max 0.0 0.0 83.1 102.5
D8 scenario 1 207.7 2.4 314.1 54.9
sc2-min 0.0 0.0 115.6 40.7
sc2-max 0.0 0.0 115.6 134.4
D9 scenario 1 152.2 1.8 238.5 45.8
sc2-min 0.0 0.0 81.6 35.4
sc2-max 0.0 0.0 81.6 118.5
D10 scenario 1 169.5 2.1 272.6 45.8
sc2-min 0.0 0.0 95.6 35.4
sc2-max 0.0 0.0 95.6 116.7
D11 scenario 1 192.4 2.3 299.7 64.1
sc2-min 0.0 0.0 135.9 53.0
sc2-max 0.0 0.0 135.9 155.6
D12 scenario 1 221.4 2.7 354.0 64.1
sc2-min 0.0 0.0 192.2 47.7
sc2-max 0.0 0.0 192.2 157.4
D13 scenario 1 191.5 3.1 410.6 82.4
sc2-min 0.0 0.0 184.5 49.5
sc2-max 0.0 0.0 184.5 166.2
D14 scenario 1 198.4 2.4 319.4 45.8
sc2-min 0.0 0.0 135.1 31.8
sc2-max 0.0 0.0 135.1 104.3
D15 scenario 1 286.9 3.4 449.9 109.8
sc2-min 0.0 0.0 233.6 61.9
sc2-max 0.0 0.0 233.6 217.5
D16 scenario 1 252.7 3.4 445.1 82.4
sc2-min 0.0 0.0 218.1 47.7
sc2-max 0.0 0.0 218.1 146.7
D17 scenario 1 236.7 2.9 380.5 73.2
sc2-min 0.0 0.0 176.6 51.3
sc2-max 0.0 0.0 176.6 160.9
D18 scenario 1 169.7 2.1 272.6 45.8
sc2-min 0.0 0.0 127.7 35.4
sc2-max 0.0 0.0 127.7 104.3
D19 scenario 1 133.5 1.6 216.7 36.6
sc2-min 0.0 0.0 100.0 19.4
sc2-max 0.0 0.0 100.0 54.8
D20 scenario 1 173.0 2.1 278.0 54.9
sc2-min 0.0 0.0 142.4 33.6
sc2-max 0.0 0.0 142.4 113.2
crease in land use of 47% because it takes more trips
or more cargo bikes circulating in the city of Paris if
the delivery time is 8 minutes per delivery point.
Two important factors increase the total travel
time. The first factor is the speed of the cargo bike,
which is lower than the average speed of the vehi-
cle. Secondly, when adding the delivery time in sce-
nario 2, the increase in travel time is evident because
it is an extra time of 2 to 8 minutes to make what is
known in practice as a delivery in the street. Travel
time in sc2-min and sc2-max generates an increase
in the number of trips because the smaller capacity
of the cargo bikes means that more trips are needed to
cover the total demand of the delivery network. More-
over, working hours are limited to approximately 5.5
hours per day and the driver of the bicycle needs time
to hydrate, have lunch, take some kind of break. In
practice the delivery time is stochastic because the
delivery man does not take the same time in every de-
Adapting Retail Supply Chains for the Race to Sustainable Urban Delivery
359
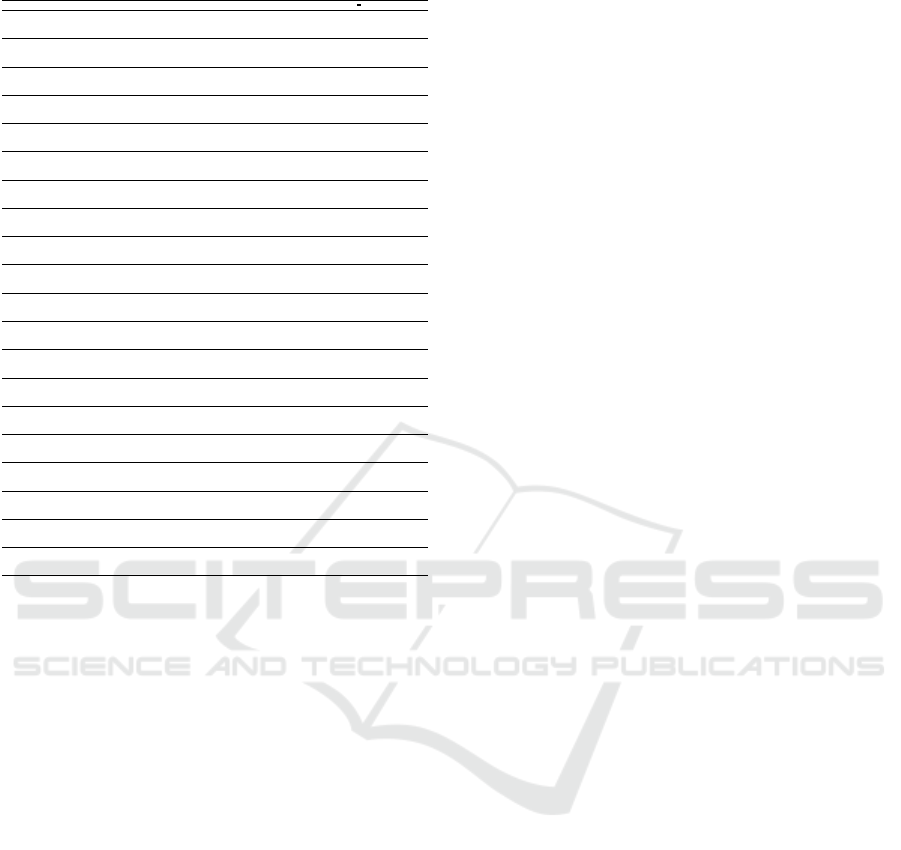
Table 7: Final results for each scenario.
District Scenario Travel time (h) CO
2
e emissions (kg) Fine particles emissions (g) Fixed cost ( C) Land use (m2)
D1 scenario 1 14.1 150.9 2.0 259.9 21.8
sc2-min 37.5 95.0 1.4 220.9 32.4
sc2-max 109.6 95.0 1.4 220.9 57.2
D2 scenario 1 20.4 232.9 2.9 376.6 54.9
sc2-min 56.2 150.9 2.2 397.3 45.1
sc2-max 147.6 150.9 2.2 397.3 78.7
D3 scenario 1 12.1 121.9 1.7 223.7 36.6
sc2-min 34.7 100.2 1.4 218.6 28.9
sc2-max 142.0 100.2 1.4 218.6 53.7
D4 scenario 1 10.3 117.7 1.4 190.6 36.6
sc2-min 26.2 35.6 0.5 101.6 28.9
sc2-max 83.5 35.6 0.5 101.6 50.1
D5 scenario1 13.9 159.2 1.9 256.6 54.9
sc2-min 46.6 59.5 0.9 181.2 46.9
sc2-max 155.2 59.5 0.9 181.2 89.3
D6 scenario 1 14.2 165.6 2.0 263.1 54.9
sc2-min 42.4 64.4 0.9 175.4 46.9
sc2-max 155.3 64.4 0.9 175.4 85.8
D7 scenario 1 37.0 381.5 5.2 684.2 91.5
sc2-min 95.0 211.3 3.1 491.4 70.2
sc2-max 289.8 211.3 3.1 491.4 139.1
D8 scenario 1 52.82 613.96 7.4 976.2 109.8
sc2-min 129.9 336.3 4.9 758.2 86.4
sc2-max 370.2 336.3 4.9 758.2 180.1
D9 scenario 1 32.9 362.7 4.6 607.8 91.5
sc2-min 100.2 177.5 2.5 418.2 72.0
sc2-max 324.1 177.5 2.5 418.2 155.1
D10 scenario 1 42.3 472.7 5.9 782.6 91.5
sc2-min 107.2 239.9 3.4 549.3 72.0
sc2-max 330.2 239.9 3.4 549.3 153.3
D11 scenario 1 42.6 484.8 6.0 786.7 128.1
sc2-min 133.1 245.4 3.6 606.4 107.9
sc2-max 418.3 245.4 3.6 606.4 210.5
D12 scenario 1 46.7 529.5 6.5 862.3 128.1
sc2-min 136.0 249.6 3.5 660.6 102.6
sc2-max 412.4 249.6 3.5 660.6 212.3
D13 scenario 1 63.1 659.4 8.8 1167.0 155.6
sc2-min 152.0 382.4 5.5 909.9 122.7
sc2-max 440.2 382.4 5.5 909.9 239.4
D14 scenario 1 41.5 476.1 5.8 767.6 91.5
sc2-min 100.9 237.6 3.5 594.6 77.6
sc2-max 291.5 237.6 3.5 594.6 150.1
D15 scenario 1 100.1 1116.7 14.0 1849.4 219.6
sc2-min 211.7 659.4 9.3 1459.2 141.0
sc2-max 585.7 659.4 9.3 1459.2 257.7
D16 scenario 1 86.6 923.2 12.1 1599.6 164.7
sc2-min 162.0 557.2 8.1 1287.4 120.9
sc2-max 417.4 557.2 8.1 1287.4 219.9
D17 scenario 1 74.5 845.8 10.4 1377.0 146.4
sc2-min 160.0 495.6 7.0 1098.8 115.3
sc2-max 444.5 495.6 7.0 1098.8 224.9
D18 scenario 1 22.8 261.6 3.2 421.0 91.5
sc2-min 80.9 58.2 0.8 237.9 81.1
sc2-max 266.7 58.2 0.8 237.9 150.1
D19 scenario 1 23.7 258.6 3.3 438.1 73.2
sc2-min 50.8 104.4 1.5 301.5 46.9
sc2-max 141.2 104.4 1.5 301.5 82.3
D20 scenario 1 20.9 239.9 2.9 386.7 109.8
sc2-min 84.9 51.4 0.7 240.1 88.5
sc2-max 280.0 51.4 0.7 240.1 168.1
livery point, that is why one scenario is considered
with more optimistic times than the other, to analyze
these differences. Finally, the increase in total travel
time between Scenario 1 and Scenario 2 is approxi-
mately 62%, while the increase between sc2-min and
sc2-max is 67%.
6 CONCLUSIONS AND
PERSPECTIVES
The retail industry has evolved with the increasing
expansion of e-commerce. Disruptive unexpected
events, such as the COVID-19 pandemic, have rein-
forced this global trend, so that supply chain and lo-
gistics operations have been redesigned. Since last-
mile supply chains are the core of e-commerce deliv-
ery operations, effective operational behavior is key to
allow e-commerce business to continue growing. In
addition, the configuration of last-mile supply chains
has evolved to nowadays require the design of two-
echelon urban delivery networks, in which urban con-
solidation centers (UCC) are key nodes between the
main supplier and the final customer. This network
structure is known in the literature as a two-echelon
supply chain.
This paper analyzed the problem of designing de-
livery routes in such two-echelon distribution sys-
tems. Because of its complexity to be solved when
dealing with large sized datasets, this paper evalu-
ated the implementation of an approximation algo-
rithm based on the well-known NN routing heuristic.
A set of numerical experiments were carried out on
datasets taken from a real-life French company deliv-
ering products to more than 90,000 points in Paris.
A heterogeneous fleet of delivery vehicles was evalu-
ated, using vehicles and cargo bikes in the first and
the second echelon, respectively. Different opera-
tional scenarios were evaluated, and the performance
of the system was assessed. Results show that the
consideration of mobile storage instead of conven-
tional satellites can generate savings not only in emis-
sions, fixed costs and land use, but also regarding in-
vestment cost of locating satellite facilities within the
city because transshipment activities between the de-
livery van and the cargo bike could be performed in
smaller areas such as a parking lots or public space
areas designated only for these purposes, while satel-
lites in scenario 1 could provide parcel storage ser-
vice, which leads to additional costs not considered
in this study. Moreover, the inclusion of eco-friendly
modes of transportation like cargo bikes has a lot of
potential to reduce some of the externalities caused
by the usual urban parcel delivery systems that have
conventional vans. Furthermore, although the consid-
eration of scenario 2 increases the invasion of public
space in inner-city areas, it does guarantee important
savings in CO
2
e and fine particulate emissions and,
fixed costs are lower. However, given the advantages
of using cargo bikes in the second scenario, a mix be-
tween electric vans and cargo bikes, taking advantage
of the benefits of each transportation mode, could be
considered in future research.
Based on the outcomes of this research, several
opportunities for further research are open. The re-
search on 2E-VRP and its variants has a lot of oppor-
tunities for example, the consideration of additional
constraints, like load or route balancing among ve-
hicles, stochastic delivery times, heterogeneous fleet
in the same echelon (electric vehicles, electric cargo
bikes, etc.), the design of distribution network con-
figurations with multimodal transportation for parcel
distribution systems in big cities, among other chal-
lenges. Another line for future research is the design
of other solution procedures, especially to deal with
very large amounts of delivery points. Finally, since
the proposed solution approach is used to generate a
solution to the problem, another research avenue will
address the design of improvement heuristics to ob-
tain better results in terms of routes.
SIMULTECH 2024 - 14th International Conference on Simulation and Modeling Methodologies, Technologies and Applications
360

ACKNOWLEDGEMENTS
The work of the first author was carried out un-
der a post-graduate scholarship awarded by Univer-
sidad de La Sabana, Colombia and Kedge Business
School, France. This work was also supported by
research grants INGPHD-52-2022 and INGPHD-10-
2019 from Universidad de La Sabana, Colombia.
REFERENCES
Anderluh, A., Hemmelmayr, V., and Nolz, P. (2019). Chap-
ter 8 - sustainable logistics with cargo bikes—methods
and applications. In Faulin, J., Grasman, S. E., Juan,
A. A., and Hirsch, P., editors, Sustainable Transporta-
tion and Smart Logistics, pages 207–232. Elsevier.
Bendoly, E., Craig, N., and DeHoratius, N. (2018). Consis-
tency and recovery in retail supply chains. Journal of
Business Logistics, 39(1):26–37.
Browne, M., Sweet, M., Woodburn, A., and Allen, J.
(2005). Urban freight consolidation centres final re-
port. Technical report, University of Westminster.
Buijs, P., Alvarez, J., Veenstra, M., and Roodbergen, K.
(2016). Improved collaborative transport planning at
dutch logistics service provider fritom. Interfaces,
46(2):119–132.
Caggiani, L., Colovic, A., Prencipe, L. P., and Ottomanelli,
M. (2021). A green logistics solution for last-mile de-
liveries considering e-vans and e-cargo bikes. Trans-
portation Research Procedia, 52:75–82.
Carlsson, J. and Song, S. (2018). Coordinated logistics
with a truck and a drone. Management Science,
64(9):4052–4069.
Cattaruzza, D., Absi, N., Feillet, D., and Gonz
´
alez-Feliu,
J. (2017). Vehicle routing problems for city logis-
tics. EURO Journal on Transportation and Logistics,
6(1):51–79.
Crainic, T., Perboli, G., Mancini, S., and Tadei, R. (2010).
Two-echelon vehicle routing problem: A satellite lo-
cation analysis. Procedia - Social and Behavioral Sci-
ences, 2(3):5944–5955.
Gonzalez-Feliu, J., Perboli, G., Tadei, R., and Vigo, D.
(2008). The two-echelon capacitated vehicle routing
problem.
Jacobsen, S. and Madsen, O. (1980). A comparative study
of heuristics for a two-level routing-location problem.
European Journal of Operational Research, 5(6):378–
387.
Juan, A., Faulin, J., Grasman, S., Rabe, M., and Figueira, G.
(2015). A review of simheuristics: Extending meta-
heuristics to deal with stochastic combinatorial op-
timization problems. Operations Research Perspec-
tives, 2:62–72.
Kull, T., Boyer, K., and Calantone, R. (2007). Last-mile
supply chain efficiency: an analysis of learning curves
in online ordering. International Journal of Opera-
tions & Production Management, 27(4):409–434.
Lone, S., Harboul, N., and Weltevreden, J. (2021). Eu-
ropean e-commerce report. Technical report, E-
Commerce Europe.
Marrekchi, E., Besbes, W., Dhouib, D., and Demir, E.
(2021). A review of recent advances in the oper-
ations research literature on the green routing prob-
lem and its variants. Annals of Operations Research,
304(1):529–574.
Meza-Peralta, K., Gonzalez-Feliu, J., Montoya-Torres, J.,
and Khodadad-Saryazdi, A. (2020). A unified typol-
ogy of urban logistics spaces as interfaces for freight
transport. Supply Chain Forum: An International
Journal, 21(4):274–289.
Montoya-Torres, J., Mu
˜
noz-Villamizar, A., and Mejia-
Argueta, C. (2021). Mapping research in logistics and
supply chain management during covid-19 pandemic.
International Journal of Logistics Research and Ap-
plications, 26(4):421–441.
Nguyen, D., de Leeuw, S., Dullaert, W., and Foubert, B.
(2019). What is the right delivery option for you? con-
sumer preferences for delivery attributes in online re-
tailing. Journal of Business Logistics, 40(4):299–321.
Patier, D. and Browne, M. (2010). A methodology for the
evaluation of urban logistics innovations. Procedia -
Social and Behavioral Sciences, 2(3):6229–6241.
Ramirez-Villamil, A., Jaegler, A., and Montoya-Torres, J.
(2022). Sustainable local pickup and delivery: The
case of paris. Research in Transportation Business &
Management, 45:100692.
Reed, S., Campbell, A., and Thomas, B. (2022). The value
of autonomous vehicles for last-mile deliveries in ur-
ban environments. Management Science, 68(1):280–
299.
Sandhaus, G. (2019). Trends in E-commerce, Logistics and
Supply Chain Management, pages 593–610. Springer
International Publishing, Cham.
Silva, V., Amaral, A., and Fontes, T. (2023). Towards sus-
tainable last-mile logistics: A decision-making model
for complex urban contexts. Sustainable Cities and
Society, 96:104665.
Soeffker, N., Ulmer, M. W., and Mattfeld, D. C. (2022).
Stochastic dynamic vehicle routing in the light of pre-
scriptive analytics: A review. European Journal of
Operational Research, 298(3):801–820.
Stamadianos, T., Kyriakakis, N., Marinaki, M., and Mari-
nakis, Y. (2023). Routing problems with electric and
autonomous vehicles: Review and potential for future
research. Operations Research Forum, 4(2).
Stroh, A., Erera, A., and Toriello, A. (2022). Tactical design
of same-day delivery systems. Management Science,
68(5):3444–3463.
Taiwo, O., Josiah, O., Taiwo, A., Dkhrullahi, S., and Sade,
O. K. (2013). Implementation of heuristics for solv-
ing travelling salesman problem using nearest neigh-
bor insertion approaches. International Journal of Ad-
vanced Research, 1(3):139–155.
Vega-Mej
´
ıa, C., Montoya-Torres, J., and Islam, S. (2019).
Consideration of triple bottom line objectives for sus-
tainability in the optimization of vehicle routing and
loading operations: a systematic literature review. An-
nals of Operations Research, 273(1):311–375.
Adapting Retail Supply Chains for the Race to Sustainable Urban Delivery
361

Zhou, L., Baldacci, R., Vigo, D., and Wang, X. (2018).
A multi-depot two-echelon vehicle routing problem
with delivery options arising in the last mile distri-
bution. European Journal of Operational Research,
265(2):765–778.
SIMULTECH 2024 - 14th International Conference on Simulation and Modeling Methodologies, Technologies and Applications
362
