
Delivery Zones Partitioning Considering Workload Balance Using
Clustering Algorithm
Jaruwan Wangwattanakool
1 a
and Wasakorn Laesanklang
1,2 b
1
Department of Mathematics, Faculty of Science, Mahidol University, Ratchathewi, Bangkok, 10400, Thailand
2
Centre of Excellence in Mathematics, CHE, Bangkok, 10400, Thailand
Keywords:
Workload Balance, Last Mile Logistics, Zoning, K-Mean.
Abstract:
This research proposes a novel approach for partitioning delivery zones in Bangkok that utilizes a combination
of clustering and iterative algorithms. The approach leverages 30 days of delivery data to create delivery
zones that having balanced workloads for drivers. The study begins by analyzing the delivery data to confirm
the presence of unbalanced workloads across drivers within the 30-day period. To solve this imbalance, we
use iterative k-means to adjust delivery zones considering the number of deliveries within the zone. The
effectiveness of the approach was evaluated using two sets of parameters: geographic coordinates (latitude
and longitude) and actual travel distance to reflect real-world scenarios. Regardless of the parameter set
used, the experiments yielded balanced transportation areas with evenly distributed workloads. This approach
demonstrates an improvement in workload equality compared to the original workload distribution.
1 INTRODUCTION
In recent years, the expansion of e-commerce has sig-
nificantly increase the demand for delivery services,
particularly in urban areas. This growth translates to
a substantial daily volume of orders for both delivery
and product pick-up, subsequently elevating the op-
erational costs for delivery companies. This essential
process, known as last-mile logistics, faces significant
challenges in urban environments. These challenges
include traffic congestion, unique road networks con-
straints. Additionally, customer-related limitations,
such as limited operating hours of delivery locations
and the availability of the drivers, add further com-
plexity to the process.
Driver assignment plays an important role in en-
hancing operational efficiency. The establishment of
delivery zones fundamental for both drivers and route
planners, aiding in the organization of last mile logis-
tics. A driver’s familiarity with an area significantly
influences customer satisfaction; this includes not just
navigating skills, but also an understanding of the spe-
cific delivery protocols at customer locations.
Efficient route planning can reduce a company’s
transportation costs and contribute to alleviating
a
https://orcid.org/0009-0009-4510-9126
b
https://orcid.org/0000-0003-4203-3452
environmental concerns. In addition, maintaining
consistent delivery zones provides planner with an
advantage, especially when faced with tight decision
making timelines, such as executing time-sensitive
delivery.
There are several strategies for generating delivery
zones, including the use of modern optimization algo-
rithms or the development of machine learning mod-
els. In 2022 and 2023, a combination algorithm based
on k-means clustering was utilized (S.H. Huanga,
2023) (El Ouadi et al., 2022). Creating delivery
zones ensuring an equitable distribution of workload
requires the consideration of multiple factors, such
as the total number of delivery destinations, the spe-
cific delivery time frames assigned to each location.
Although clustering algorithms offer a methodology
for dividing areas, they often fall short due to the
potential for unbalanced clusters. Thus, this project
introduces a two-phase approach that combines the
strengths of clustering algorithm with iterative meth-
ods to establish zones that boast balanced workloads.
This method utilizes a month’s delivery data for gen-
erating equitable zoning strategy.
378
Wangwattanakool, J. and Laesanklang, W.
Delivery Zones Partitioning Considering Workload Balance Using Clustering Algorithm.
DOI: 10.5220/0012803800003758
Paper published under CC license (CC BY-NC-ND 4.0)
In Proceedings of the 14th International Conference on Simulation and Modeling Methodologies, Technologies and Applications (SIMULTECH 2024), pages 378-385
ISBN: 978-989-758-708-5; ISSN: 2184-2841
Proceedings Copyright © 2024 by SCITEPRESS – Science and Technology Publications, Lda.

2 LITERATURE REVIEW
Research focusing on route optimization for urban lo-
gistics often centers around the Vehicle Routing Prob-
lem (VRP), a pivotal challenge due to the VRP’s clas-
sification as NP-hard. This complexity means that
managing deliveries in urban areas involves navigat-
ing an exceptionally large decision space, making the
efficient resolution of VRP crucial for effective logis-
tics operations.
Recent trends in last-mile logistics research have
shifted towards improving algorithms for finding ef-
ficient solutions in a short period of computational
timeframe. However, an emerging trends involves
leveraging artificial intelligence to tackle the prob-
lem. (Demir et al., 2022) is suggested that AI has the
potential to significantly reduce the time complexity
of creating delivery routes, particularly when dealing
with large volumes of orders. Partitioning the city into
zones is a crucial preliminary step in this process, as
it can create time efficient solutions when generating
vehicle routes.
The method of zoning prior to routing has gained
popularity in managing last-mile logistics, as high-
light by research presented by (Muhammad et al.,
2023) and (Zhao et al., 2022). The implementation
of the zoning-based pricing strategies for the VRP has
demonstrated effective performance (Shi et al., 2023),
(Afsar et al., 2021). The research exhibits the impor-
tance of zoning in logistic operations, particularly in
the context of last-mile delivery challenges.
K-means is a technique widely utilized in sev-
eral VRP research, especially when dealing with
zoning. K-means groups data points into distinct,
non-overlapping clusters based on certain parameters
(Hartigan, 1975). This method calculates distances
between points and updates cluster centers, thereby
effectively assigning data points to the most suitable
cluster. The process utilizes a specific formula to
determine the distance metric for this purpose. Al-
though K-means clustering is applied across a broad
range of fields due to its versatility, it is not without
limitations. One notable drawback is that it is less
likely that the number of data points in every cluster
would be balanced, indicating a potential bias work-
load when assigning areas to drivers.
K-means has found successful application in other
domains, particularly in zoning purposes. (Peder-
sen et al., 2022) implemented a weighted K-means
method to effectively partition delivery zones specifi-
cally designed for drone logistics. Further relevant re-
search includes the introduction of a Clustering-based
Routing Heuristic (CRH) (Prajapati et al., 2023),
aimed at optimizing last-mile logistics for a fresh food
company. (Bruni et al., 2023) investigated the inte-
gration of machine learning with heuristic algorithms
to address similar logistic challenges. (Ouadi et al.,
2020) and (El Ouadi et al., 2022) combined K-means
with time series methods to forecast demand, facili-
tating more effective zoning in urban areas.
The significance of zoning for effective workload
planning has been emphasized by the recent research
(Jabbari et al., 2020). (Wang et al., 2022) empha-
size the need to consider driver workload would sus-
tain morale within the courier workforce. Workload
balance emerges prominently in numerous studies fo-
cused on last-mile logistics management, as shown in
(S.H. Huanga, 2023). Further contributing to this dis-
cussion, (Lorenzo-Espejo et al., 2023) reveals a sig-
nificant link between driver workload, their perfor-
mance, and the distances they travel. (LI et al., 2022)
employ K-mean to achieve balanced customer groups,
showcasing the utility of machine learning techniques
for creating balanced workload.
Recently, a study conducted by (Moreno-Saavedra
et al., 2024) showcases a multi-algorithm approach
that combines recursive and evolutionary algorithms
with K-means. This approach aims to optimize the
balancing of operational workload for drivers within
the last-mile urban delivery system. This research
highlights the significant advantages of integrating K-
means with other algorithms to derive optimal solu-
tions for logistical challenges. This integration not
only enhances the efficiency of workload distribution
among drivers but also contributes to the broader ob-
jective of improving the overall performance of last-
mile delivery operations.
As shown in the literature, clustering algorithms
are commonly used to generate zones for drivers.
Workload balance is also a major focus in several re-
search studies. However, many approaches address
the problem on a day-to-day basis, where the driver’s
zone may change depending on daily delivery de-
mands. On the other hand, our research utilizes a
month’s worth of data to create delivery zone, ensur-
ing driver familiarity to the delivery areas. This pro-
vides a distinctive feature for our research.
3 METHODOLOGY
3.1 Data Information
This subsection focuses on a delivery dataset span-
ning one month, comprising 30,055 rows of delivery
points. There are several columns providing delivery
information such as driver id, delivery date, actual de-
livery time, and geometric coordinates. The first row
Delivery Zones Partitioning Considering Workload Balance Using Clustering Algorithm
379

for each driver on each day represents their depot lo-
cation, and workload of each driver is then measured
by considering the total delivery time and the number
of delivery points.
3.2 Partition Algorithm
This subsection presents a novel algorithm that com-
bines k-mean with an iterative approach, structured
as a two-phase process. The initial phase employs k-
mean to partition the urban area into distinct deliv-
ery zones. The second phase of the algorithm takes
into account the distribution of deliveries within each
zone, as determined in the first phase, to achieve
workload balance across zones. The workload bal-
ance process is attained thought the use of a statistical
method, which iteratively adjusts the allocation of de-
livery points to ensure that the delivery workload is
evenly distributed.
Data: geographic coordinate, a number of
drivers
Result: area of delivery
Initial step: assign delivery point to area of
delivery using K-mean clustering according
to the number of drivers;
calculate quartiles from the number of
delivery;
Q1 ← the first quartile of clusters;
Q3 ← the third quartile of clusters;
; /* classification type of clusters
*/
for cluster ← the number of clusters do
if the number of point in the cluster more
than Q3 then
Over-Zone ← cluster;
end
if the number of point in the cluster lower
than Q1 then
Under-Zone ← cluster;
else
Balanced Zone ← cluster;
end
end
Algorithm 1: Overall of classification clusters algorithm.
Algorithm 1 outlines the initial phase of the work-
load balancing procedure. This initial phase starts
with the importation of delivery data, including the
geographical coordinates of customers. These coor-
dinates served as input for the clustering algorithm.
The number of clusters is set to match the number of
active drivers within the observed month. Utilizing
k-means, each delivery point is allocated to a specific
cluster based on proximity. Following the clustering
process, the algorithm proceeds to calculate the first
and third quartiles. The first and third quartiles cal-
culated from the initial phase are retained and used as
zone balancing criteria. Therefore, the algorithm con-
sistently uses Q1 and Q3 from the first clustering step
for every iteration. Each cluster is then classified into
three categories:
1. Over-zone is the zone having delivery points more
than Q3.
2. Under-zone is the zone having delivery points less
than Q1.
3. Balanced zone is the zone having delivery points
between Q1 and Q3.
Data: geographic coordinate, list of
Over-Zone, list of Under-Zone,Q1,Q3
Result: area of delivery
while OverZone and UnderZone is not empty
do
num over ← the numbers of clusters of
Over-zone cluster;
num under ← the numbers of clusters of
Under-zone cluster;
adjusted num under ← add the number
of points of Under-zone and divided by
Q3;
different ← a round up of
adjusted num under;
if Over-Zone is not empty then
num cluster ← num over +
(num under - different);
assign all delivery points in all
Over-Zone to area of delivery using
K-mean according to num cluster ;
end
if Under-Zone is not empty then
num cluster ← different;
assign all delivery point in all
Under-Zone to area of delivery using
K-mean according to num cluster ;
end
classification new clusters in Over-Zone,
Under-Zone and Balanced Zone;
end
Algorithm 2: Overall of re-clustering algorithm.
In the subsequent phase of the workload balanc-
ing process, as detailed in Algorithm 2, the focus
shift to the over-zone and the under-zone. For these
two zones, k-means is repeatedly applied to refine the
cluster until we have balanced workload.
The re-clustering strategy, designed to tackle the
SIMULTECH 2024 - 14th International Conference on Simulation and Modeling Methodologies, Technologies and Applications
380

challenge of a limited number of drivers, on the prin-
ciple of adjusting the number of zones to achieve a
more balanced distribution of workload. Specifically,
this approach seeks to decrease the number of zones
classified under the under-zone category while in-
creasing the number of zones classified as over-zone.
In the final step of the process, clusters that have
not yet achieved balance are subject to re-clustering,
with the new number of clusters being determined as
per calculations made in the previous step. After re-
clustering, the balanced of each zone is again deter-
mined by the number of tasks and the quartile values
which retrieve from the initial step. Finally, all the ar-
eas are re-examined to confirm that no zone is entirely
encompassed by another. If there are zones to be in-
tersect or be nested within each other, a further round
of re-clustering is initiated. The number of cluster in
this round corresponds exactly to the total number of
intersecting zones.
3.3 Scenario with Actual Travel
Distance
To craft zoning reflects real-world logistics, it is es-
sential to consider the distances between delivery
points. However, calculating all pairwise distances,
especially for a large dataset, can be computationally
expensive. For instance, utilizing a mapping service
like Longdo Map API for this purpose would result in
an operational that could take more than an hour given
the size of the problem at hand. This approach is not
feasible due to the high computational cost and exces-
sive the time requirement. To dealing with this issue
and enhance algorithm efficiency, instead of using all
delivery points, we employ representative point strat-
egy. This method selects a subset of points that effec-
tively represent the broader set of delivery locations
within a 500-meter radius. We assume that the 500-
meter is a short distance that is negligible enough not
to significantly impact travel time. This approach re-
duces the number of necessary API calls for distance
calculation, improves the computation time of the
zoning process. By focusing on representative points
rather than the entire dataset, the computational bur-
den is lessen without sacrificing the accuracy needed
for practical route planning. However to accommo-
date this approach, there is a need to transition from
a standard k-mean algorithm to a weighted k-mean
variant (Kerdprasop et al., 2005). The weighted k-
mean algorithm adjusts for the density of these repre-
sentative points, ensuring that the clustering process
accounts for the varying importance or frequency of
deliveries within certain areas.
4 RESULTS
4.1 Overview of the Experiment
4.1.1 Data Overview
The investigation of the dataset reveals insights into
the delivery operations of a real-world scenario over a
one-month period. A total of 912 delivery trips were
recorded during this timeframe, which translates to
an average of approximately 30.4 drivers being dis-
patched daily to handle deliveries. Further analysis of
the 30,055 delivery point records indicates that a sig-
nificant majority, 26,669 rows, correspond to deliver-
ies made on weekdays. This distribution suggests that
the bulk of delivery operations are concentrated on
weekdays, reflecting typical business operations and
customer ordering patterns. On the other hand, 1,562
points are attributed to weekend deliveries. Notably,
these weekend deliveries do not include depot assign-
ments, which might imply a different logistical setup
or operational protocol for weekend delivery services
compared to weekdays. This breakdown of delivery
data offers valuable insights into the operational dy-
namics and scheduling preferences.
The detailed analysis of weekday delivery opera-
tions reveals that the average number of active drivers
per day stands at 33.14, with a relatively low stan-
dard deviation of 1.06. This indicates a consistent
level of driver deployment on weekdays, demonstrat-
ing a stable demand for delivery services and effective
workforce management. The range of active drivers,
which spans from a minimum of 31 to a maximum of
35 drivers, further underscores this consistency, sug-
gesting that operational needs and capacity are well-
matched on a day-to-day basis. The median of the
number of driver is at 33, indicating that the central
tendency of driver deployment aligns closely with the
average. This support the decision to utilize 33 as the
target number of clusters for the subsequent zoning
process.
4.1.2 Measurement for Drivers Workload
This section focuses on measuring driver workload.
We consider both delivery time and the number of
delivery points per driver. Table 1 presents selected
statistics on driver workloads in term of delivery point
and working time, split into weekend and weekday
categories.
The data presented in Tables 1 highlights a sub-
stantial disparity in the workload between weekdays
and weekends. This shows that the majority of the
operational demands encounter during the weekdays.
Specifically, the number of delivery points during
Delivery Zones Partitioning Considering Workload Balance Using Clustering Algorithm
381
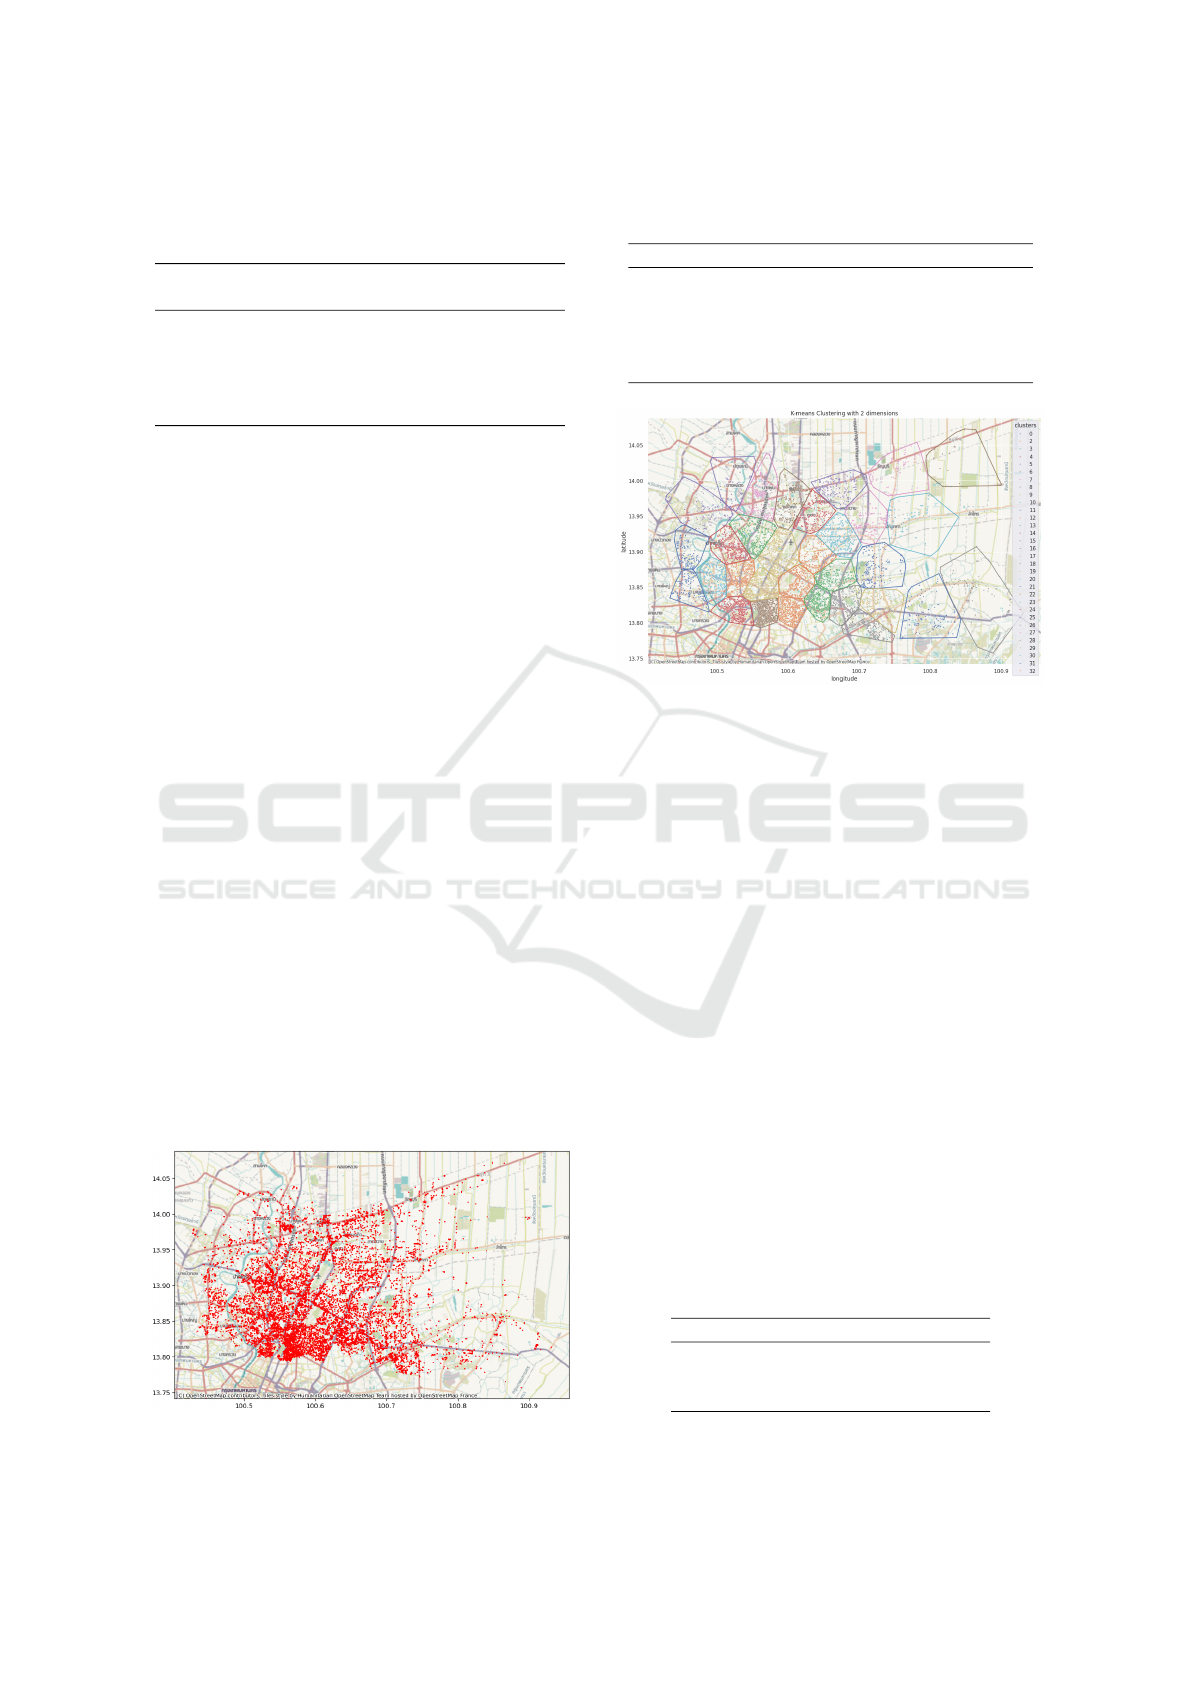
Table 1: Selected descriptive statistics of delivery point (pt)
and working time (min) in a month on driver workloads split
into weekday and weekend.
Weekend Weekday
pt min pt min
average 33.28 19.23 867.429 431.30
Q2 36 13.06 925 511
SD 17.38 19.33 382.22 171.72
minimum 1 3 2 50
maximum 67 210 1880 736
weekdays is observed to be more than 26 times higher
than those recorded over the weekends. Similarly, the
total delivery time—or working hours—accumulated
on weekdays surpasses that of weekends by approx-
imately 20 times. With the substantially higher
demands on weekdays, it is clear that zoning ef-
forts should primarily focus on weekday data. Fur-
thermore, the variation in workload—reflected in
both the delivery time and the number of delivery
points—suggests that relying on average values might
not provide the most accurate representation of a typ-
ical driver’s day. The median offers a more suitable
metric for understanding and planning workloads.
Statistics from Table 1 reveals imbalances in
driver workload, as evidenced by the standard devi-
ation as well as maximum and minimum deliveries
per driver per day. These disparities indicates a need
for more equitable allocation of deliveries.
4.2 Clustering Result Using Geographic
Coordinate
Figure 1 illustrates delivery points plotted over the
map of the Bangkok metropolitan area, derived from
one-month of delivery data.
Figure 2 illustrates the initial zoning generated by
the first-phase algorithm. The lines encompass de-
livery areas into distinct zones by k-means algorithm
whose number of clusters was determined as outlined
in Section 4.1.1.
Figure 1: Original delivery points on the map.
Table 2: The quartile of delivery point in each clusters from
first clustering.
Quartile Delivery points in clusters (points)
minimum 80
Q1 436
Q2 588
Q3 1198
maximum 2114
Figure 2: The clusters of delivery zone from first K-mean
clustering.
Table 2 displays the results of the quartile analy-
sis performed on the list of clusters. When these re-
sults are compared with the initial data from week-
days, both the minimum and the median values of de-
livery points per cluster have increased, indicating a
shift in workload distribution. However, the result
shows that the maximum number of delivery points
within a single cluster has surpassed even the original
maximum value. This suggests that, despite efforts to
redistribute the workload, imbalances still persist with
some clusters being overloaded compared to others as
shown in Table 3.
Figure 3 showcases a line graph that effectively
compares the number of delivery points per area at
different stages of the algorithm’s application. On
the graph, the X-axis categorizes areas in ascending
order based on the number of delivery points they
contain, from the fewest to the most. The Y-axis,
meanwhile, quantifies the number of delivery points
attributed to each area. The result shows the impact of
the re-clustering algorithm, illustrating a trend toward
a more balanced distribution of delivery points across
Table 3: Clusters from the initial clustering into three types.
Type of Zone The number of Zone
Balance 17
Over 9
Under 9
SIMULTECH 2024 - 14th International Conference on Simulation and Modeling Methodologies, Technologies and Applications
382
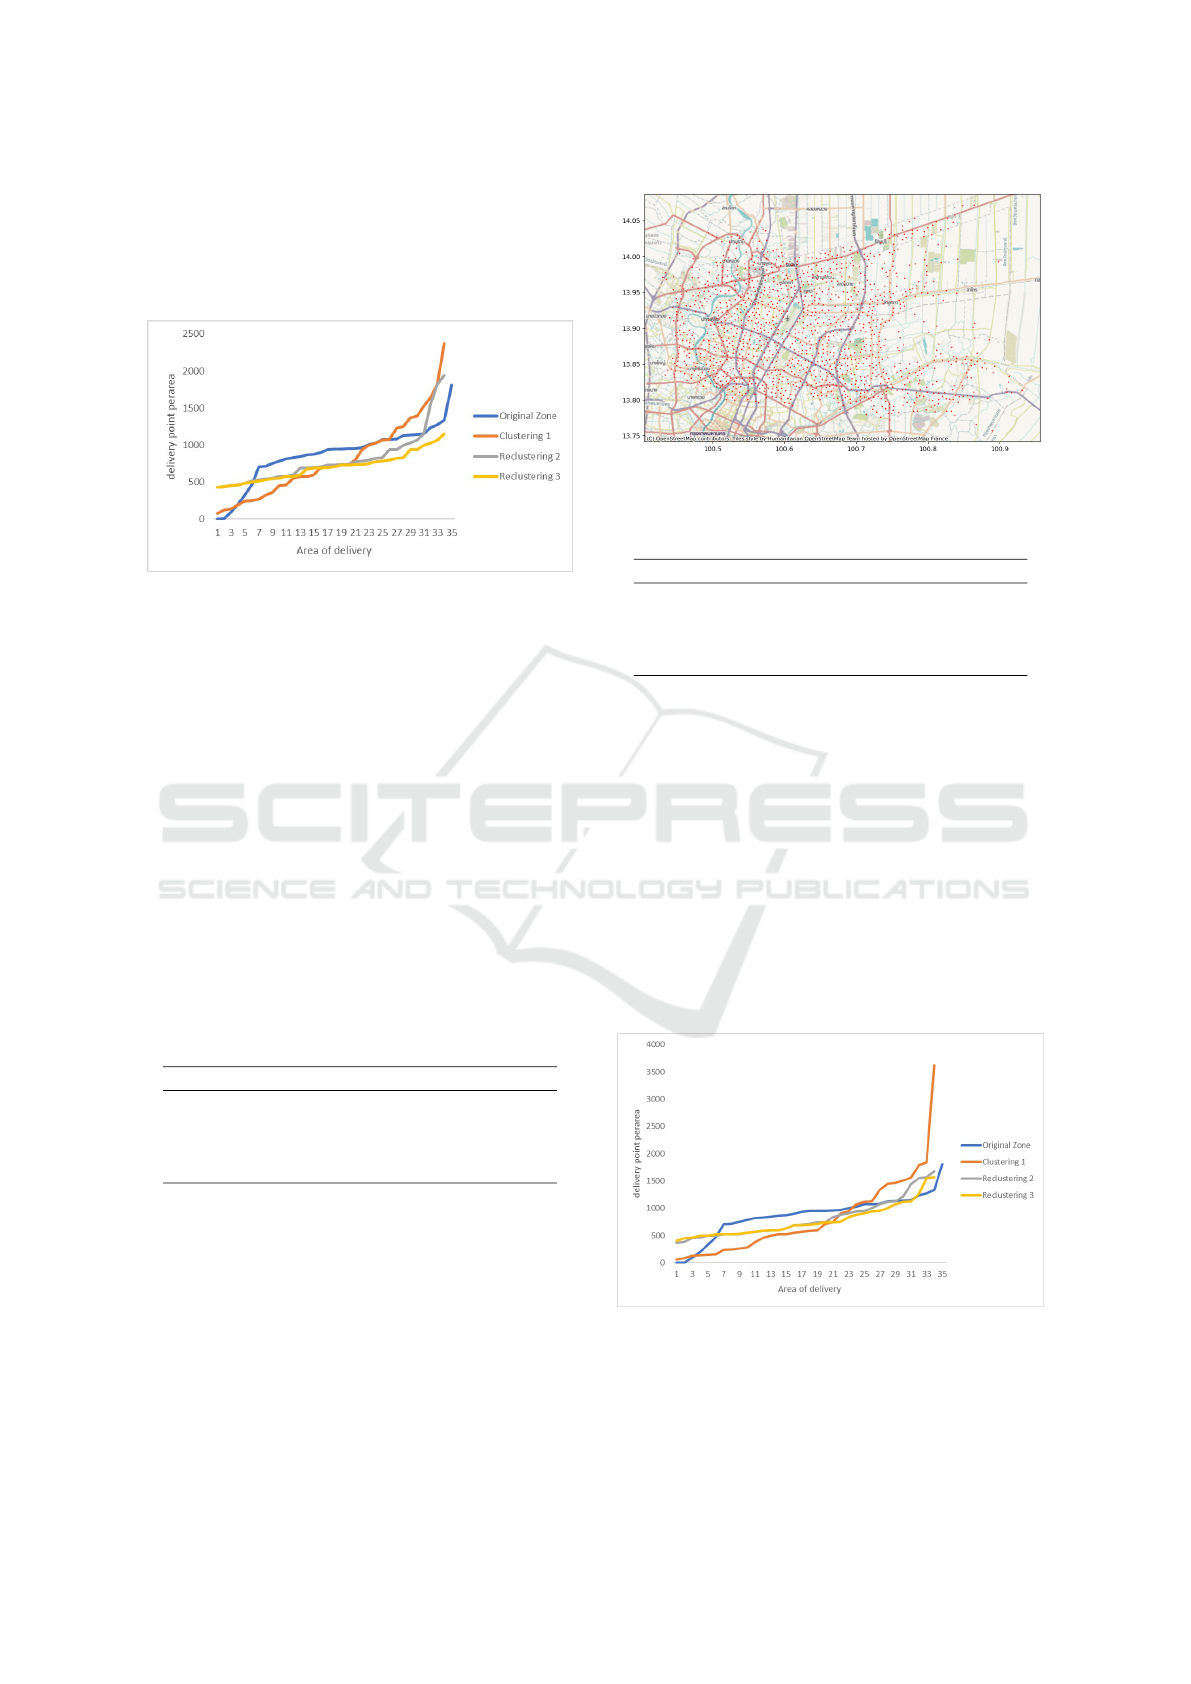
cluster. At the initial stage, the graph shows signif-
icant variability in the number of delivery points per
area. After two rounds of re-clustering attempts, the
variability diminishes, reflecting a progressive equal-
ization of workloads across different areas.
Figure 3: The number of delivery points for each area is
sorted from lowest to highest.
Table 4 presents another innovative metric for as-
sessing workload balance, which is the slope of the
line graph representing the distribution of delivery
points per area, sorted in ascending order. Initially,
the clustering process yield a slope of 34.03, which
serves as a quantitative indicator of the distribution
of workloads among drivers. A steeper slope in the
context would suggest a less balanced plan. After
the final re-clustering step, the slope has decreased to
15.16. This enhancement signifies a 55.45% improve-
ment in the balance of driver workloads, demonstrat-
ing the effectiveness of the re-clustering algorithm to
achieving a more equitable distribution. Note that the
slope decreases with each re-clustering step, which is
a positive indication of the adjustment of the driver
workload.
Table 4: Slope of driver’s workload in each iteration.
The number of times for re-clustering Slope
Original zone 34.03
K-Mean clustering 51.86
Re-clustering 1 31.26
Re-clustering 2 15.16
4.3 Clustering Result Using Travel
Distance
For clustering based on distance between delivery
points, minimizing the number of points to calcu-
late distances is a crucial step in reducing the time
required to call distance information from map API.
Figure 4 illustrate the representative points for group
of points that are within 0.5 km of each other. The
Figure 4: Reduce original delivery points on the map.
Table 5: Slope of driver’s workload (capacity) in each iter-
ation.
The number of times for re-clustering Slope
Original zone 34.03
K-Mean clustering 63.58
Re-clustering 1 33.78
Re-clustering 2 27.66
representative points consolidates the other nearby
points. As a result, this method reduces the total
points of 30,055 to 1,352 representative points.
The results based on the distance parameter re-
veals that, the overall balance of driver workloads
does not exhibit significant differences when com-
pared to clustering based on geometric coordinates.
Although, the shapes of the resulting delivery zones
do vary. Figure 5 displays line graph comparing
the number of delivery points within the area of de-
livery, generated by the workload balance algorithm
using distance parameter. The result confirms that
re-clustering method make the workload distribution
more equitable.
Figure 5: The number of delivery points (capacity) for each
area is sorted from lowest to highest in distance.
Delivery Zones Partitioning Considering Workload Balance Using Clustering Algorithm
383
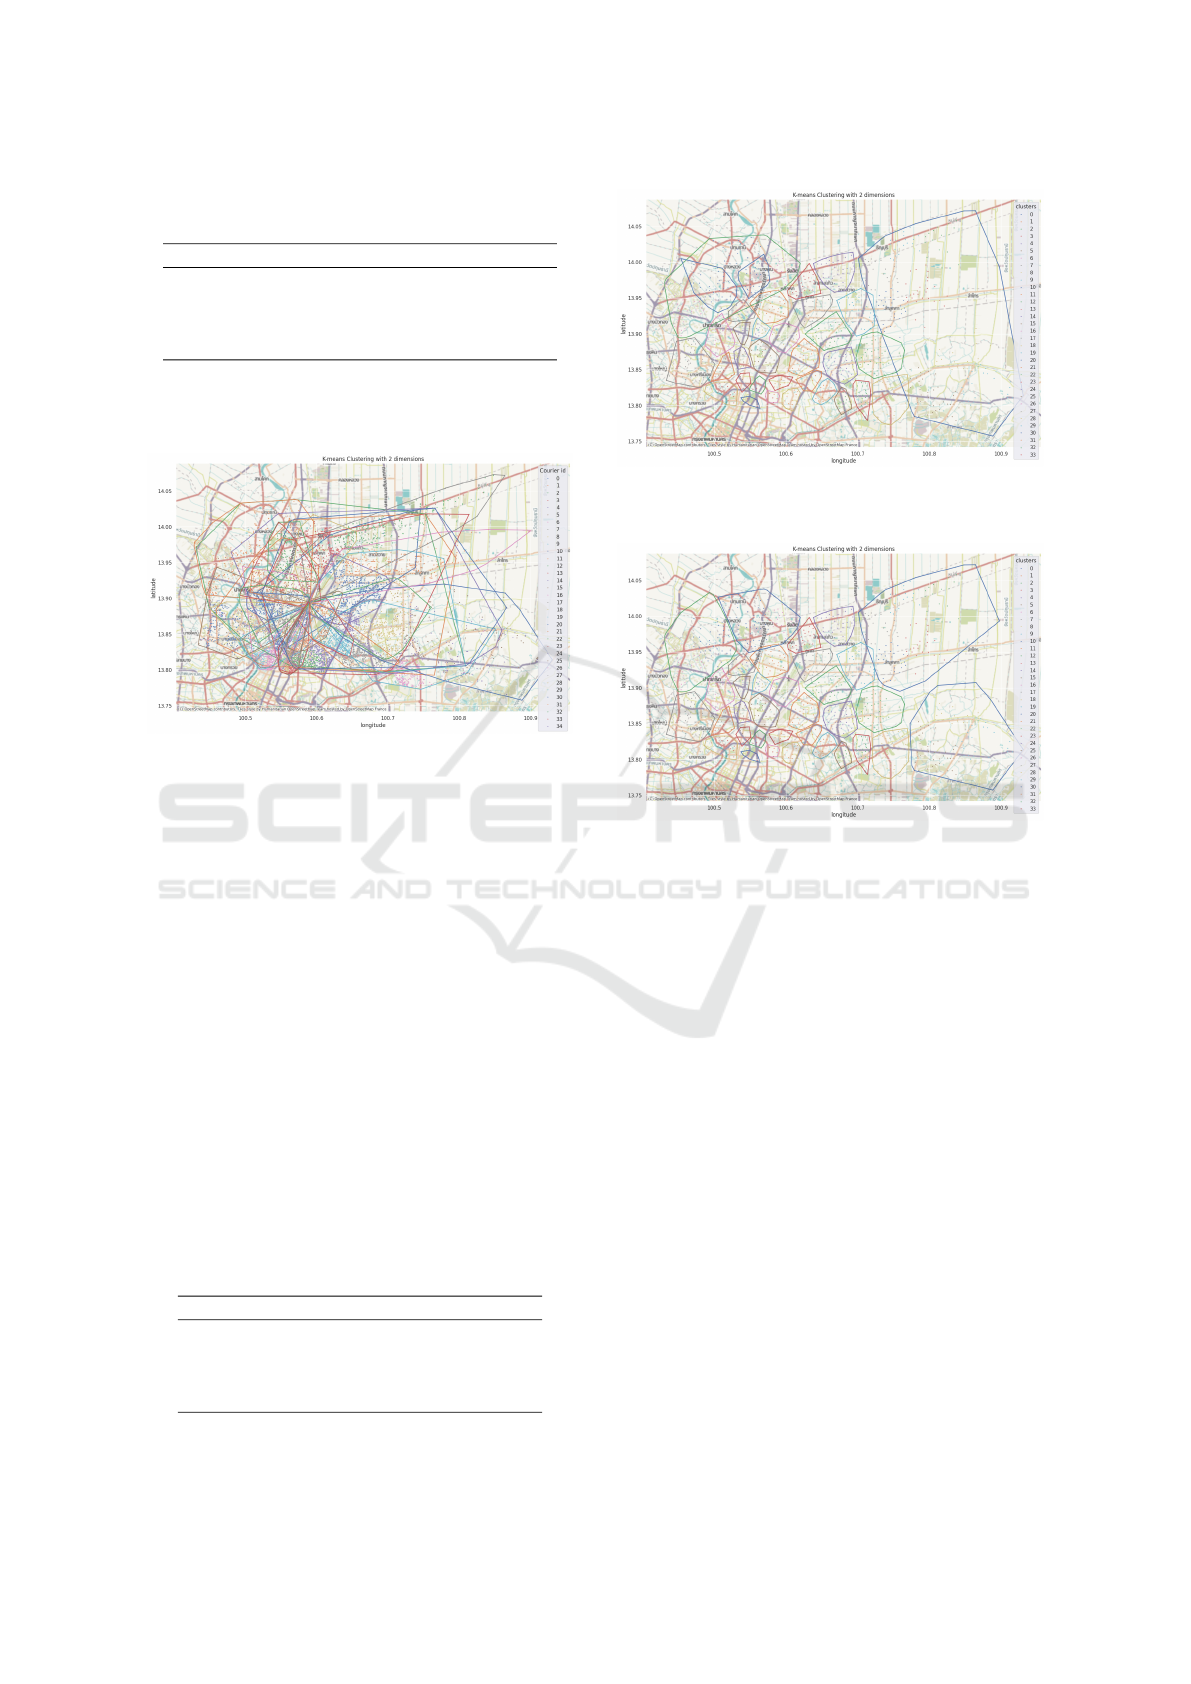
Table 6: Slope of driver’s workload (capacity) in each iter-
ation.
The number of times for re-clustering Slope
Original zone 34.03
K-Mean clustering 63.58
Re-clustering 1 33.78
Re-clustering 2 27.66
4.4 Zoning Analysis
Figure 6: Original Zone of Drivers.
Figure 6 showcases the original zone assignments for
delivery driver, highlighting issues such as overlap-
ping areas. These overlaps can lead to inefficiencies
in delivery operations, including redundant routes, in-
creased travel times and potential confusion over de-
livery responsibility.
In contrast, Figure 7 displays the outcome of the
algorithm with travel distance parameter. This con-
figuration provides new delivery areas with improve-
ments on workload balance. However, with the visual
observation, the area in the top left still encompasses
two smaller zones within a larger one. These group
of zones are required to have another re-clustering at-
tempt. Additionally, the zone on the right remains
quite large, potentially requires another re-clustering
attempt.
For the top left zones, we can categorize these
zones as under-zone and the large right zone as an
over-zone. Figure 8 illustrates the outcomes of this
Table 7: The number of delivery in clusters from re-new
clustering.
The zones the number of delivery points
Top left1 824
Top left2 1125
Big right1 949
Big right2 491
Figure 7: Partition zone obtained by the algorithm and dis-
tance parameter.
Figure 8: Final workload balance zone.
re-clustering attempt while Table 7 lists the delivery
points for the new clusters. The result zones have
been improved as the right large zone is split into two
smaller zones. Similarly, the top left area, which ini-
tially comprised three overlapping zones, has been re-
designed into two zones. This adjustment not only
reduces overlap but also ensures that the workload is
more evenly spread.
5 CONCLUSIONS AND FUTURE
WORK
This study introduces a two-phase algorithm designed
to strategically zone urban delivery area, with the
primary goal of achieving a balanced distribution of
driver workloads. The methodology combines the use
of a clustering algorithm with quartiles to systemati-
cally organize delivery points into efficiently manage-
able zones. This study investigates the effect of the
algorithm when using geographic coordinates and the
travel distance to ensure that the result is practical and
reflective of real-world delivery logistics.
As we show in the study, the algorithm practically
SIMULTECH 2024 - 14th International Conference on Simulation and Modeling Methodologies, Technologies and Applications
384

improve the delivery zones by removing overlapping
areas. Re-clustering procedure can also applied to
make more equitable workload, comparing to a sim-
ple clustering method. Thus, this enhancement refines
the cluster to ensure that the workload is less varied
among drivers.
Future research from this study should concentrate
on the dynamic of daily delivery operations within
the predetermined zones. The challenge of effectively
assigning delivery points to drivers on a daily basis,
while ensuring an equitable distribution of workload,
is central to optimizing last-mile delivery logistics. A
key aspect of this approach involves the development
of a system capable of intelligently managing deliv-
ery orders, potentially by delaying certain deliveries
to subsequent days. This mechanism would aim to
balance workloads more evenly across adjacent days,
addressing the variability in daily delivery demands.
ACKNOWLEDGEMENTS
This research is supported by Development and Pro-
motion of Science and Technology Talents Project
Scholarship and the Department of Mathematics, Fac-
ulty of Science, Mahidol University, Thailand.
REFERENCES
Afsar, H. M., Afsar, S., and Palacios, J. J. (2021). Vehi-
cle routing problem with zone-based pricing. Trans-
portation Research Part E: Logistics and Transporta-
tion Review, 152:102383.
Bruni, M. E., Fadda, E., Fedorov, S., and Perboli, G. (2023).
A machine learning optimization approach for last-
mile delivery and third-party logistics. Computers &
Operations Research, 157:106262.
Demir, E., Syntetos, A., and van Woensel, T. (2022). Last
mile logistics: Research trends and needs. IMA Jour-
nal of Management Mathematics, 33(4):549–561.
El Ouadi, J., Malhene, N., Benhadou, S., and Medromi, H.
(2022). Towards a machine-learning based approach
for splitting cities in freight logistics context: Bench-
marks of clustering and prediction models. Computers
& Industrial Engineering, 166:107975.
Hartigan, J. A. (1975). Clustering Algorithms. John Wiley
& Sons, Inc., USA, 99th edition.
Jabbari, A., Tommelein, I. D., and Kaminsky, P. M.
(2020). Workload leveling based on work space zon-
ing for takt planning. Automation in Construction,
118:103223.
Kerdprasop, K., Kerdprasop, N., and Sattayatham, P.
(2005). Weighted k-means for density-biased clus-
tering. In Tjoa, A. M. and Trujillo, J., editors, Data
Warehousing and Knowledge Discovery, pages 488–
497, Berlin, Heidelberg. Springer Berlin Heidelberg.
LI, J., Fang, Y., and Tang, N. (2022). A cluster-based opti-
mization framework for vehicle routing problem with
workload balance. Computers & Industrial Engineer-
ing, 169:108221.
Lorenzo-Espejo, A., Mu
˜
nuzuri, J., Onieva, L., and Mu
˜
noz-
D
´
ıaz, M.-L. (2023). A study on the correlation of
workload and distance with the success of last mile
logistics. In Garc
´
ıa M
´
arquez, F. P., Segovia Ram
´
ırez,
I., Bernalte S
´
anchez, P. J., and Mu
˜
noz del R
´
ıo, A., ed-
itors, IoT and Data Science in Engineering Manage-
ment, pages 315–320, Cham. Springer International
Publishing.
Moreno-Saavedra, L. M., Jim
´
enez-Fern
´
andez, S., Portilla-
Figueras, J. A., Casillas-P
´
erez, D., and Salcedo-Sanz,
S. (2024). A multi-algorithm approach for operational
human resources workload balancing in a last mile ur-
ban delivery system. Computers & Operations Re-
search, 163:106516.
Muhammad, Y., Achmad, N., Suswanta, and Rehman, A.
(2023). Analyzing delivery area/zone tagging tech-
niques within fulfillment centres for last mile delivery
orders. Journal of World Science, Volume 2 No.7 July
2023.
Ouadi, J. E., Malhene, N., Benhadou, S., and Medromi, H.
(2020). Strategic zoning approach for urban areas: to-
wards a shared transportation system. Procedia Com-
puter Science, 170:211–218.
Pedersen, C. B., Rosenkrands, K., Sung, I., and Nielsen,
P. (2022). Systemic performance analysis on zon-
ing for unmanned aerial vehicle-based service deliv-
ery. Drones, 6(7).
Prajapati, D., Harish, A. R., Daultani, Y., Singh, H., and
Pratap, S. (2023). A clustering based routing heuris-
tic for last-mile logistics in fresh food e-commerce.
Global Business Review, 24(1):7–20.
S.H. Huanga, Y. H. (2023). A new hybrid algorithm for
solving the vehicle routing problem with route balanc-
ing. International Journal of Industrial Engineering
and Management, 14:51–62.
Shi, Y., Liu, W., and Zhou, Y. (2023). An adap-
tive large neighborhood search based approach for
the vehicle routing problem with zone-based pric-
ing. Engineering Applications of Artificial Intelli-
gence, 124:106506.
Wang, Y., Zhao, L., Savelsbergh, M., and Wu, S. (2022).
Multi-period workload balancing in last-mile urban
delivery. Transportation Science, 56.
Zhao, H., Jiang, X., Gu, B., and Wang, K. (2022). Evalu-
ation and functional zoning of the ecological environ-
ment in urban space—a case study of taizhou, china.
Sustainability, 14(11).
Delivery Zones Partitioning Considering Workload Balance Using Clustering Algorithm
385
