
Twitter Metrical Data Analysis Using R: Twiplomacy in the
Outbreak of the War in Ukraine
Dimitrios Vagianos
a
and Thomas Papatsas
b
Department of International and European Studies, University of Macedonia, Egnatia 156, Thessaloniki, Greece
Keywords: The Russian-Ukrainian War, Social Networking Analysis, Data Analysis, Content Analysis, Interactivity
Networks.
Abstract: It is common practice for Social Media to be used to inform and sway public opinion during contemporary
conflicts. This study focuses on how Twitter (now known as X) was used with regards to the Russian-
Ukrainian war during the first three months following Russia's invasion of Ukraine on February 24, 2022.
Thirty accounts in total—fifteen from each opposing side—were used to mine the data. The information
released by these accounts throughout this monitoring period, along with the frequency of their postings, were
collected and investigated in order to highlight the diverse approaches in this kind of cyberspace confrontation.
In order to emphasize the key components of each party's strategy and its efficacy, the interactivity networks
of the accounts under discussion were constructed and visually analysed. Overall, this research attempt
exploits a combination of effective data analysis approaches including word frequencies’ investigation and
interactivity networks analysis based on the modularity community detection algorithm. By exclusively using
Open Source software, the results visually highlight the degree of coordination and intensity of Twitter use
of the Ukrainian side, a fact that is in full accordance with the comparatively more successful induced
influence Ukraine achieved during this time frame, as this has been reported by the media generally.
1 INTRODUCTION
The full-scale Russian invasion of Ukraine on
February 24, 2022, was the most momentous
development in the Russian-Ukrainian war since the
annexation of Crimea in 2014. This invasion, with
state and non-state actors meddling with the
information stored or transmitted, has been called the
first totalitarian Social Media war, or alternatively,
the first totalitarian cyber war and the first hacker
war.
It was obvious that both sides would take
advantage of the participatory Internet's enormous
capacity to launch public awareness campaigns and,
eventually, carry out their military goals (Smith,
2019). Social Media gave Ukraine the means to share
disjointed information about how the war was fought,
which in turn gave Internet users all around the world
a mosaic of informational data, establishing, at the
same time, the framework for requesting outer
assistance. On the other hand, Social Media was seen
a
https://orcid.org/0000-0001-6932-1513
b
https://orcid.org/0009-0008-9161-0416
by Russia as an additional medium for shaping and
disseminating the idealized narrative of the conflict.
Ukraine presented the incident as a brutal act of
war in general, portraying Russia as the aggressor
breaking international law and Ukraine as the
defendant attempting to reclaim the area that the
invader had taken. Nonetheless, Russia claimed that
the events were a deliberate military action to liberate
a Russian minority that had been "imprisoned" in the
Donetsk and Luhansk regions of Ukraine (Al Jazeera,
2022).
This study analyzes data from the
communications patterns spread worldwide by both
parties on Twitter (now known as X), a social
networking site with 432 million monthly active users
as of 2022 (Dixon, 2022), using open source software
packages. Twitter has always been a widely used
platform for deploying politics and diplomacy
(Twiplomacy) worldwide. By using data analysis
techniques as well as statistics, the study's goals were
to analyze the spoken communications exchanged
494
Vagianos, D. and Papatsas, T.
Twitter Metrical Data Analysis Using R: Twiplomacy in the Outbreak of the War in Ukraine.
DOI: 10.5220/0012812400003756
Paper published under CC license (CC BY-NC-ND 4.0)
In Proceedings of the 13th International Conference on Data Science, Technology and Applications (DATA 2024), pages 494-504
ISBN: 978-989-758-707-8; ISSN: 2184-285X
Proceedings Copyright © 2024 by SCITEPRESS – Science and Technology Publications, Lda.

during the three months that followed Russia's
invasion of Ukraine on February 24, 2022, to
document the tactics used by both sides as well as the
degree of coordination in the way that different
accounts used the platform, and, lastly, to assess how
successful each side was in electronic diplomacy over
this field of confrontation.
2 RELATED WORK
Throughout their nearly two decades in cyberspace,
Social Media have been utilized to investigate social
concerns through the application of techniques from
the ever developing data science field. Furthermore,
a well-liked natural language processing (NLP)
method that academics have employed in a variety of
fields is content analysis. The method is frequently
applied in studies on Twitter because of the platform's
nature as a microblogging service.
Younis, for instance, employed the 'afinn'
dictionary approach to determine people's opinions
about data obtained from Twitter about two UK stores
(Asda and Tesco) over the 2014 Christmas season
(Younis, 2015). Similar text processing on Twitter
data were applied by Kabir et al. using R (Kabir et al.,
2018). By tracking word usage rates, they
demonstrated how positive and negative words
influenced respondents' overall sentiment in a variety
of qualitative surveys by using R over Twitter data.
Arun et al. analyzed tweets in India that discussed
people's opinions regarding the delegitimization
process using the Bing dictionary technique (Arun et
al., 2017). Saini et al. (2019) employed a similar
technique of categorizing impact of tweets
concerning healthcare and illnesses into ten groups
using the "nrc" lexicon.
Furthermore, R Studio and Gephi have shown to
be outstanding resources for a variety of data science
applications. For instance, Koutsoupias and Mikelis
used R Studio and text mining software to review
international relations materials in order to look for
recurring, related terms (Koutsoupias and Mikelis,
2021). Taking centrality into account when
computing their metrics, Wajahat et al. gathered data
from Netvizz's Facebook API and visualized
Facebook social networks linked to the official CNN
profile page using Gephi (Wajahat et al., 2020). Zhu
et al. conducted content analysis on a Reddit dataset
regarding the Russian-Ukrainian war using R studio
visualization techniques (Zhu et al., 2022). Using data
from the Reddit platform, Hanley et al. examined
Russian media narratives targeted at English-
speaking customers using the MPNet model and a
semantic search algorithm (Hanley et al., 2022).
Using specified keywords and hashtags to track
statistics, Haq et al. examined the text of around 1.6
million tweets obtained via the Twitter API during the
first week of escalation (Haq et al., 2022).
Using a bigger dataset (57.3 million tweets, 7.7
million users), Shevtsov et al. investigated the
frequency of tweets in the Russian-Ukrainian War
(Shevtsov et al., 2022). In an analysis of tweets from
December 31, 2021 to March 3, 2022 of the same war,
Agarwal et al. used the "bing" dictionary. Finally,
Džubur et al. employed the RoBERTa-LSTM
technique for sentiment analysis by studying hashtags
and users. They also mapped semantic, interactivity
networks of various profiles using Gephi for their
network analysis (Džubur et al., 2022).
3 METHODOLOGY
This study focused on the first 3 months after Russia's
invasion of Ukraine. This decision was made because
the situation in Ukraine was totally unstable at the
time, a fact that was reflected by the numerous tweets
that captured the overall tone of hostility. Thirty
Twitter accounts were selected for use, with fifteen
accounts for each country, due to the volume of data
that was accessible. The following criteria were used
to choose the accounts:
i. English written tweets. Tweets written in
Russian or Ukrainian might be directed towards
those who speak those languages, but tweets
written in English undoubtedly target a larger
audience.
ii. The account holder needs to be well-liked on
Twitter and a recognized expert on this conflict.
Politicians were carefully chosen for our sample
along with news media, political analysts,
consultants, ministries, and other prominent
figures with a sizable following basis and
impact.
iii. "Official accounts" or "affiliated media". With
consistent tweets in support of an account,
Twitter labels them as such.
Twitter Metrical Data Analysis Using R: Twiplomacy in the Outbreak of the War in Ukraine
495

Table 1: Selected Ukranian Twitter accounts Study Group.
Account Description
ZelenskyyUa
VolodymyrZelenskyy, President of
Ukraine
Ukraine Official Twitter account of Ukraine
lesiavasylenko Lesia Vasylenko, Ukrainian MP
Denys_Shmyhal
DenysShmyhal, Prime Minister of
Ukraine
StefanishynaO
OlgaStefanishyna, Deputy Prime
Minister of Ukraine
FedorovMykhailo
MykhailoFedorov, Deputy
President of Ukraine
DmytroKuleba
DmytroKuleba, Minister for
Foreign Affairs of Ukraine
oleksiireznikov
OleksiiReznikov, Minister of
Defence of Ukraine
otkachenkoua
TkachenkoOleksandr, Minister for
Culture of Ukraine
Podolyak_M
Advisor to the Office of the
President of Ukraine
NewVoiceUkraine
The top independent English-
lan
g
ua
g
e news in Ukraine
MFA_Ukraine
Official Twitter account of the
Ministry of Foreign Affairs of
Ukraine
SergiyKyslytsya
SergiyKyslytsya, Representative of
Ukraine in the UN
UKRinUN
Official Twitter account for
Mission of Ukraine to the UN
Makeiev
OleksiiMakeiev, Ambassador of
Ukraine in Germany
From the Ukrainian side, the accounts in Table 1
were chosen based on the aforementioned criteria
Table 2: Selected Russian Twitter accounts Study Group.
Account Descri
p
tion
mfa_russia
Official Twitter account of the
Ministry of Foreign Affairs of
Russia
Russia
Official Twitter account of the
Russian Federation
KremlinRussia_E
Official Kremlin news from the
President of Russia
GovernmentRF
Official news of the Prime Minister
& the Russian Government
MID_Kaliningrad
Official Twitter account of the
Dele
g
ate in Kalinin
g
ra
d
MedvedevRussiaE
DmitryMedvedev, Deputy
Chairman of the Security Council of
Russia
mod_russia
Official Twitter account of the
Russian Ministry of Defence
DnKornev
Russian military journalist and
b
logger in English
Amb_Ulyanov
MikhailUlyanov, Official
Re
p
resentative of Russia in Vienna
Dpol_un
DmitryPolyanskiy, Official
Re
p
resentative of Russia to the UN
A__Alimov
AlexanderAlimov, Official
Representative of Russia to the UN
RussiaUN
Official Twitter account of the
Russian Mission to the UN
FridrihShow
NadanaFridrikhson, Russian
j
ournalist in En
g
lish
RusMission_EU
Official Twitter account of the
Russian Mission to the EU
politblogme
MariaDubovikova, Russian
j
ournalist and anal
y
st in En
g
lish
The Russian side's accounts were chosen based on
the same standards (Table 2). It can be seen even at
this early stage of the investigation that relatively
more members of the Ukrainian presidential cabinet
had Twitter accounts. This pattern became more
noticeable when the study's scope was later expanded
to cover a larger spectrum of government personnel.
It should be mentioned that these accounts usually
tweeted in English even prior to the events of 2022. It
was more difficult to find Russian presidential office
officials—including Russian President Vladimir
Putin—who tweeted in English because many of
them either posted only in Russian or had no Twitter
account at all. Rather, Vladimir Putin seems to be in
charge of two accounts, "KremlinRussia" (which
tweets in Russian) and "KremlinRussia_E" (which
tweets in English), which function in tandem with the
profile of the president of Ukraine. Upon initial
observation, it was also noted that other Russian
government figures with profiles in both Russian and
English, shared information more often in English
than in Russian.
Lastly, this study focused on two sets of accounts:
collaborative journalists participating in the Russian-
Ukrainian war, as well as a variety of political
entities. Although these entities might not have
attended any of the focus groups, this initial selection
helped uncover more Twitter accounts owned by
significant figures engaged in the conflict. Finally,
since the time required to run these programs'
calculations grows exponentially with the amount of
input data, it was possible to conduct the
mathematical calculations with the available software
and equipment in reasonable time by keeping the
study's sample size limited to these thirty profiles.
Open source software was used for this
investigation. R Studio was the primary application
utilized because of its ease of use, data mining
capabilities and statistical calculations (Kumar and
Paul, 2016).
Table 3 lists the extra packages that were used
along with their purposes. Using a Twitter account,
DATA 2024 - 13th International Conference on Data Science, Technology and Applications
496

developer account permissions were granted in order
to get the datasets for analysis from the Twitter
platform using the “rtweet” package. The search
results were restricted to the designated time frame.
An open source network visualization tool named
Gephi was also utilized (Bastian et al., 2009), which
allowed for the mapping of the interactivity network
between the chosen accounts and the identification of
the most significant nodes, based on how frequently
they appeared in tweets.
Table 3: Selected R Studio packages.
Package Description
rtweet a Main data minin
g
tool from Twitte
r
tidyverse
Set of functions for graphing and
data processing
tm
Natural language text mining
functions
(
nl
)
dply
r
Data manipulation functions
TSstudio Time series visualisation functions
forestmangr
Functions for data frames and
calculations
ggplot2
Functions for creating customized
g
ra
p
hs
3.1 Tweets’ Text Analysis
Using the R Studio "tm" package, Twitter posts were
converted into .txt files to make it feasible for
unnecessary data to be removed (Feinerer et al.,
2008). The following ensuing interventions were
executed:
i. All uppercase characters were changed into
lowercase, due to the software's sensitivity to
this issue.
ii. All non-English terms found in the tweets from
the chosen accounts were disregarded in this
analysis.
iii. Punctuation marks such dots, commas,
exclamation points, etc. were removed from the
texts under study.
iv. Numbers were removed from the analysis. They
were only taken into account when they
contained crucial information in combination
with nearby words. For instance, the number
"170" is semantically useless but when paired
with the words "casualties" or "refugees," it
might provide important information.
v. Symbols like €, £, TM, ", â, /, @, ®, _, -, and
others that were present in emojis, hyperlinks
etc. were eliminated. In order to achieve this, a
function in R was developed to change these
superfluous symbols into spaces, which were
subsequently removed.
vi. Prepositions, conjunctions, Emojis, Cyrillic
sentences and numbers made up the majority of
the words that were eliminated.
vii. Terms with comparable meanings were grouped
together without using any dictionary. For
instance, the terms "ukrainian," "ukrainians,"
and "ukraines," were transformed into "ukraine"
in a manner similar to that of symbols;
conversely, the words "neonazi," "neonazis,"
"nazism," "nationalists," and "azov" were
converted to "nazi," and so forth (depending on
their meaning). By converting these terms, the
software accurately categorized the words rather
than breaking them up into smaller groupings.
Multiword expressions and word embeddings
were not considered in this approach.
viii. Since the gaps had no bearing on the text, they
were removed.
To determine the minimal frequency of word
occurrence, the revised text was used. By converting
the text files into a tabular format and presenting the
term in one column and its frequency in the adjacent
column, the words were summed up in two columns.
These tables were sorted in decreasing order using the
"ggplot2" package, and each country's most frequent
words were displayed as a bar chart that showed the
overall volume and ranking of these words.
3.2 Twitter Interactivity Networks
The next stage was to mine the data required to build
each focus group's interactivity network. Using the
"dplyr" software, two .csv files were made for each
nation (—one containing the connections and the
other containing the nodes). These files were used as
Gephi's input data. Then, in order to build the
interactivity networks in Gephi, the following
parameterizations were applied to guarantee a better
visual presentation and to increase the accuracy of the
computations:
i. Self-loops: A lot of accounts frequently made
self-referential statements or retweeted their
own tweets. As a result, the network nodes' in-
degree weight grew, making them more
significant than they are. These cases ought to
be disregarded.
ii. Network directionality: it was important to
specify the references’ direction.
iii. Nodes were scaled by the weight of the
weighted in-degree references: this allowed
for identifying significant nodes (Ayyappan et
al., 2016).
Twitter Metrical Data Analysis Using R: Twiplomacy in the Outbreak of the War in Ukraine
497
iv. The modularity community detection algorithm
was used to highlight the accounts’ communities
in the networks, based on their connections
(Newman, 2006).
v. Yifan Hu network creation: this method
highlighted the important central accounts in the
network and allowed for its effective and clear
visualization (Hu, 2004).
vi. Each network's visualisation was done in two
stages, which guaranteed that the interactivity
networks would be effectively visualized. The
labels of the fifteen selected profiles remained
after the first stage, which involved the removal
of nodes with a single incoming reference (in-
degree=1). The visible accounts and the labels
of the accounts with the highest degree of
incoming references were plotted in the second
stage, after the labels displayed in the first stage
were hidden and the filter was increased by one
(2 ≤ in-degree).
Four schemes were developed, two for each focus
group, using these criteria.
4 APPLICATION OF THE
METHOD AND EXTRACTION
OF RESULTS
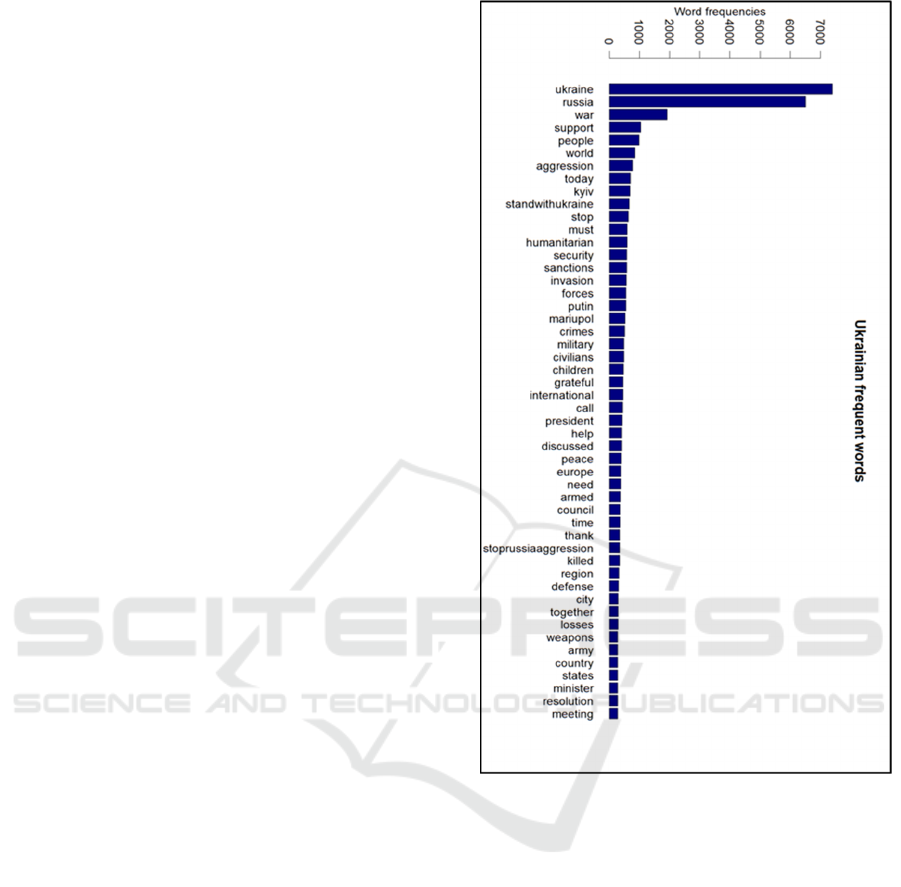
The first significant finding in this research was that
there were fewer tweets by the Russian side during
the analysis period. Specifically, the Ukrainian side
released twenty-five percent more content. The top 50
terms used on each side during these posts are shown
in Figures 1 and 2.
It can be observed that terms like "war,"
"support," "world," "aggression" of the opposing
side, "Kiev," and appeals for assistance to
"standwithukraine" are among the top ten terms used
on the Ukrainian side. 'War' was the third most
frequent term.
From this observation, one can conclude that
Ukraine's posts aim to inform and sensitize the world
by emphasizing the aggression of the invader and
therefore make direct or indirect appeals for support
by the international community.
Comparably, "Nazi" is the third most used word
in Russia's top ten list of words, which also includes
"military," "war," "Kiev," and "civilians" (Figure 2).
The latter provides a clear image of the Russian side's
communication strategy regarding the reasons behind
the invasion, as evidenced by the tweets it posted.
Figure 1: 50 Most frequently used words in the tweets of
the Ukrainian side.
In Figure 1, one can see that the Ukrainian side
utilizes phrases with a warlike meaning, such as
"invasion," "defence," "forces," "peace," "killed,"
"crimes," and "children," in order to incite animosity
toward the aggressor. Additionally, the terms
"resolution," "sanctions," and "meeting" signal to the
global community that action is needed.
Geographically speaking, the terms Mariupol and
Kiev feature prominently on the list; references to
Europe are also common, either in regard to their
potential support or their role in mediating the crisis.
In an effort to start movements in favor of Ukraine,
the hashtags "stoprussiaaggression" and
"standwithukraine," which rank 10th and 11th
respectively, were also widely used. Specifically, on
February 25, 2022, the hashtag "standwithukraine" was
included in over 40000 tweets (GetDayTrends, 2022).
DATA 2024 - 13th International Conference on Data Science, Technology and Applications
498
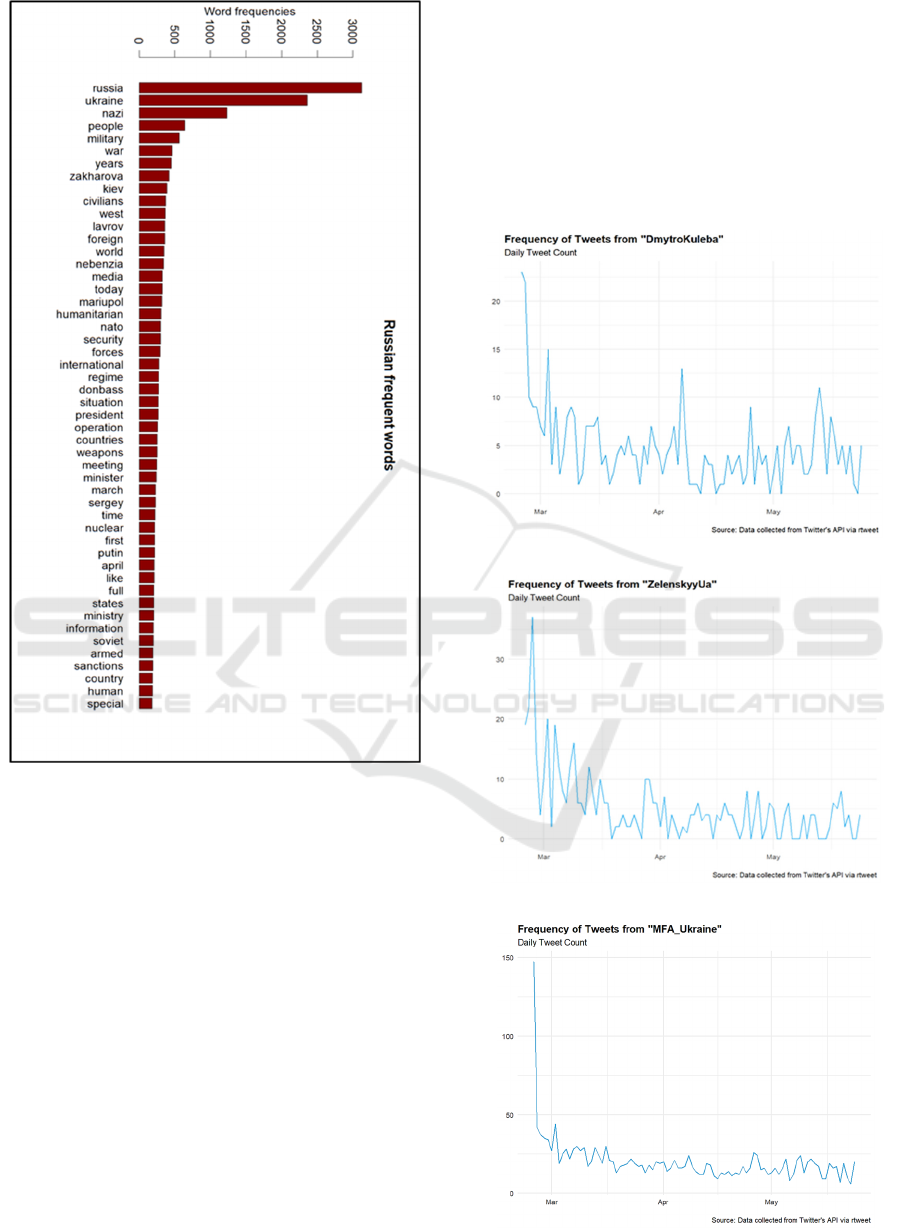
Figure 2: 50 Most frequently used words in the tweets of
the Russian side.
One may observe that there are differences in the
subject areas and style by comparing Figures 1 and 2.
"West" was the eleventh most frequently used word,
highlighting Russia's position on the political front
established by the West. Political terms and names
like "Putin", "Lavrov", "Zakharova", "Nebenzia", and
"Sergey" are used in large groups of tweets, along
with terms like "international", "countries", "states",
and "NATO". This shows how the Russian side uses
Twitter for news, information, and e-diplomacy.
Additionally, the descriptions of the events are given
a more official colour by the terms "operations,"
"security," "situation," "civilians," and
"humanitarian," which contrasts sharply with how the
opposite belligerent side makes these same
descriptions. The towns of Mariupol and Kiev are the
most commonly stated geographical regions here,
although "Donbass" has also continued to be
mentioned regularly, presumably as a result of the
events that occurred there. Generally speaking, the
Russian side uses more words related to a wider range
of mostly informative content, whereas the Ukrainian
side alternates between political and humanitarian
news and war narratives with a specific colour tone.
The official “DmytroKuleba” account of the
Minister for Foreign Affairs of Ukraine, the official
“ZelenskyyUa” account of President Volodymyr
(a)
(b)
(c)
Twitter Metrical Data Analysis Using R: Twiplomacy in the Outbreak of the War in Ukraine
499
(d)
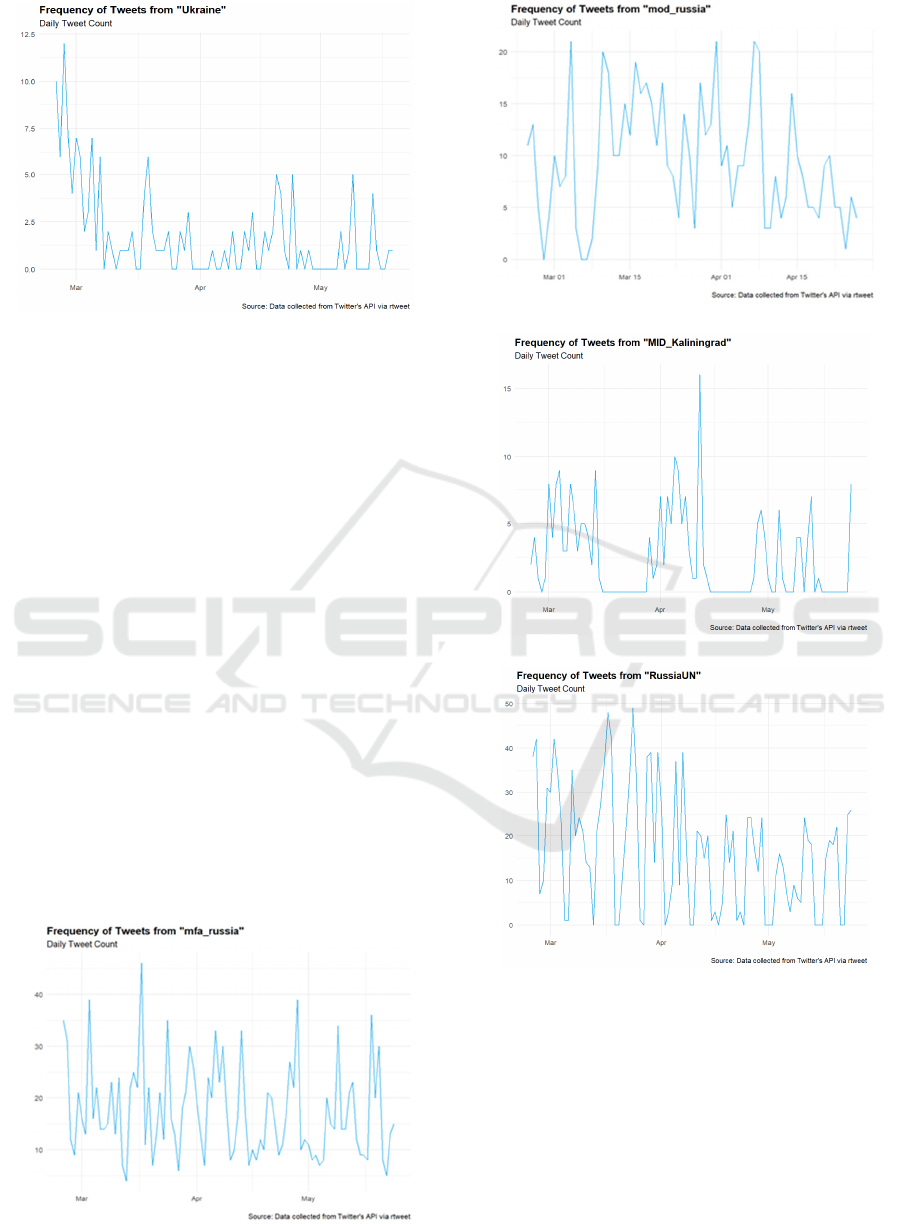
Figure 3: Frequency of posts from 4 selected Ukrainian
Twitter accounts.
Zelenskyy of Ukraine, the official “MFA_Ukraine”
account of the Ministry of Foreign Affairs of Ukraine,
and the “Ukraine” account, correspond to the four
charts of Figure 3 that indicate the frequencies and
total posts of four representative accounts of the
Ukrainian side during the period under review. The
four charts highlight the high activity in the initial
days of the invasion as well as the constant high
frequency of posts in this time frame. Furthermore,
the four accounts' variance lines visually exhibit
qualitative similarities, indicating a probable
coordination in their activities and, as a result, a
methodical posting strategy.
The four charts in Figure 4 depict the indicative
frequencies and total posts of four representative
Russian side accounts during the same period: the
Russian Ministry of Foreign Affairs' “mfa_russia”
account, the Ministry of Defense's “mod_russia”
account, the Representative's “MID_Kaliningrad”
account, and the Russian Mission to the UN's
“RussiaUN” account. Comparing the four charts, it
(a)
(b)
(c)
(d)
Figure 4: Frequency of posts from 4 selected Russian
Twitter accounts.
can be noted that the frequency of posts is lower than
the ones on the Ukrainian side. Thus, this quantitative
approach demonstrates that the Ukrainian side's
engagement has been more rigorous as well as more
intensive, which is consistent with the greater
influence that Ukraine appears to have had—both
during and after the invasion—on Social Media, a fact
that has also been reported by the media generally.
DATA 2024 - 13th International Conference on Data Science, Technology and Applications
500
Note that the four charts of figure 4 have the
maximum qualitative similarity of their curve, much
like the four charts of figure 3 that were selected to be
given here. The frequency of articles varies
significantly amongst the 15 Russian accounts,
perhaps because of the relatively poor level of
coordination between the political and journalistic
organizations managing these accounts. On the other
hand, Ukrainian account holders exhibit a stronger
link with respect to a widely recognized pattern of
posting rate, topic selection, and even word choice in
terms of posts throughout this time frame.
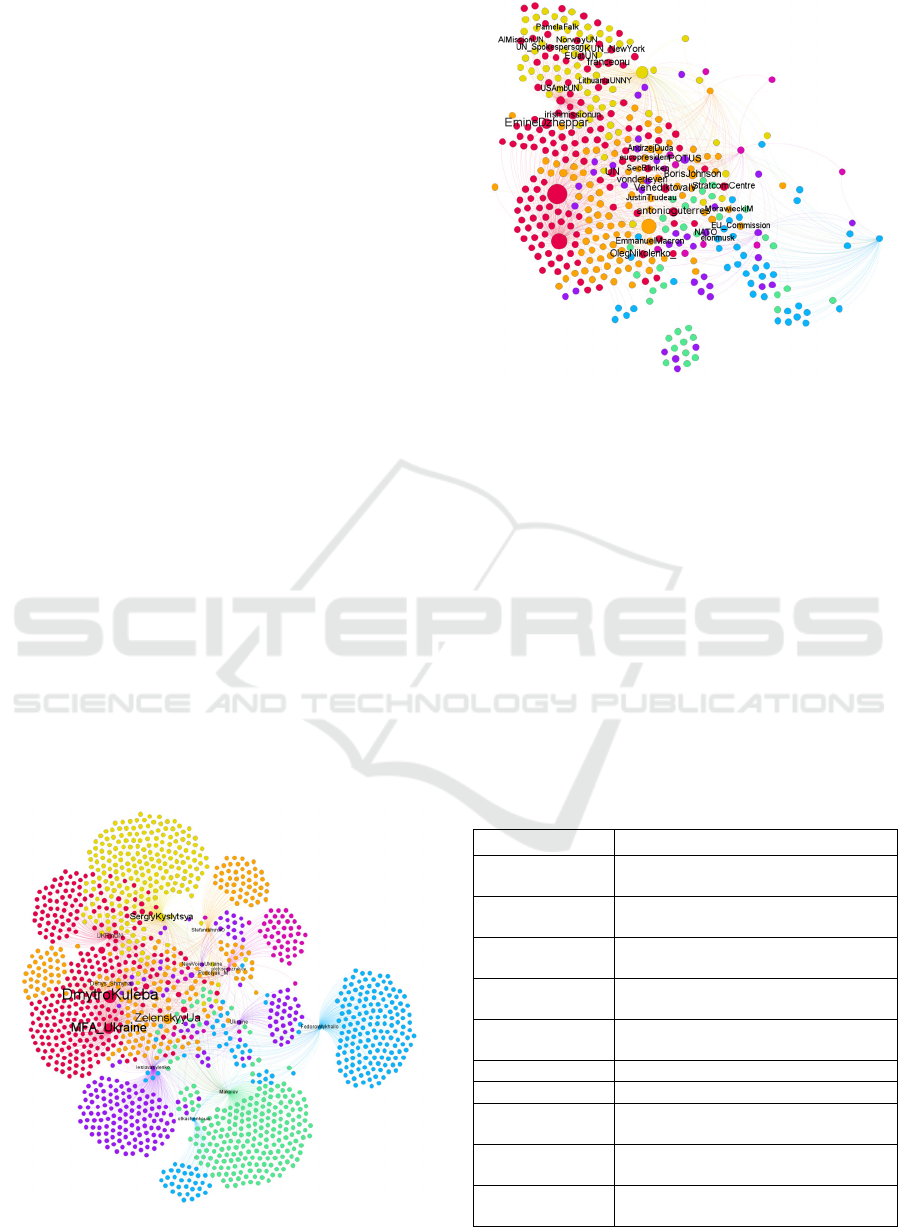
The interactivity network graphs of the Ukrainian
group's first and second stage accounts, as previously
mentioned in the research methodology (modularity
detection algorithm), are displayed in figures 5 and 6.
The first stage figure 5 shows that the largest and most
concentrated nodes of the account network were
"DmytroKuleba", "MFA_Ukraine", and
"ZelenskyyUa" based on the interactions and their
content. The first two are red, indicating that they are
part of the same community, and this is always the
case based on the modularity detection algorithm that
was used. Given that Kuleba is the Ukraine's foreign
minister, this appears to support the algorithm's
accuracy. Conversely, the accounts
"FedorovMykhailo","otkachenkoua", and "Makeiev"
appear to have the most dissimilar profiles with their
common references and indicated communities, even
if they are all governmental accounts. The network
exhibits consistency in terms of content and
relationships, as seen by the other accounts that were
noticed and looked to be key to it. They also appeared
to be located close to one another.
Figure 5: 1st Stage interactivity network of Ukrainian side
accounts.
Figure 6: 2
nd
Stage interactivity network of Ukrainian side
accounts.
This research focused on the accounts that were not
highlighted in the first stage and displayed the most
significant Twitter accounts (Table 4) based on
content and the quantity of incoming mentions in the
stage 2 interactivity network (Figure 5). Thus, two
clusters are formed. While the second was directed at
nation-state leaders and the European Union, the first
was focused on the United Nations. The first group
appeared to represent the culmination of two
communities: one associated with international
affairs (red) and one with the UN (yellow). In the
second, several communities were combined and
given a central position inside the network.
Table 4: Accounts highlighted during the creation of the
2nd stage of the Ukrainian side's interactivity network.
Screen name
Description
POTUS
Joe Biden, President of the United
States
BorisJohnson
Boris Johnson, Prime Minister of the
United Kingdom
VenediktovalV
Ambassador of Ukraine to the Swiss
Confederation
SecBlinken
Anthony Blinken, Secretary of State
of the United States
eucopresident
Charles Michel, President of the
European Council
UN
Official account of the United Nations
AndrzejDuda
Andrzej Duda, President of Poland
NATO
Official account of the North Atlantic
Treaty Organisation
antonioguterres
António Guterres, Secretary
General of the United Nations
EU_Commission
Official account of the European
Commission
Twitter Metrical Data Analysis Using R: Twiplomacy in the Outbreak of the War in Ukraine
501
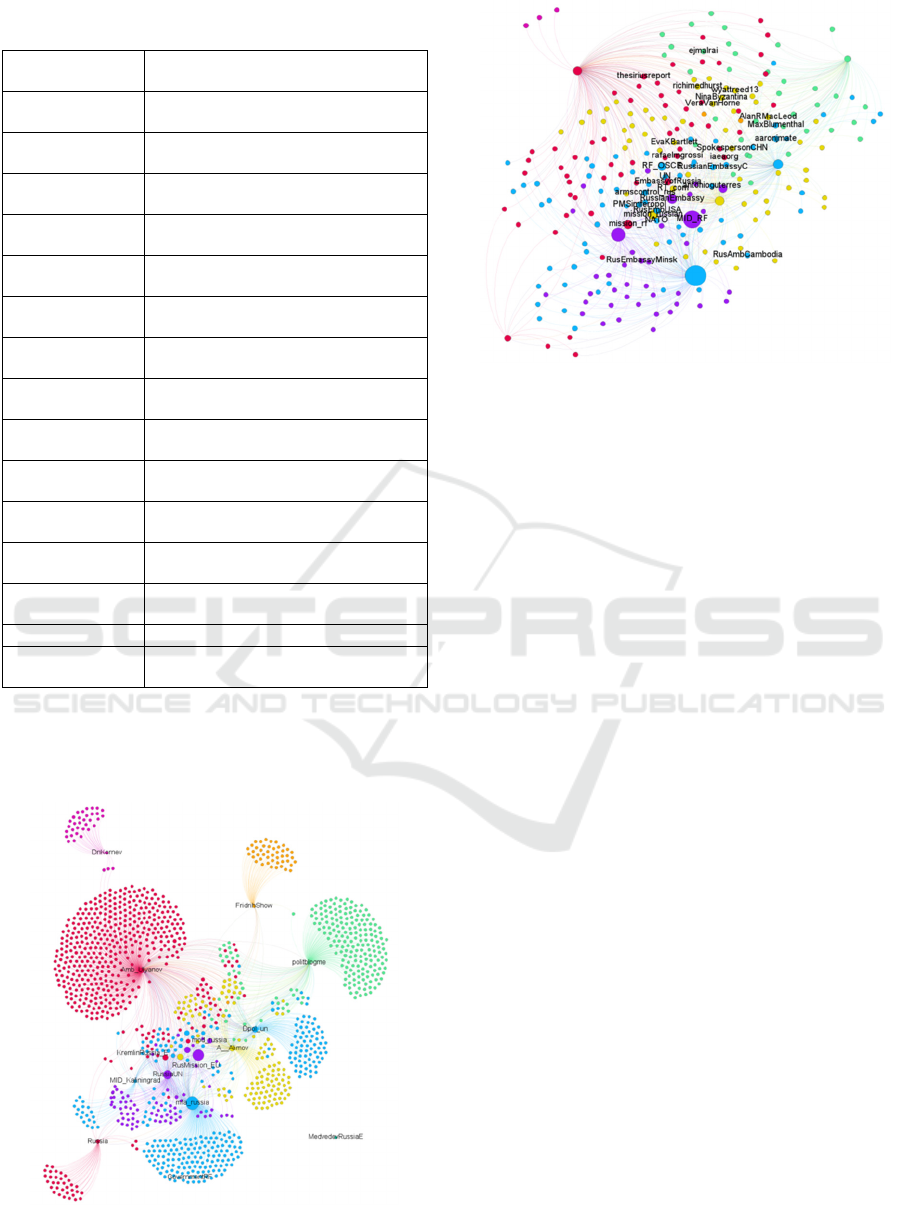
Table 4: Accounts highlighted during the creation of the 2n
d
stage of the Ukrainian side's interactivity network(cont.).
vonderleyen
Ursula Von Der Leyen, President of
the European Commission
MorawieckiM
Mateusz Morawiecki, Prime Minister
of Polan
d
JustinTrudeau
JustinTrudeau, Prime Minister of
Canada
OlegNikolenko_
Spokesman of the Ministry of
Foreign Affairs of Ukraine
UKUN_NewYork
Official account of the United
Kingdom's UN office in New Yor
k
EmineDzeppar
First Deputy Foreign Minister of
Ukraine
AlMissionUN
Albania's official account in the
United Nations in New Yor
k
irishmissionun
Ireland's official account in the
United Nations in New Yor
k
USambUN
US Ambassador Linda Thomas-
Greenfield to the UN
LithuaniaUNNY
Lithuania's official account in the
United Nations in New Yor
k
UNspokesperson
Official account of the Secretary
General Office of the UN
NorwayUN
Norway's official account in the
United Nations in New Yor
k
EUatUN
Delegation of the European Union in
the UN in New Yor
k
franceonu
France official account in the United
Nations in New Yor
k
elonmus
k
Εlon Μusk, Entrepreneur and investor
UNspokesperson
Official account of the Secretary
General Office of the UN
The interactivity networks for the Russian group's
first and second stage accounts are displayed in
figures 7 and 8.
Figure 7: 1
st
Stage interactivity network of Russian side
accounts.
Figure 8: 2
nd
Stage interactivity network of Russian side
accounts.
The network is noticeably less compact in the
first stage figure 7, with many of the observed
accounts situated far from the centre and forming
their own communities. Unexpectedly,
"MedvedevRussiaE" is the most estranged account; it
has no connections to the entire interactivity network
and no relevant community. Being "satellites" to the
main network, the "DnKornev," "FridrihShow," and
"politblogme" accounts have their own communities,
while the "Russia" account is not particularly
connected to the other profiles (bottom left of the
graph of Figure 7). Despite being a part of a huge
community, the "GovernmentRF" account is not
regarded as a significant node in that network. The
network's core is made up of the other accounts, with
"Amb_Ulyanov" displaying a sizable community and
several connections to other accounts.
The most significant accounts that surfaced
(Table 5) once more established two clusters in the
Russian second stage interactivity network (Figure 8).
With independent or state journalists, the first was
focused on journalism, and the second was focused
on international affairs through embassies.
Because of its central location in the original
interactivity network, the second community was a
composite of several dispersed communities, while
the first partially contained three communities (green,
yellow, and red). Furthermore, two prominent profile
accounts regarding the International Atomic Energy
Agency were noted in the centre ("iaeaorg" and
"rafaelmgrossi"). Their presence in this network can
be correlated with the content analysis of the posts,
since "nuclear" was one of the most frequently used
terms in the Russian group (Figure 2).
DATA 2024 - 13th International Conference on Data Science, Technology and Applications
502

Table 5: Accounts highlighted during the creation of the
2nd stage of the Ukrainian side's interactivity network.
Screen name Description
ejmalrai Journalist, war correspondent in
Asia
thesiriusreport Independent International
Relations Anal
y
sts
rihimedhurst Syro-British freelance journalist
wyattreed13 Russian war correspondent
NinaByzantina Russian journalist and international
relations anal
y
st
VeraVanHorne Russian-Canadian journalist
AlanRMcleod Independent Journalist at
"MintPressNews"
MaxBlumenthal Independent journalist of
"TheGre
y
Zonenews"
aaronjmate Journalist and Podcaster at "The
Grey Zone news"
EvaKBarlett Independent journalist in Donbas
SpokespersonCHN FA Assistant Minister and
representative of China
iaeaorg International Atomic Energy
A
g
enc
y
(
IAEA
)
rafaelmgrossi Director General of the IAEA
RF_OSCE Mission of the Russian Federation
to the OSCE
RussianEmbassyC The Russian Embassy in Canada's
Official Account
EmbassyofRussia The Russian Embassy in South
Africa
armscontrol_rus Negotiations delegation on security
and arms control
RussianEmbassy Official Account of the Russian
Embassy in the UK, London
PMSimferopol Official Account of the Ministry of
Foreign Affairs of Russia in Crimea
RusEmbUSA Official Account of the Russian
Embass
y
in the USA
mission_russian Russian mission to the United
Nations and International
Organizations
MID_RF Official account of the Russian
Forei
g
n Ministr
y
in Grozn
y
RusEmbassyMinsk Official Account of the Russian
Embassy in Belarus
RusAmbCambodia Official Account of the Russian
Embassy in Cambodia
mission_rf Russian delegation to international
or
g
anisations in Vienna
Social Media is well on the way to disrupt the
traditional channels and methods of diplomacy (Pop,
2018). Analysis like the one above demonstrate the
potential of Social Media and online communities in
International Relations, Therefore, the results above
can provide useful information that can be further
scientifically interpreted by IR scientists.
5 CONCLUSIONS AND FUTURE
WORK
The study concentrated on Twitter's impact during the
initial three months following Russia's invasion of
Ukraine. Fifteen official accounts, one from each of
the fighting factions, were chosen as exemplary
examples, and their content and frequency of postings
were analysed using exclusively Open Source
software. The study's findings demonstrated how
successfully Ukraine used Twitter to spread
information and increase awareness by adding words
to content that highlighted the invader’s aggression
and by creating trending hashtags that made direct or
indirect appeals for international support. This
finding coincided with the general media image that
has been shaped during these 3 months and has been
delivered to the international community. News on
politics or humanitarian issues as well as combat
stories were among the Ukrainian themes. However,
Russia employed a wider variety of mostly
informative tweets on Twitter along with service-
oriented content for news, information, and electronic
diplomacy.
In terms of posting frequency, account managers
in Ukraine were found to have demonstrated a faster
pace, improved inter-administrator’s collaboration,
and a more methodical approach, which was evident
in both the posting rate pattern as well as the word and
topic selection.
Focusing on the interactivity networks, the
Ukrainian side seemed to have used Twitter to get in
touch with the UN and other international or
European organizations. In contrast, the Russian
side's networking revealed that it aimed to establish a
channel of communication with Russian embassies
and news organizations affiliated with the Russian
state in order to disseminate information favourable
to the Russian regime and self-report on events that
benefited it.
The investigation above demonstrated how
Ukraine used Twitter more consistently and,
eventually, more successfully throughout the first
three months of the conflict, appearing to have met its
objectives by employing the right layered tactics.
This was clear from the three axes—text analysis,
posting frequency, and interactivity networks—over
which the current study of this sample was conducted.
More data can be added to this area of study to
produce results that are more representative and
generalized, but doing so will necessitate more
sophisticated computing hardware that can handle the
increasing computational demands.
Twitter Metrical Data Analysis Using R: Twiplomacy in the Outbreak of the War in Ukraine
503

Social networks measurements performed in this
analysis have provided useful datasets that can be
analysed further using a variety of statistical methods.
Moreover, other research techniques that can be
applied include the use of semantically more effective
NLP approaches combined with sentiment analysis of
posting content (Mohammad, 2015) and application
of multivariate statistical processing of Social Media
data. To draw more thorough conclusions or examine
trends in various stages of the conflict, these methods
can be applied to other Social Media platforms as well
as over more extended time frames.
REFERENCES
Agarwal, N. S., Punn, N. S., and Sonbhadra S. K. (2022).
Exploring Public Opinion Dynamics on the Verge of
World War III using Russia-Ukraine war -Tweets
Dataset. [online] Available at: https://www.kdd.org/
kdd2022/papers/27_Navya%20Sonal%20Agarwal.pdf
[Accessed 5 Sep. 2022].
Al Jazeera (2022). “No other option”: Excerpts of Putin’s
speech declaring war. Retrieved from
www.aljazeera.com website: https://www.aljazeera.
com/news/2022/2/24/putins-speech-declaring-war-on-
ukraine-translated-excerpts [Accessed 5 Sep. 2022].
Arun, K., Srinagesh, A. and Ramesh, M. (2017). Twitter
Sentiment Analysis on Demonetization tweets in India
Using R language. International Journal of Computer
Engineering in Research Trends, [online] 4(6), pp.252-
258. Available at: https://ijcert.org/ems/ijcert_papers
/V4I6008.pdf [Accessed 5 Sep. 2022]. ISSN: 2349-
7084
Ayyappan, G. & Chidambaram, Nalini. (2016). A study on
SNA: Measure average degree and average weighted
degree of knowledge diffusion in GEPHI. International
Journal of Pharmacy and Technology. 8. 23788-23795.
ISSN : 0976-5166
Bastian, M., Heymann, S. and Jacomy, M. (2009). Gephi:
An Open Source Software for Exploring and
Manipulating Networks. Proceedings of the
International AAAI Conference on Web and Social
Media, pp.361-362. DOI: 10.1609/icwsm.v3i1.13937
Dixon, S. (2022). Global Social Networks Ranked by
Number of Users 2022. Statista. [online] Available at:
https://www.statista.com/statistics/272014/global-soci
al-networks-ranked-by-number-of-users/. [Accessed
17 Oct. 2022].
Džubur, B., Trojer, Ž. and Zrimšek, U. (2022). Semantic
Analysis of Russo-Ukrainian War Tweet Networks.
[online] Available at: https://www.scores.si/
assets/papers/6258.pdf [Accessed 6 Sep. 2022].
Feinerer, I., Hornik, K. and Meyer, D. (2008) Text Mining
Infrastructure in R, Journal of Statistical Software,
25(5). DOI: 10.18637/jss.v025.i05
GetDayTrends (2022). Twitter Trending Hashtags and
Topics. [online] Available at: https://getday
trends.com/. [Accessed 18 Aug. 2022].
Hanley, H. W. A., Kumar, D., and Durumeric, Z. (2022).
Happenstance: Utilizing Semantic Search to Track
Russian State Media Narratives about the Russo-
Ukrainian War on Reddit. DOI: 10.48550/arXiv.
2205.14484
Haq, E. U., Tyson, G., Lee, L. H., Braud, T., and Hui, P.
(2022). Twitter Dataset for 2022 Russo-Ukrainian
Crisis. DOI: 10.48550/arXiv.2203.02955
Hu, Yifan. (2005). Efficient and High Quality Force-Directed
Graph Drawing. Mathematica Journal. 10. 37-71
Kabir, A., Karim, R., Newaz, S., and Hossain, M. (2018).
The Power of Social Media Analytics: Text Analytics
Based on Sentiment Analysis and Word Clouds on R.
Informatica Economica, 22(1/2018), pp. 25-38. DOI:
10.12948/issn14531305/22.1.2018.03
Koutsoupias, N. and Mikelis, K. (2021). Text, Content and
Data Analysis of Journal Articles: The Field of
International Relations. Data Analysis and Rationality
in a Complex World, pp. 113-120. DOI: 10.1007/978-
3-030-60104-1_13
Kumar, A., and Paul, A. (2016). Mastering text mining with
R. Packt Publishing Ltd. ISBN: 978-1783551811
Mohammad, S. (2015). Emotion Measurement 2015
Sentiment Analysis: Detecting Valence, Emotions, and
Other Affectual States from Text. DOI: 10.1016/B978-
0-08-100508-8.00009-6
Newman, M.E.J. (2006). Modularity and community
structure in networks. Proceedings of the National
Academy of Sciences, 103(23), pp.8577–8582. DOI:
10.1073/pnas.0601602103
Pop, A.M., (2018), " International Scientific Conference
Strategies XXI.".Carol I National Defence University
Publishing House, Volume 2, p.114-120.
Saini, S., Punhani, R., Bathla R., and Shukla V. (2019).
Sentiment Analysis on Twitter Data using R, 2019
International Conf. on Automation, Computational and
Technology Management (ICACTM), pp. 68-72.
Shevtsov, A., Tzagkarakis, C., Antonakaki, D., Pratikakis, P.
and Ioannidis, S. (2022). Twitter Dataset on the Russo-
Ukrainian War. DOI: 10.48550/arXiv.2204.08530
Smith, K. (2019). 122 Amazing Social Media Statistics and
Facts. Brandwatch. Available at: https://www.brand
watch.com/blog/amazing-social-media-statistics-and-
facts/ [Accessed 9 Sep. 2022].
Wajahat, A., Nazir, A., Akhtar, F., Qureshi, S., Razaque, F.,
and Shakeel, A. (2020). Interactively visualize and
analyze social network Gephi. 3rd International Conf.
on Computing, Mathematics and Engineering
Technologies (iCoMET), IEEE, pp. 1-9. DOI:
10.1109/iCoMET48670.2020.9073812
Younis, E. M (2015). Sentiment Analysis and Text Mining for
Social Media Microblogs using Open Source Tools: An
Empirical Study. International Journal of Computer
Applications. 112, pp. 44-48. DOI: 10.5120/19665-
1366
Zhu, Y., Haq, E. U., Lee, L., Tyson, G. and Hui, P. (2022).
A Reddit Dataset for the Russo-Ukrainian Conflict in
2022. DOI: 10.48550/arXiv.2206.05107
DATA 2024 - 13th International Conference on Data Science, Technology and Applications
504
