
Classification of Peruvian Elementary School Students with Low
Achievement Problems Using Clustering Algorithms and ERCE
Evaluation
Nancy Rojas-Salvatierra, Lucas Parodi-Roman and Peter Montalvo
Universidad Peruana de Ciencias Aplicadas, Lima, Peru
Keywords:
Artificial Intelligence, Machine Learning, Clustering, K-Means, Agglomerative Clustering, Education, Low
Performance, Students.
Abstract:
At present there are several problems that affect students and their academic performance such as low so-
cioeconomic status that can cause lack of resources both in their homes and in the school. In addition to
psychological and personal problems in which students can be involved. According to various national and
international examinations the academic level in Peru is quite low because the problems mentioned above are
difficult to identify, it is not possible to propose a viable solution, which is why we propose a Machine Learn-
ing model based on Clustering algorithms such as KMeans, Birch and Aglomerative that manage to group
students by the most relevant characteristics or disadvantages they present.
1 INTRODUCTION
Currently, society faces a multitude of challenging
problems that span various sectors, including the
economy, politics, the environment, and other critical
areas. Numerous solutions are proposed in all these
areas to ensure the continued optimal functioning of
the system in which we live. However, in many coun-
tries, one of the most important areas that should be
taken into account and is fundamental for the devel-
opment of other sectors is often sidelined, and that is
education.
Education is a matter of utmost importance for in-
dividual and community development. Consequently,
every country has established a system to provide
this crucial foundation to all its citizens. To assess
whether the techniques and methods within this com-
plex mechanism function optimally, tests have been
conducted to gauge their level of contribution to the
beneficiaries. There are various types of exams with
different scopes, ranging from regional tests like the
Regional Entrance and Exit Exam in Peru to global
assessments such as the Programme for International
Student Assessment (PISA) and the Regional Com-
parative and Explanatory Study (ERCE). These tests
aim to evaluate academic performance at different
stages of a student’s education.
Peru participated in the latest editions of both
exams (PISA 2018 and ERCE 2019)
12
, achieving
below-average results in the former and better perfor-
mance in the latter. However, it’s important to note
that there were 77 and 16 participating countries, re-
spectively. This suggests that the state of education
in Peru is still not conducive to the optimal devel-
opment of students, which implies various problems
from different areas that destabilize students, which
may be directly related to educational institutions or
their personal environment. To improve this situation,
it’s essential for educators and educational institutions
to have a better understanding of students’ conditions
with the aim of supporting them and enhancing their
academic performance. Hence, this research has been
proposed, which can contribute to this process by seg-
menting students based on the issues they face, such
as socio-economic, motivational, and psychological
situations, as well as their performance in various sub-
jects, through the analysis of data from the ERCE and
Sample Evaluation
3
.
This document is divided into four important
parts. The first section explains the search for pre-
1
“PISA 2018 International Assessment Results for Peru
- http://umc.minedu.gob.pe/resultadospisa2018/”
2
“ERCE 2019 Results for Peru” - http://umc.minedu.
gob.pe/resultadoserce2019/
3
“Results of the 2022 Student Sample Evaluation” -
http://umc.minedu.gob.pe/resultados-em-2022/
Rojas-Salvatierra, N., Parodi-Roman, L. and Montalvo, P.
Classification of Peruvian Elementary School Students with Low Achievement Problems Using Clustering Algorithms and ERCE Evaluation.
DOI: 10.5220/0012814200003764
Paper published under CC license (CC BY-NC-ND 4.0)
In Proceedings of the 21st International Conference on Smart Business Technologies (ICSBT 2024), pages 37-43
ISBN: 978-989-758-710-8; ISSN: 2184-772X
Proceedings Copyright © 2024 by SCITEPRESS – Science and Technology Publications, Lda.
37

vious research to find related concepts from other au-
thors that support the proposed foundations and un-
derstand the functioning of education and its chal-
lenges. The second part provides clear and concise
descriptions of the concepts, both related to Machine
Learning and theoretical concepts about the educa-
tional environment, which will be used in the sub-
sequent explanation. The third and most significant
part contains the methodology, which is divided into
data visualization, cleaning and processing of the as-
sessments chosen for this study (ERCE and Sample
Evaluation), as well as the clustering methods ex-
plored, such as K-Means, K-Modes, and Agglomer-
ative Clustering. The final phase encompasses the
results and conclusions obtained during the project’s
development.
2 RELATED WORK
Analyzing the comparison of the most recent PISA
report results
1
, Peru ranks among the 15 countries
with the lowest scores, considering that there were 77
countries involved in the latest assessment. To gain a
more detailed insight into the reasons behind this out-
come, the performance in the Learning Achievement
Assessments
4
was examined. This research helps val-
idate the progress of those involved in Peru’s educa-
tion system in the same year as the PISA test. This
analysis revealed that approximately 80% of second-
year high school students did not have a satisfactory
level of knowledge to continue to the next level of
studies. On the other hand, there seems to be a better
situation in the results for second and fourth graders.
In 2018, around 30% of students were deemed eligi-
ble to proceed to the next level. However, the per-
centage of unsatisfactory academic performance re-
mains much larger than its counterpart and is more
pronounced in worldwide assessments.
This project aims to delve into the causes of poor
academic performance in primary-level education in
Peru and the association of students with similar char-
acteristics using the K-Means Machine Learning al-
gorithm. In other words, the goal is to detect groups
of students with low academic performance while fo-
cusing on the root causes of this problem. The starting
point will be the Regional Comparative and Explana-
tory Study (ERCE) 2019
5
, conducted in Latin Amer-
ica and the Caribbean to measure learning achieve-
4
“Results of the 2019 National Learning Achieve-
ment Assessments” - http://umc.minedu.gob.pe/
resultadosnacionales2019/
5
“ERCE 2019 Results for Peru” - http://umc.minedu.
gob.pe/resultadoserce2019/
ments in the 16 participating countries. Based on
this data, it was determined that the variables that
directly affect students are low socioeconomic sta-
tus, the school environment, and personal problems.
To support these causes and the aforementioned tech-
nique, various research studies and authors who ad-
dress these topics were consulted.
The first section of the text presents findings that
support the importance of factors influencing aca-
demic performance in primary education. One of
these factors is the school environment, which is di-
vided into two aspects: teacher motivation and the
availability of resources in educational facilities, in
addition to students’ socioeconomic status. In the
pedagogical context, Falcon et al. (Falcon et al.,
2023), emphasize that teachers’ positive messages to
students have a positive influence on student perfor-
mance. Also, the higher the student’s motivation to
learn, the more likely the teacher is to use messages
that appeal to extrinsic incentives.
On the other hand, inadequate school infrastruc-
ture can also be a problem, as indicated by Flores-
Mendoza (Flores-Mendoza et al., 2021), who exam-
ines the relationship between general intelligence, so-
cioeconomic status, and the performance of students
in Latin American schools. The findings reveal that
some students in Brazil and Argentina achieve lower
academic results compared to students with simi-
lar socioeconomic backgrounds in Thailand and Bul-
garia. This suggests that the economic development
level of schools significantly impacts children and
adolescents’ learning. However, the influence of stu-
dents’ economic resources on their academic perfor-
mance cannot be ruled out. In contrast, another study
(Miguez, 2023), focused solely on the most disadvan-
taged socioeconomic stratum in six Latin American
countries, finding that academic performance is more
affected by the educational resources available in stu-
dents’ homes than by school infrastructure and teach-
ers’ attitudes. Agasisti et al.(Agasisti et al., 2023)
state that the introduction of technology in education
can have a positive and significant impact on school
efficiency. It can be concluded that well-implemented
technology in the education system can contribute to
students’ learning but must be aligned with their en-
vironment and user knowledge.
Other variables that are part of the causes involve
the students’ emotional state. Rusteholz et al. (Ruste-
holz et al., 2021) examine the problem of school bul-
lying and how it impacts students’ academic perfor-
mance. Additionally, complementary data from fam-
ilies and teachers are considered, and the authors dis-
cover a strong relationship between bullying and aca-
demic performance, affecting both high- and low-
ICSBT 2024 - 21st International Conference on Smart Business Technologies
38

achieving students.
The second part focuses on the techniques used
by other authors to solve similar problems. Fikri
et al. (S Sani et al., 2022) aim to identify patterns
among students’ characteristics in various institutions
of higher education in Malaysia. They collected 16
specific student data, which were processed using al-
gorithms like Random Forest, Info Gain, Extra Tree,
and Chi-Square, to reduce data dimensionality and
assign importance values. By introducing this data
into K-Means, BIRCH, and DBSCAN models and
evaluating their efficiency, it was concluded that K-
Means outperformed the other two. Attributes such
as CGPA, the number of activities, employment sta-
tus, and dropout situation were the most important
in classifying students’ performance. Another study
also presents the K-Means algorithm and SVM as a
good solution for challenges in this field (Talib et al.,
2023). . This research resulted in three clusters of uni-
versity performance: low, medium, and high, which
were compared, highlighting changes in student be-
havior. At the beginning of the semester, behavior had
no significant adverse effects on final performance.
However, those with high self-sufficiency and learn-
ing styles in the ninth week achieved better perfor-
mance.
Likewise, (Zuo and Kummer, 2022) investigated
the impact of students’ habits within the campus on
their academic performance. The database contained
the frequency of students visiting the library and their
eating habits. Using the K-Means algorithm, stu-
dents were classified into different groups, including
”positive habits,” ”regular habits,” ”general habits,”
”non-positive habits,” and ”irregular habits.” This ex-
ploration reinforces K-Means as a good choice for
detecting behavioral patterns. Similarly, (Moubayed
et al., 2021) applied the same clustering algorithm to
classify students in a semi-presential Science course,
dividing the metrics obtained into two categories:
interaction-related and effort-related. After analyz-
ing, it was determined that clustering into two lev-
els was the most efficient, although the clustering into
three levels had similar efficiency and identified stu-
dents with low commitment better.
It was also considered important to introduce an-
other method, Natural Language Processing (NLP), to
gain a better perspective on the correlation between
variables. This led to the consultation of Wulff et
al.’s article (Wulff et al., 2022) . The study focuses
on assessing teachers’ attention to classroom events,
a crucial aspect of student-centered pedagogy. It in-
vestigates the use of pre-trained language models and
clustering techniques to analyze descriptions written
by future physics teachers about observed teaching
situations. In summary, the study examines how pre-
trained language models and clustering can analyze
descriptions of future physics teachers in teaching
situations, finding interpretable patterns and demon-
strating the robustness of the methodology. This
could improve the evaluation of teachers’ attention to
classroom events, which is useful for classifying stu-
dents based on their responses in educational ques-
tionnaires. Furthermore, (Chang et al., 2021) used
machine learning methods, such as clustering and nat-
ural language processing, to classify articles in the
field of environmental education. The research fo-
cused on analyzing research topics in environmental
education journals in the Web of Science database
from 2011-2020. Text mining techniques, clusters,
LDA, and co-word analysis in abstracts and keywords
of research articles were used. Collaboration with ex-
perts in the field ensured the accuracy of topic clas-
sification. The analysis revealed seven relevant cat-
egories. Overall, K-means and LDA methods pro-
duced similar results, with slight differences in two
categories. Expert involvement contributed to the co-
herence and accuracy of topic and document classifi-
cation.
3 OVERVIEW
3.1 Machine Learning
Machine learning is the research area dedicated to
formal learning systems. It is a highly interdisci-
plinary field that draws on statistical ideas, computer
science, cognitive sciences, optimization theory, and
many other disciplines.
3.2 Clustering
Clustering is the process of dividing a set of data into
subsets. Each subset forms a cluster, where objects
within a cluster share certain similarities but have dif-
ferences from objects in other clusters. The set of re-
sulting clusters from a clustering process is called a
clustering.
3.3 Clustering Algorithms
3.3.1 Agglomerative Clustering
Agglomerative Clustering consists of segmenting a
collection of objects into subsets or groups so that
those within each group are more closely related to
each other than objects assigned to different groups
(Talib et al., 2023).
Classification of Peruvian Elementary School Students with Low Achievement Problems Using Clustering Algorithms and ERCE Evaluation
39
3.3.2 BIRCH
The Balance Iterative Reducing and Clustering using
Hierarchies (BIRCH) algorithm is a type of clustering
used mostly with large data sets. BIRCH aims to re-
duce the number of data inputs by generating data that
summarizes the original data set. However, one of its
disadvantages is that it can only be used on numerical
data (Talib et al., 2023).
3.3.3 K-Means
K-Means is an unsupervised learning algorithm in the
field of clustering. Its objective is to divide elements
into a specified number (k) of groups. This partition
is done by considering the nearest mean value (Talib
et al., 2023).
3.4 Metrics
3.4.1 Calinkski-Harabasz
The Calinski-Harabasz index (also known as the Vari-
ance Ratio Criterion) is a metric that can be used for
the evaluation of the degree of clustering of a database
and indicates better clustering when the index value is
higher.
3.4.2 Silhouette
The silhouette coefficient is a metric that allows to
evaluate the quality of the grouping performed by
some clustering algorithms. Its main objective is to
determine the optimal number of groups for specific
data sets and can take values between -1 and 1.
3.4.3 Davies-Bouldin
The Davies-Bouldin index, like those mentioned
above, can be used to evaluate the segmentation ef-
ficiency of the model. In this case, a lower index is
related to a model with a better distribution among
clusters..
3.5 Evaluated Assessments
3.5.1 PISA
Program for International Student Evaluation is an ex-
amination aimed at 15-year-old students from OECD
member countries. Its purpose is to measure their
ability to face real-life challenges using knowledge of
reading, mathematics and science.
3.5.2 ERCE
ERCE is an educational research initiative specific to
Latin America and the Caribbean. It is conducted by
the Latin American Laboratory for Assessment of the
Quality of Education (LLECE) to analyze basic stu-
dent learning and measure their achievements in dif-
ferent subjects.
4 METHODOLOGY
4.1 Dataset Description
The complete database obtained is the ERCE 2019 re-
sults, this dataset includes the results of mathematics,
reading and science tests of students in third and sixth
grade of primary school, as well as personal ques-
tionnaires addressed to students, parents, teachers and
school principals in 16 countries in Latin America and
the Caribbean. However, this project will focus on us-
ing only one part. This includes the results obtained
in the areas of Mathematics and Reading of Peruvian
third grade students. In addition, we will incorporate
questionnaire responses from students and their fam-
ilies, since these data will contribute to better discern
and identify the problems that afflict students.
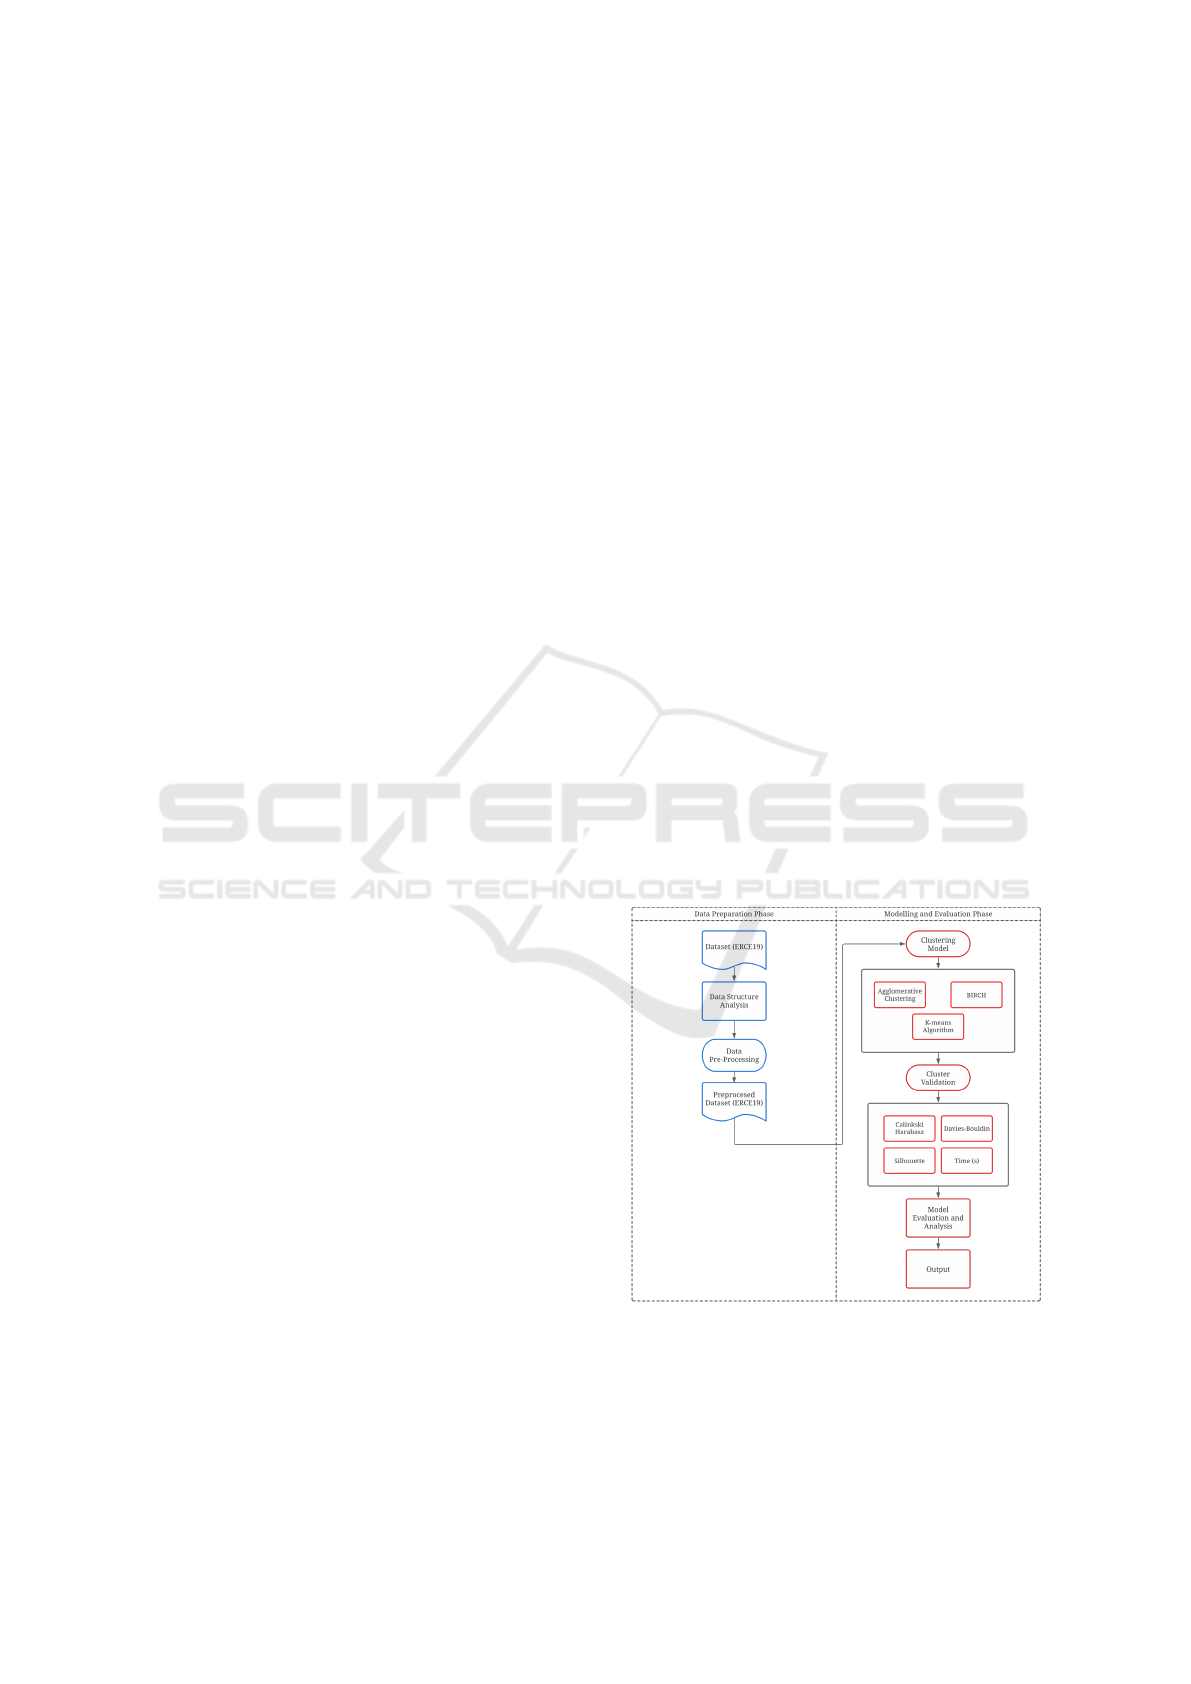
4.2 Data Pre-Processing
Figure 1: Data Preprocessing Model and Structure of Ma-
chine Learning Algorithms.
The data preparation phase begins with the loading
of the ERCE 2019 database, which is composed of
student and family questionnaires. Once the database
ICSBT 2024 - 21st International Conference on Smart Business Technologies
40
is loaded, its structure, the number of columns, and
the data types to be used for running clustering al-
gorithms are analyzed. After the analysis is com-
plete, the data preprocessing process begins. Since
the student data was entirely nominal, three prepro-
cessing techniques were evaluated to convert the data
into numerical form, making it usable for the Model-
ing and Evaluation Phase, as the selected clustering
algorithms only work with numerical data.
Figure 1 illustrates the flow of the developed
model, which is divided into two phases: Data Prepa-
ration Phase and Modeling and Evaluation Phase.
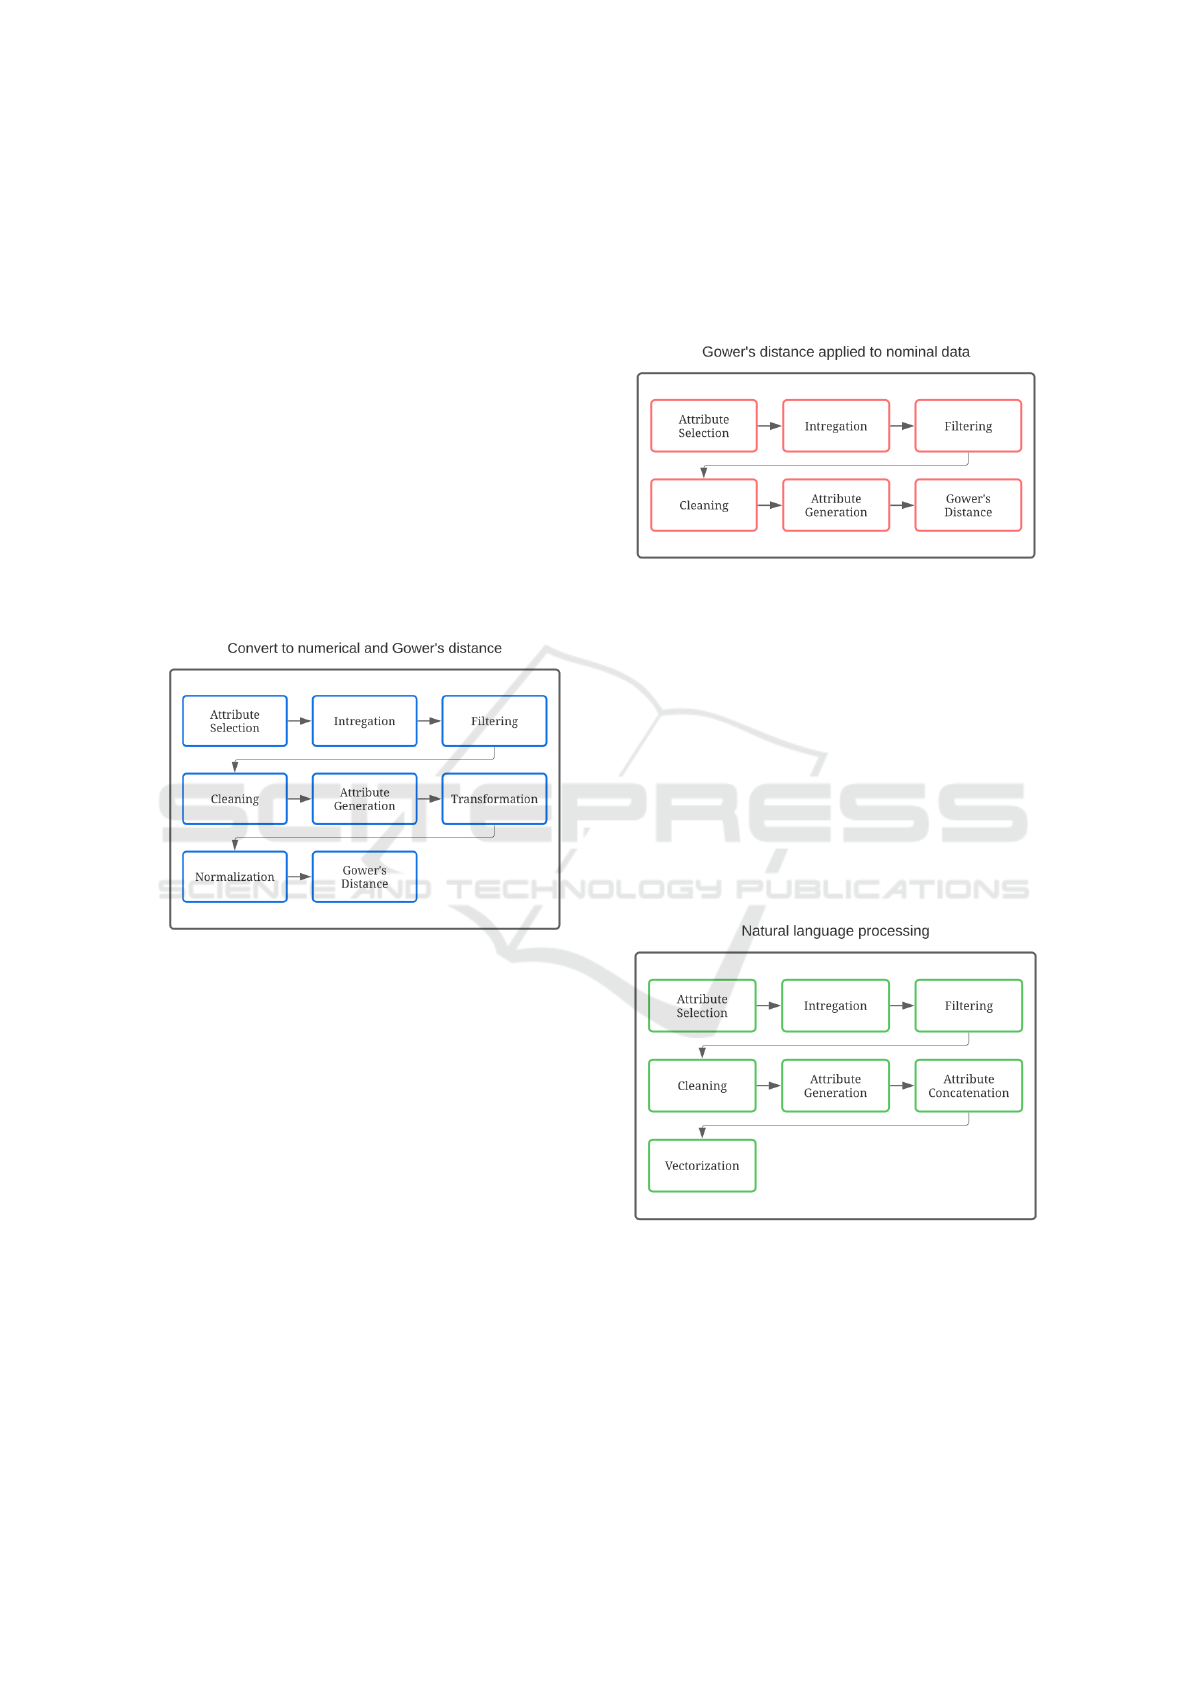
4.2.1 Phase 1
Convert Values to Numeric and Apply Gower Dis-
tance. Figure 2 depicts the flow of the preprocessing
method aimed at converting nominal values into nu-
meric ones.
Figure 2: Flow of Preprocessing Method 1, Convert to Nu-
meric Values and Apply Gower Distance.
The first step of this preprocessing approach be-
gins with the selection of student attributes to con-
sider for the clustering phase. Additionally, we take
the student’s identifier and country for the subsequent
steps. Since there are two datasets, one for family re-
sponses and one for student responses, we integrate
these datasets by matching the student’s identifier.
Next, we filter the students who belong exclusively
to Peru. A data cleaning process follows, where stu-
dents with more than 10% missing data are removed.
Any remaining missing data is imputed, with all miss-
ing values set to 0 in this case. In the next step, all
nominal data is transformed into numerical equiva-
lents using a dictionary (e.g., Yes = 1, No = 0), and
then column normalization is performed. The final
step in preprocessing involves applying Gower dis-
tance, which returns a square matrix with numeric
values indicating a similarity score ranging from 0 to
1 between each student and all others.
4.2.2 Phase 2
Using Nominal Data and Applying Gower Distance.
Figure 3 illustrates the flow of the preprocessing
method in which Gower distance is directly applied
to nominal data.
Figure 3: Flow of Preprocessing Method 2, Apply Gower
Distance to Nominal Values.
The steps used in this process are the same as
those described in Preprocessing Method 1 up to the
point of feature generation. Instead of applying data
transformation, Gower distance is directly used on
nominal values.
4.2.3 Phase 3
Natural Language Processing. Figure 4 illustrates
the flow of the preprocessing method in which natu-
ral language processing and vectorization are directly
utilized.
Figure 4: The flow of the preprocessing method in which
natural language processing and vectorization are directly
utilized.
Similar to the previous preprocessing methods,
the same steps of attribute selection, integration, fil-
tering, data cleaning, and feature generation are car-
ried out. From here, the values in each cell are con-
catenated with the column header, and all columns are
Classification of Peruvian Elementary School Students with Low Achievement Problems Using Clustering Algorithms and ERCE Evaluation
41
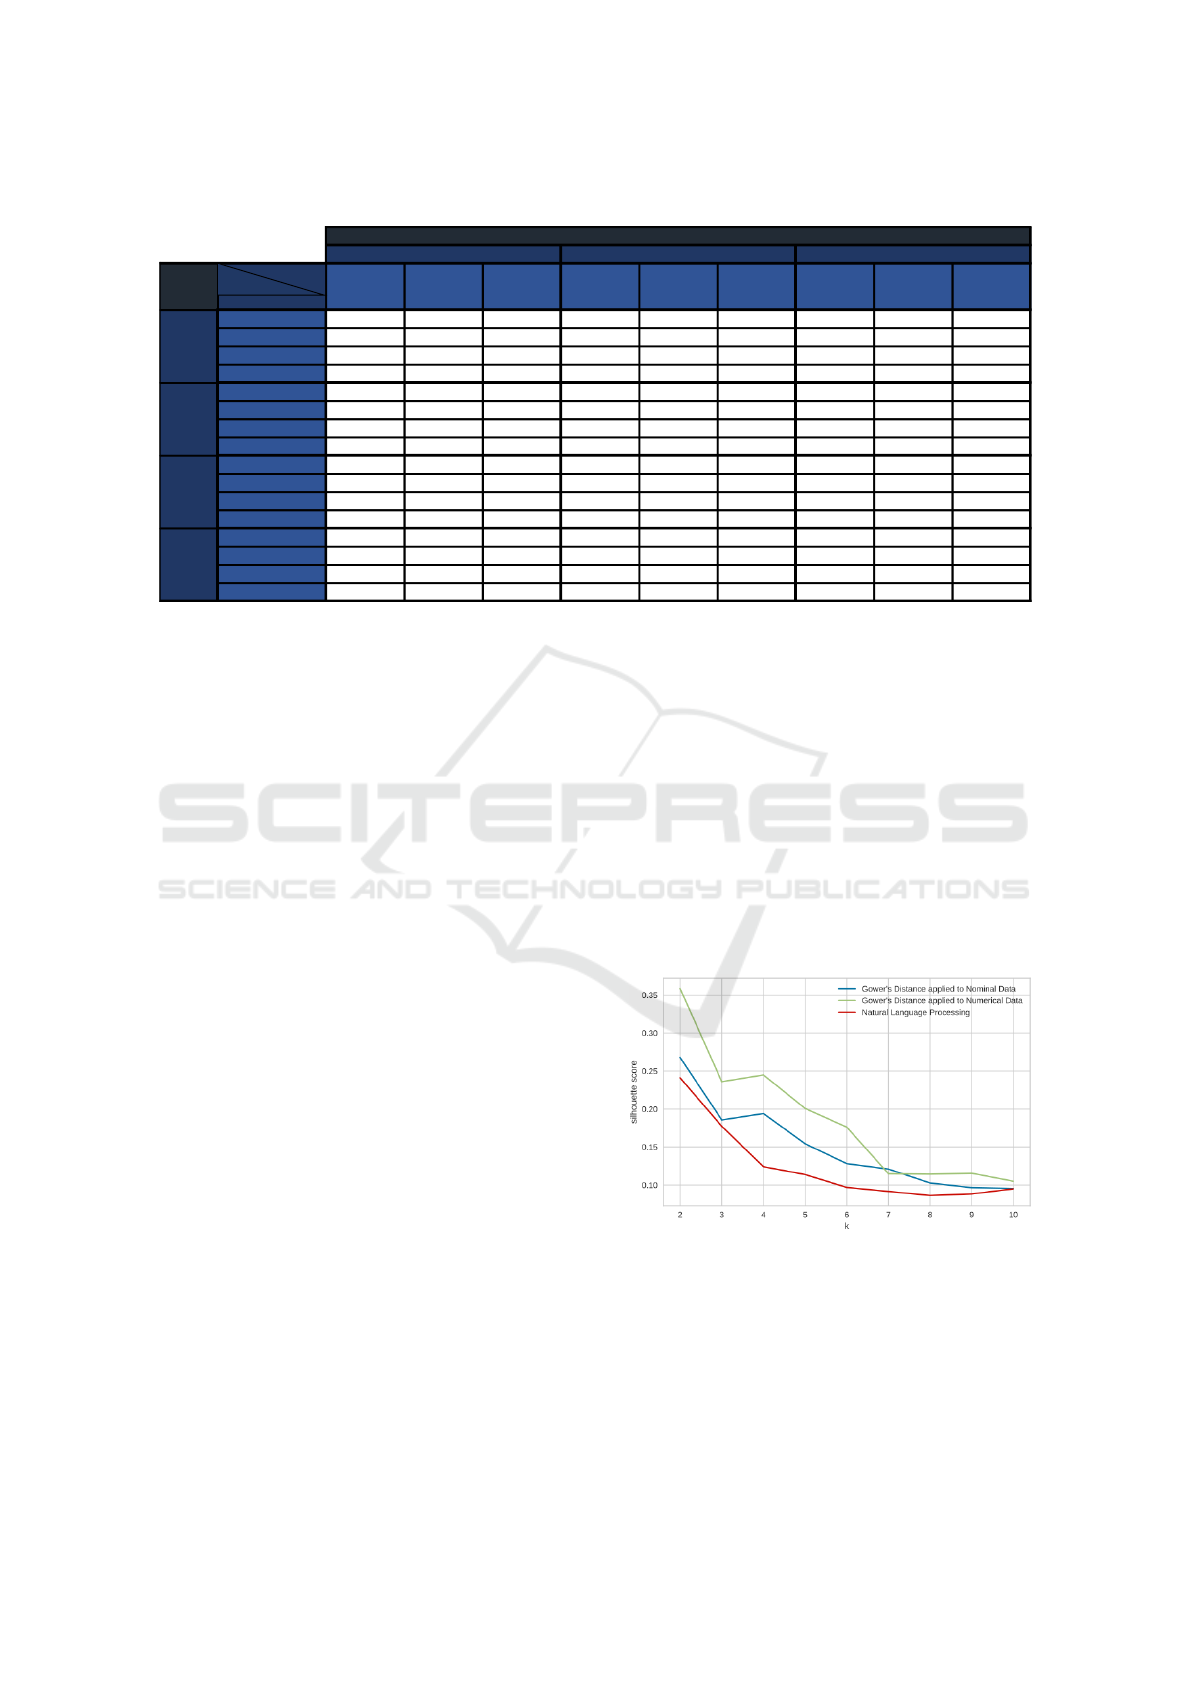
Table 1: The flow of the preprocessing method in which natural language processing and vectorization are directly utilized.
Number
of Clusters
Algorithm
K-means
Agglomerave
Clustering
BIRCH K-means
Agglomerave
Clustering
BIRCH K-means
Agglomerave
Clustering
BIRCH
Davies-Bouldin 1.30 1.31 1.38 1.11 0.97 0.97 1.46 1.55 1.60
Silhouee 0.30 0.27 0.27 0.36 0.36 0.36 0.26 0.24 0.23
Calinski-Harabasz 1843.86 1418.14 1622.57 2436.01 1804.04 1804.04 1382.32 1232.47 1188.43
Time (s) 8.40 25.34 22.97 3.64 15.55 21.42 0.97 2.44 1.61
Davies-Bouldin 1.48 1.71 1.57 1.26 1.29 1.28 1.73 2.00 1.86
Silhouee 0.23 0.19 0.20 0.28 0.24 0.23 0.21 0.18 0.17
Calinski-Harabasz 1441.94 1172.36 1235.53 2088.13 1757.06 1747.57 1079.61 855.73 863.24
Time (s) 7.93 15.24 19.88 6.49 15.83 19.15 2.29 1.12 1.54
Davies-Bouldin 1.52 1.48 1.79 1.54 1.36 1.54 1.81 2.05 1.95
Silhouee 0.22 0.19 0.16 0.23 0.24 0.23 0.19 0.12 0.13
Calinski-Harabasz 1222.69 1040.78 1044.28 1661.23 1463.38 1466.16 879.58 733.46 741.65
Time (s) 7.22 14.56 19.93 16.68 14.68 20.24 0.92 1.09 1.11
Davies-Bouldin 1.53 1.81 1.78 1.42 1.56 1.51 1.89 2.04 2.08
Silhouee 0.19 0.15 0.14 0.22 0.20 0.19 0.16 0.11 0.12
Calinski-Harabasz 1085.82 876.30 880.20 1458.42 1325.30 1304.38 771.67 626.10 648.60
Time (s) 10.46 15.35 24.10 15.39 14.64 18.37 2.76 1.03 1.50
3
4
5
Preprocessing Methods
Gower's Distance applied to Numerical Data
Natural Language Processing
Gower's Distance applied to Nominal Data
2
Metrics
combined into one, separating values by spaces to re-
semble a sentence. Next, a word vectorization process
is applied to generate a matrix that indicates a numer-
ical value for each word for each student.
4.3 Modeling and Algorithm Evaluation
Three clustering algorithms will be used for testing
and comparison, namely agglomerative clustering,
BIRCH, and K-means. For each algorithm, the fol-
lowing metrics will be measured: Calinski-Harabasz,
Davies-Bouldin, Silhouette, and execution time. Each
algorithm was executed four times, each with a differ-
ent number of ’k’ groups, ranging from 2 to 5 groups
to measure the performance of each algorithm. Once
the results of each algorithm are obtained, the metrics
are compared to determine the algorithm with the best
performance according to the input database, which is
the final output of the model.
5 EXPERIMENTAL RESULTS
AND ANALYSIS
Table 1 shows the results of each of the clustering al-
gorithms for each indicated preprocessing method ac-
cording to the four selected metrics. The tests were
performed for 2, 3, 4 and 5 clusters. The best re-
sults for the 3 algorithms are obtained when work-
ing with a number of clusters equal to 2. Among
them, K-means stands out in the preprocessing meth-
ods ”Gower’s distance applied to nominal data” and
”Natural Language Processing”. On the other hand,
with the preprocessing of ”Gower’s distance applied
to numerical data”, a similar result is obtained among
the three clustering algorithms in the silhouette value.
Figure 5 shows a line graph showing the evolution
of the Silhouette value from a number of clusters of
2 to 10 with the Agglomerative Clustering algorithm.
This was selected because of the results analyzed in
Figure 6, and because it is a hierarchical algorithm
that provides us with a parent-child relationship as a
result in order to be able to build a tree report graph
of the students according to the main variables of each
group generated by the algorithm. It can be visualized
that the preprocessing method ”Gower’s distance ap-
plied to numerical data” has a better Silhouette value
for the different numbers of clusters, converging the 3
methods in cluster 10 close to a Silhouette value close
to 0.1.
Figure 5: The flow of the preprocessing method in which
natural language processing and vectorization are directly
utilized.
ICSBT 2024 - 21st International Conference on Smart Business Technologies
42

6 CONCLUSIONS
This paper proposes to analyze the performance
of three unsupervised learning clustering algorithms
with three data preprocessing methods composed en-
tirely of nominal data to classify the performance of
students who participated in the ERCE 2019 test, in
order to generate groups according to their character-
istics that evidence low academic performance. The
proposed algorithms were k-means, BIRCH and ag-
glomerative clustering. On the other hand, the pro-
posed preprocessing methods were Convert to Nu-
meric Values and Apply Gower Distance, Apply
Gower Distance to Nominal Values, and Natural Lan-
guage Processing with vectorization. Afterwards, the
analysis shows that the k-means algorithm is the one
that presents the best performance in the four metrics.
The Agglomerative Clustering algorithm was se-
lected because it uses the Hierarchical clustering
method to generate the clusters. Its silhouette re-
sults are similar to the optimal results obtained by
K-means, which is why it was selected over BIRCH.
As for the preprocessing method, Convert to Numeric
Values and Apply Gower Distance was chosen as it
had the best results in the four metrics.
For future works, other preprocessing techniques
should be tested to work with databases composed en-
tirely or mostly of nominal data, as well as testing
with different student quantities and variables. Fur-
thermore, using chatbots like in other areas (Solis-
Quispe et al., 2021) or Question Answering Models
(Burga-Gutierrez et al., 2020; Rodriguez et al., 2023)
to improve the communication with the students.
REFERENCES
Agasisti, T., Antequera, G., and Delprato, M. (2023).
Technological resources, ict use and schools effi-
ciency in latin america -insights from oecd pisa 2018.
International Journal of Educational Development,
99:102757.
Burga-Gutierrez, E., Vasquez-Chauca, B., and Ugarte, W.
(2020). Comparative analysis of question answering
models for HRI tasks with NAO in spanish. In SIM-
Big, volume 1410 of Communications in Computer
and Information Science, pages 3–17. Springer.
Chang, I.-C., Yu, T.-K., Chang, Y.-J., and Yu, T.-Y. (2021).
Applying text mining, clustering analysis, and latent
dirichlet allocation techniques for topic classification
of environmental education journals. Sustainability,
13:10856.
Falcon, S., Admiraal, W., and Le
´
on, J. (2023). Teachers’
engaging messages and the relationship with students’
performance and teachers’ enthusiasm. Learning and
Instruction, 86.
Flores-Mendoza, C., Ardila, R., Gallegos, M., and
Reategui-Colareta, N. (2021). General intelligence
and socioeconomic status as strong predictors of stu-
dent performance in latin american schools: Evidence
from pisa items. Frontiers in Education, 6.
Miguez, D. (2023). ¿por qu
´
e var
´
ıa el desempe
˜
no entre estu-
diantes de baja condici
´
on social? factores escolares y
dom
´
esticos asociados al logro en seis pa
´
ıses sudamer-
icanos. Education Policy Analysis Archives, 31.
Moubayed, A., Injadat, M., Shami, A., and Lutfiyya, H.
(2021). Student engagement level in e-learning en-
vironment: Clustering using k-means. J. Distance
Educ., 34.
Rodriguez, R. A., Ferroa-Guzman, J., and Ugarte, W.
(2023). Classification of respiratory diseases us-
ing the NAO robot. In ICPRAM, pages 940–947.
SCITEPRESS.
Rusteholz, G., Mediavilla, M., and Pires Jim
´
enez, L.
(2021). Impact of bullying on academic performance:
A case study for the community of madrid. SSRN
Electronic Journal.
S Sani, N., Sani, M. A. A., Abd Rahman, A. H., Nafuri, F.,
and Zainudin, N. (2022). Clustering analysis for clas-
sifying student academic performance in higher edu-
cation. Applied Sciences, 12:9467.
Solis-Quispe, J. M., Quico-Cauti, K. M., and Ugarte, W.
(2021). Chatbot to simplify customer interaction in e-
commerce channels of retail companies. In ICITS (1),
volume 1330 of Advances in Intelligent Systems and
Computing, pages 561–570. Springer.
Talib, N., Majid, N., and Sahran, S. (2023). Identification of
student behavioral patterns in higher education using
k-means clustering and support vector machine. Ap-
plied Sciences, 13:3267.
Wulff, P., Buschh
¨
uter, D., Westphal, A., Mientus, L.,
Nowak, A., and Borowski, A. (2022). Bridging the
gap between qualitative and quantitative assessment
in science education research with machine learning
— a case for pretrained language models-based clus-
tering. Journal of Science Education and Technology,
31.
Zuo, J. and Kummer, M. G. C. (2022). A new student be-
havior analysis method based on k-means algorithm
and consumption data of campus smart card. In
FSDM, volume 358 of Frontiers in Artificial Intelli-
gence and Applications, pages 117–125. IOS Press.
Classification of Peruvian Elementary School Students with Low Achievement Problems Using Clustering Algorithms and ERCE Evaluation
43
