
Improving the Efficiency of Intrusion Detection Systems by Optimizing
Rule Deployment Across Multiple IDSs
Arka Ghosh
1
, Massimiliano Albanese
2 a
, Preetam Mukherjee
1
and Amir Alipour-Fanid
3
1
Digital University Kerala, India
2
George Mason University, U.S.A.
3
University of the District of Columbia, U.S.A.
Keywords:
Intrusion Detection, IDS Rule Placement, Attack Graph, Optimization.
Abstract:
Intrusion Detection Systems (IDS) are strategically installed on specific nodes of an enterprise network to
detect ongoing attempts to exploit vulnerable systems. However, deploying a large number of detection rules in
each IDS may reduce their efficiency and effectiveness, especially when an IDS is monitoring high-speed data
communication channels. Existing research on optimal IDS placement strategies does not address the problem
at such a level of granularity. This paper proposes a novel approach for strategic rule deployment subject to
various practical constraints. Attack graph-based modeling, along with knowledge of the network topology, is
employed to identify the set of suitable rules for deployment on individual IDSs, and capacity constraints are
considered to balance the load across IDSs. We provide a formal specification of the optimization problem
and propose a practical heuristic solution based on a genetic algorithm.
1 INTRODUCTION
In today’s cybersecurity landscape, a robust intru-
sion detection mechanism is necessary for any net-
worked system to detect incoming attacks. In the
last few decades, advanced persistent threat (APT) ac-
tors have developed highly advanced attack vectors
that can bypass existing detection mechanisms. So-
larWinds Supply Chain Attack (2020), Hafnium Ex-
change Server Exploits (2021), NOBELIUM Cam-
paign (2021), Conti Ransomware Attacks (2021-
2022) are examples of such attacks, which have tar-
geted systems of importance to countries. Secu-
rity researchers are working towards advancing intru-
sion detection technology using various mechanisms
based on patterns, rules, and machine learning tech-
niques (Liao et al., 2013; He et al., 2023; Chou and
Jiang, 2021). Even after developing many defen-
sive techniques like zero-trust architectures (Stafford,
2020) and security-by-design (Sequeiros et al., 2020),
there are instances where sophisticated, persistent at-
tacks can circumvent existing IDS mechanisms.
Although optimal IDS placement is a well-
researched problem (Noel and Jajodia, 2008; Chen
et al., 2010), current solutions do not provide direc-
a
https://orcid.org/0000-0002-2675-5810
tives for rule deployment. The placement of IDS
rules is as important as sensor placement, as net-
work throughput and security will depend on the num-
ber and appropriateness of the rules deployed. Usu-
ally, the rule deployment task is left to network secu-
rity administrators, making it error-prone. In a net-
worked system with multiple deployed IDS sensors,
determining the optimal rule deployment based on the
computational capacity of systems and the suitability
of the rules requires an automated solution.
In this paper, we proposed an optimized IDS rule
placement strategy based on attack modeling. Practi-
cal constraints like IDS capacity, traffic volume, and
usefulness of the deployed rules are considered while
formulating the rule placement strategies. The main
contributions of this paper include (i) Leveraging at-
tack modeling to identify sets of candidate rules to
be deployed on each IDS to detect exploitation traffic
traversing the IDS; (ii) modeling the rule deployment
problem as an optimization problem aiming to maxi-
mize the number of detectable attack paths, subject to
capacity constraints on each IDS; and (iii) a heuristic
solution based on a genetic algorithm.
The rest of the paper is organized as follows. Sec-
tion 2 discusses related research whereas Section 3
provides motivating examples. The formal problem
statement is detailed in Section 4, along with its for-
536
Ghosh, A., Albanese, M., Mukherjee, P. and Alipour-Fanid, A.
Improving the Efficiency of Intrusion Detection Systems by Optimizing Rule Deployment Across Multiple IDSs.
DOI: 10.5220/0012814500003767
Paper published under CC license (CC BY-NC-ND 4.0)
In Proceedings of the 21st International Conference on Security and Cryptography (SECRYPT 2024), pages 536-543
ISBN: 978-989-758-709-2; ISSN: 2184-7711
Proceedings Copyright © 2024 by SCITEPRESS – Science and Technology Publications, Lda.

mulation as an optimization problem. Then, Section 5
presents a case study, and Section 6 discusses the
heuristic solution based on a genetic algorithm. Fi-
nally, Section 7 presents the results, and Section 8
provides some concluding remarks.
2 RELATED WORK
Noel et al. (Noel and Jajodia, 2008) proposed a
greedy algorithm for optimal IDS sensor placement
using attack graph analysis. The approach in (Chen
et al., 2010) used Multi-Objective Genetic Algorithms
(MOGAs) for sensor placements meeting various se-
curity criteria. (Babatope et al., 2014) extended sen-
sor placement models in Network-Based Intrusion
Detection Systems (NIDS), accounting for diverse
IDPS technologies.
Optimal detector placement for botnet mitigation
has also been explored. (Venkatesan et al., 2015)
used heuristic strategies based on centrality measures
to identify key nodes for detector placement, aiming
to disrupt botnet communication. (Albanese et al.,
2018) introduced a monitoring approach based on
moving target defense to identify and remove com-
promised machines. DeBot (Venkatesan et al., 2018)
is a network-based scheme designed to detect exfil-
tration by persistent botnets, focusing on identifying
suspicious traffic flows and demonstrating resilience
against evasion techniques.
Despite extensive research on IDS placement, the
deployment of IDS rules has received less attention.
Optimal IDS rule placement can enhance detection
efficiency by reducing redundant checks. Our work
introduces an adaptive algorithm for optimizing IDS
rule placement in a multi-IDS environment to im-
prove network security.
As networks grow more complex, multi-hop at-
tacks become more feasible, necessitating the use
of attack graphs for vulnerability analysis and net-
work hardening. Tools like Nessus, OpenVAS, Nex-
pose, and Burp Suite identify network vulnerabilities,
which are categorized by CVE ID and CWE cate-
gory. Detailed vulnerability information is available
in the National Vulnerability Database (NVD). Tools
like XploitMAP (Mukherjee et al., 2023), TVA (Jajo-
dia and Noel, 2010), and Attack Dynamics (S
¨
onmez
et al., 2022) facilitate the generation of attack graphs.
3 MOTIVATING EXAMPLES
In Figure 1, a moderately complex enterprise net-
work is shown. The network has internet-facing Web
Figure 1: Example of network with multiple IDSs.
Servers, File Servers, and a separate sub-network for
guest-user connectivity. Three separate branches of
the network are shown. Branch-I and Branch-III are
connected to the private Data Center. IPv4 address
ranges are displayed for all sub-networks, with a few
specific interface IP addresses explicitly shown. A
few IDS instances are deployed, as shown in green.
Some IDSs are installed within the sub-network, like
IDS-2, 3, 4, and 5, and other IDSs are installed
on routers connecting multiple sub-networks. IDSs
within a sub-network can only observe traffic within
that subnet, whereas an IDS deployed on a router can
monitor the traffic across all connected subnetworks.
Applications on various network hosts may have
exploitable vulnerabilities. Direct exploitation of vul-
nerabilities in the Data Center may be prevented by
network traffic filtering. Thus, attackers must devise
multi-hop attacks to reach their targets. In these sce-
narios, different IDSs will encounter different types of
attack traffic. IDSs near the internet might detect ini-
tial stages of a multi-hop attack, such as phishing at-
tempts, while an internal IDS might observe more ad-
vanced stages, like lateral tool transfers. Understand-
ing the positions of IDSs and modeling multi-hop at-
tacks can inform the development of an advanced and
effective IDS rule placement strategy. When deploy-
ing IDS rules, various scenarios may arise, and our
proposed solution aims to handle all such cases.
Scenario 1. Figure 2 illustrates examples of multi-
hop attacks within a section of the network shown
in Figure 1. These attacks are denoted with dotted
curved arrows. An internet-based attacker might ex-
ploit a vulnerability in an internet-facing web server
(e.g., a buffer overflow). After compromising the web
server, the attacker can launch a second attack (e.g.,
Improving the Efficiency of Intrusion Detection Systems by Optimizing Rule Deployment Across Multiple IDSs
537
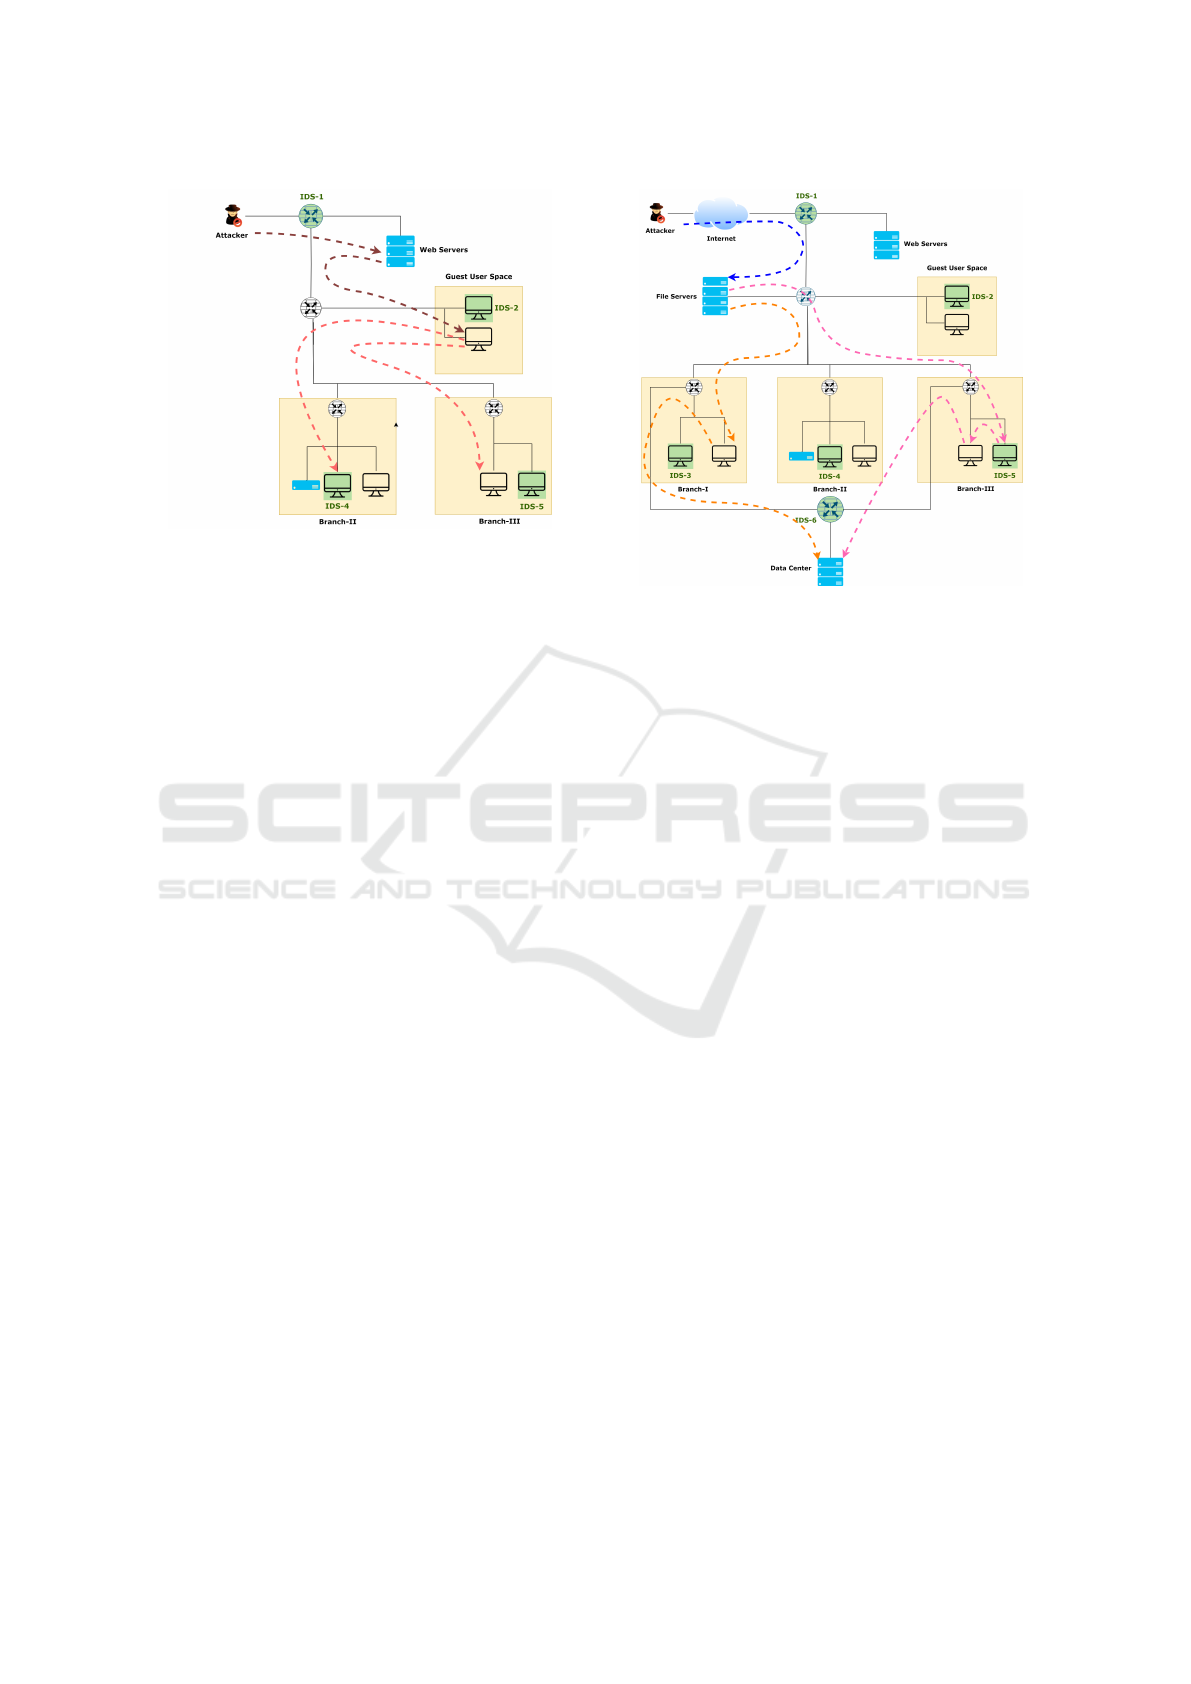
Figure 2: Scenario 1.
spearphishing) on a host in the guest user space. Sup-
pose two Windows servers in Branch-II and Branch-
III expose the same vulnerability (CVE-2022-29139:
Remote Code Execution Vulnerability). An attacker
with access to the guest user’s machine can exploit
this vulnerability in either branch.
The final phase of this multi-hop attack would
start from the Guest User Space and target either
Branch-II or Branch-III. The critical question is
where to deploy the IDS rule to detect the exploit
of vulnerability CVE-2022-29139. To ensure detec-
tion, the IDS rule should be placed either on IDS-2
alone or on both IDS-4 and IDS-5. The decision re-
quires careful consideration of traffic volumes in dif-
ferent network sections. If the guest user network
handles significant traffic, adding the rule to IDS-2
could strain computational resources. Conversely, de-
ploying the rule on both IDS-4 and IDS-5 would in-
crease maintenance costs. Deploying the rule on any
other IDS would waste computational resources with-
out improving detection capability. If the rule is de-
ployed on both IDS-2 and IDS-4/IDS-5, it would re-
sult in redundant checks of the same traffic.
Scenario 2. Figure 3 shows an attacker using one of
two multi-hop paths to reach the Data Center. The ini-
tial phase, exploiting a vulnerability in the File Server,
is common to both paths. After this, the attack can
proceed along two sub-paths, indicated by the orange
(left side) and red (right side) dotted arrows.
To detect any attack directed at the Data Center, it
is crucial to monitor all potential attack paths. This
can be accomplished by deploying an IDS rule to de-
tect the File Server exploit on IDS-1 or by ensuring
detection on both alternative sub-paths. Detecting at-
tacks where paths converge can minimize the number
of IDS rules deployed but may overburden the IDS
due to high traffic volumes. Typically, the traffic from
the internet to the File Server is significant, so adding
Figure 3: Scenario 2.
a rule to IDS-1 could heavily tax resources. The same
issue arises if a rule is added to IDS-6 to detect attacks
towards the Data Center Server. Alternatively, adding
rules to IDS-3 and IDS-5 would distribute the load
more evenly but would require rules on both IDSs to
cover each attack path. This approach balances the
use of computational resources, ensuring that detec-
tion is effective without overloading a single IDS.
4 PROBLEM STATEMENT
In this paper, we address the problem of optimally de-
ploying intrusion detection rules on multiple Intrusion
Detection Systems installed across a complex net-
work. We model the network as a graph G = (N,E)
where N is a set of nodes representing hosts and
routers and E is a set of edges representing connec-
tion between them. We use R ⊂ N to denote the set
of routers and H ⊂ N to denote the set of hosts, with
R ∪ H = N and R ∩ H =
/
0. A complex network is
typically partitioned into multiple subnetworks con-
nected by routers, with hosts in each subnetwork con-
nected to one another through a local area network.
The i-th subnetwork can be modeled as a graph S
i
=
(N
i
,E
i
) where N
i
⊂ N and E
i
= {(u,v)|u,v ∈ N
i
}, i.e.,
a subnetwork includes a subset of the nodes and the
edges connecting them. Two or more subnetworks
S
1
,S
2
,...,S
m
can be connected through a router r ∈ R,
such that {r} =
T
m
i=1
N
i
, i.e, the router r is a node in
each of the interconnected subnetworks.
Without loss of generality, we assume that for
any two subnetworks S
i
,S
j
there is no more than one
router connecting them, i.e., |N
i
∩N
j
| ≤ 1, and that ev-
ery host h ∈ H belongs to only one subnetwork. We
SECRYPT 2024 - 21st International Conference on Security and Cryptography
538

assume that intrusion detection systems are installed
on a subset D ⊂ N of the nodes, which may include
both hosts and routers. An IDS installed on a host
h in a subnetwork S
i
can see all the traffic traversing
that subnetwork, whereas an IDS installed on a router
that connects subnetworks S
1
,S
2
,...,S
m
can see all
the traffic traversing any of those subnetworks.
Intrusion detection systems are equipped with sets
of rules designed to identify attempts to penetrate and
compromise networked systems. In particular, we are
interested in deploying rules that are designed to de-
tect attempts to exploit known vulnerabilities on any
of the hosts in the network. To guide the optimal de-
ployment of IDS rules, we need to map each IDS to
the set of vulnerabilities such that an attempt to ex-
ploit one of these vulnerabilities results in network
traffic that can be intercepted by that IDS. To this aim,
we model an attack graph as a graph A = (V, L) where
V is a set of vulnerabilities and L is a set of edges
representing dependencies between vulnerabilities in
multi-step attacks, and we use a function γ : V → H
to map each vulnerability v ∈ V to the host h ∈ H that
exposes that vulnerability. An edge (v
1
,v
2
) ∈ L rep-
resents an attack step and indicates that vulnerabil-
ity v
2
can be exploited after exploiting vulnerability
v
1
. Let P denote the set of all attack paths over A.
An attack path a ∈ P is a sequence of vulnerabilities
a = hv
i
1
,...,v
i
n
i s.t. (∀i ∈ [0, n − 1])(v
i
,v
i+1
) ∈ L.
An attempt to exploit v
2
will result in traffic from
γ(v
1
) to γ(v
2
), traversing a sequence of subnetworks
and routers P(v
1
,v
2
) = hS
i
0
,R
i
1
,S
i
1
,...,R
i
k
,S
i
k
i, with
γ(v
1
) ∈ N
i
0
, γ(v
2
) ∈ N
i
k
, and R
i
j
∈ N
i
j−1
∩ N
i
j
, where
N
i
j
is the set of nodes in subnetwork S
i
j
, i.e., router R
i
j
is the router connecting two consecutive subnetworks
in P(v
1
,v
2
), with the two vulnerabilities v
1
and v
2
be-
ing exposed on hosts in the first and last subnetwork
respectively. Deploying an IDS rule for vulnerability
v
2
on an IDS installed on any router or subnetwork
in P(v
1
,v
2
) will result in detecting an exploit of v
2
.
In the following, we will slightly abuse notation for
the sake of brevity and use P(v
1
,v
2
) to denote the fol-
lowing set of nodes, i.e., the set all nodes that can see
traffic between γ(v
1
) and γ(v
2
):
P(v
1
,v
2
) =
[
j∈[0,k]
N
i
j
(1)
Let R denote the set of available IDS rules, and
let δ : V → 2
R
denote a mapping that associates each
vulnerability v ∈ V with a set of rules δ(v) that can
detect an attempt to exploit v. A rule deployment is a
mapping ρ : D → 2
R
that associates each IDS d ∈ D
with a set of rules ρ(d) to be deployed on it. Based
on these preliminary definitions and notations, we can
now define the notions of attack step detection and
attack path detection.
Definition 1 (Attack Step Detection). Given a net-
work G = (N, E), with an IDS deployed on each node
in D ⊆ N and an attack graph A = (V, L), an attack
step (v
i
,v
j
) ∈ L can be detected if and only if D ∩
P(v
i
,v
j
) 6=
/
0∧∃d ∈ D ∩P(v
i
,v
j
) s.t. δ(v
j
)∩ρ(d) 6=
/
0,
i.e., there is at least one IDS that can observe traffic
between the hosts exposing vulnerabilities v
i
and v
j
and at least one IDS rule for v
j
is deployed on at least
one such IDS.
Definition 2 (Attack Path Detection). Given a net-
work G = (N,E), with an IDS deployed on each
node D ⊆ N and an attack graph A = (V, L), an
attack path hv
i
1
,...,v
i
n
i can be detected if at least
one attack step (v
i
j
,v
i
j+1
) can be detected, formally
if and only if ∃ j s.t. D ∩ P(v
i
j
,v
i
j+1
) 6=
/
0 ∧ ∃d ∈
D ∩ P(v
i
j
,v
i
j+1
) s.t. δ(v
i
j+1
) ∩ ρ(d) 6=
/
0, i.e., there is
at least one IDS that can observe traffic between
the hosts exposing vulnerabilities corresponding to at
least one attack step (v
i
j
,v
i
j+1
), and at least one IDS
rule for v
i
j+1
is deployed on at least one such IDS.
Our objective is to determine a rule deployment ρ
that maximizes the number of detectable attack paths.
Section 4.1 formulates the optimization problem and
proposes a solution based on a genetic algorithm.
4.1 Optimization Problem
Consider a set of start nodes H
s
∈ H and a set of goal
nodes H
g
∈ H. Our objective is to maximize the num-
ber of attack paths between H
s
and H
g
that can be
detected, subject to capacity constraints on individual
IDSs. Given a rule deployment ρ, consistently with
Definition 2, the set of attack paths that can be de-
tected by ρ is defined as follows:
P
ρ
= {a ∈ P | ∃ j s.t. D ∩ P(v
i
j
,v
i
j+1
) 6=
/
0∧
∃d ∈ D ∩ P(v
i
j
,v
i
j+1
) s.t. δ(v
i
j+1
) ∩ ρ(d) 6=
/
0}
Let c : D → N denote a mapping that associates
each IDS with its capacity expressed as the number
of packet inspections that the IDS can perform per
unit of time and let T : D → N denote a mapping that
associates each IDS with the expected volume of traf-
fic traversing it, expressed as the number of packets
per unit of time. Each packet observed by an IDS
d is matched against each of the rules deployed on
that IDS, resulting in T (d) · |ρ(d)| inspections, which
cannot exceed the capacity c(d) of the IDS. This con-
straint can be formalized as follows:
(∀d ∈ D) T (d) · |ρ(d)| ≤ c(d) (2)
The optimization problem can then be formalized as:
Maximize |P
ρ
|
subject to ((∀d ∈ D)|ρ(d)| · T (d) ≤ c(d))
(3)
Improving the Efficiency of Intrusion Detection Systems by Optimizing Rule Deployment Across Multiple IDSs
539

We can represent a deployment ρ(d) as a set X =
{x
i j
} of binary decision variables, with x
i j
= 1 if rule
r
j
deployed on IDS d
i
, i.e., r
j
∈ ρ(d
i
). Thus, the con-
straints can be rewritten as follows:
∀i ∈ (1,|D|)
∑
j∈(1,|R |)
x
i j
≤ c(d
i
)/T (d
i
) (4)
Let p
k
denote the k-th attack path in P , with
k ∈ (1,|P |). Then, let p
km
= (v
s
km
,v
d
km
) denote the
m-th attack step of attack path p
k
, with m ∈ (1, |p
k
|).
We can now represent the mapping δ as a set of binary
values {δ
jkm
} with δ
jkm
= 1 if rule r
j
can detect the
m-th attack step of attack path p
k
, i.e., r
j
∈ δ(v
d
km
).
Let o
ikm
= 1 if detector d
i
can observe traffic corre-
sponding to the m-th attack step of attack path p
k
, i.e.,
d
i
∈ D ∩ P(v
s
km
,v
d
km
). Thus, an attack path p
k
can be
detected if the following condition is satisfied:
∑
m∈(1,|p
k
|)
∑
j∈(1,|R |)
δ
jkm
·
∑
i∈(1,|D|)
o
ikm
· x
i j
!
≥ 1 (5)
Accordingly, P
ρ
can be redefined as follows:
P
ρ
=
p
k
∈ P
∑
m∈(1,|p
k
|)
∑
j∈(1,|R |)
δ
jkm
·
∑
i∈(1,|D|)
o
ikm
· x
i j
!
≥ 1
(6)
Finally, the maximization problem defined by
Eq. 3 can then be rewritten as follows:
Maximize
p
k
∈ P
∑
m∈(1,|p
k
|)
∑
j∈(1,|R |)
δ
jkm
·
∑
i∈(1,|D|)
o
ikm
· x
i j
!
≥ 1
subject to
∀i ∈ (1, |D|)
∑
j∈(1,|R |)
x
i j
≤ c(d
i
)/T (d
i
).
5 ILLUSTRATIVE CASE STUDY
In the experimental setup in Figure 4a, virtual ma-
chines simulate the attacker machine, vulnerable
hosts, and IDS devices. Open vSwitches (OVS) con-
nect the IDS devices in the network using port mir-
roring. All four host machines run vulnerable appli-
cations. External attackers can reach vulnerable Host
1 and Host 2, as these are accessible from the inter-
net. Due to traffic restrictions, Host 1 can only access
Host 2 and Host 3, while Host 2 can access Host 3.
The internal Host 4 is accessible only from Host 3.
Attackers can exploit host vulnerabilities to estab-
lish footholds for further attacks. Due to connection
restrictions, attackers cannot directly exploit the vul-
nerability on Host 4 but can execute multi-hop at-
tacks to reach it. As shown in Figure 4b, where v
i. j
represents the j-th vulnerability on the i-th Host, at-
tackers may follow three possible attack paths to gain
root access to vulnerable Host 4. The sequences of
sub-networks and routers that the traffic will traverse
during these multi-hop attacks are illustrated in Fig-
ure 4a, with different colors representing the sequence
of subnetworks and routers for each attack path.
There are four IDSs strategically placed across the
network. Our main goal is to deploy IDS rules to
maximize detection of attack paths while keeping the
load on any particular IDS within its capacity limit.
Attack steps on all three attack paths – a
R
(red), a
M
(magenta), and a
B
(blue) – are shown in Table 1. To
ensure the security of Host 4, we need to detect at
least one attack step per path (i.e., one per row).
None of the IDSs can observe all the attack traf-
fic. For instance, when the attacker executes attack
step (v
0
,v
1
), only IDS-1 can observe the attack traf-
fic. The mapping between IDSs and observable at-
tack traffic is crucial for IDS rule placement. Table 2
illustrates this mapping as a two-dimensional matrix.
The appropriate rule for detecting an attack step can
be identified based on the mapping in Table 3. The
deployment of these rules across the four IDSs will
determine the network’s attack detection capabilities.
A possible deployment (Example I in Table 4) in-
cludes Rule C on IDS 1 and Rule B on IDS 2 to detect
attack steps (v
0
,v
1
) and (v
0
,v
2.1
) respectively, thus
detecting all attack entry points. Another possible de-
ployment (Example II in Table 5) has Rule C on IDS
4 to detect the last attack step (v
3.2
,v
4
). Security ad-
ministrators must consider the capacity constraints of
each IDS. If the traffic seen by IDS 1 and IDS 4 is
too high for these IDSs to inspect all traffic, even for
a single deployed rule, then IDS 2 and IDS 3, where
traffic loads are lighter, can be utilized for detecting
attacks, as shown in Table 6. Rule A on IDS 2 will
detect attack steps (v
1.3
,v
2.1
) (part of path a
M
) and
(v
2.2
,v
3.1
) (part of paths a
R
and a
B
). Rule B on IDS
3 will detect attack step (v
0.1
,v
1.2
) (part of path a
R
).
This strategy ensures that critical attack steps are de-
tected while meeting capacity constraints.
6 GENETIC ALGORITHM
As the objective function involves counting the num-
ber of attack paths satisfying certain conditions, it
is not a simple linear function of the decision vari-
ables. Thus, direct methods like linear programming
may not be applicable. Given the nonlinearity of the
objective function and the binary nature of the deci-
sion variables, a heuristic or metaheuristic approach
may be suitable for solving this optimization prob-
lem. One approach is to use a genetic algorithm (GA)
to search for a solution that maximizes the objective
function while satisfying the constraints. In a GA ap-
SECRYPT 2024 - 21st International Conference on Security and Cryptography
540
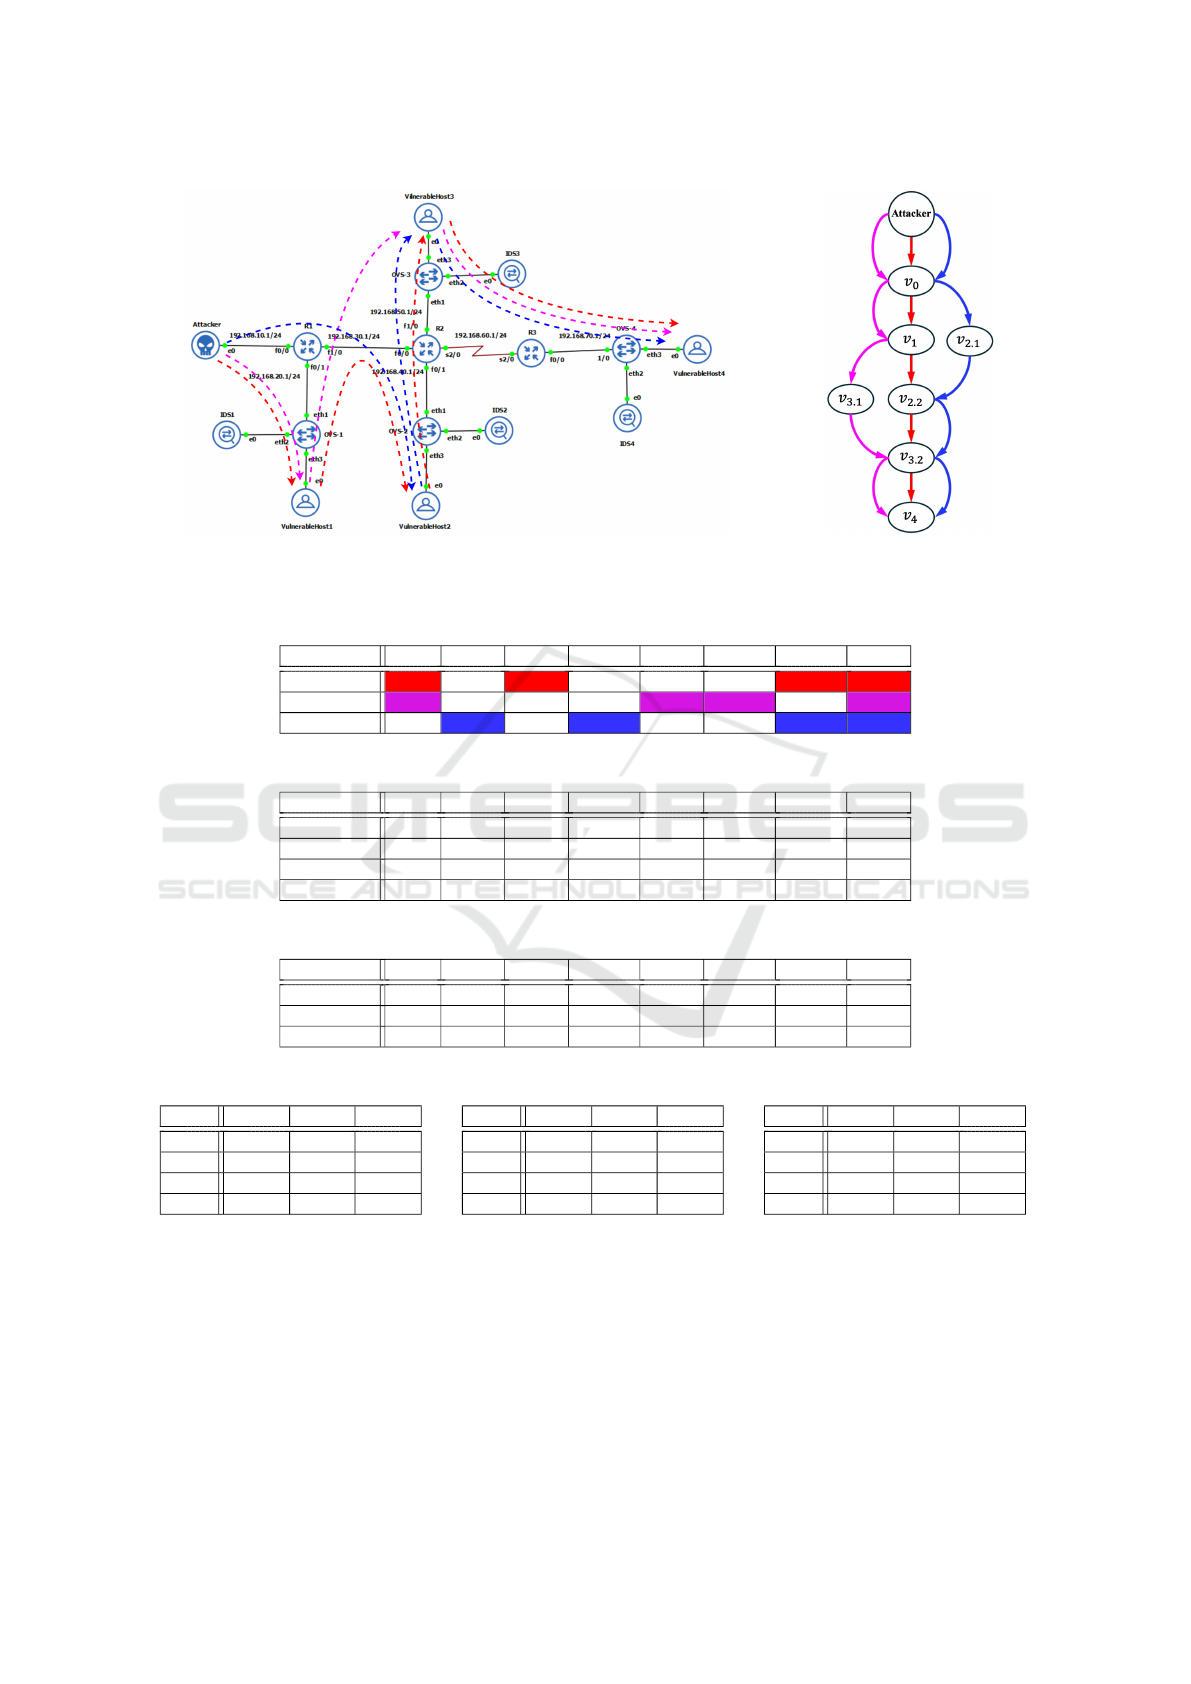
(a) Experimental setup showing all possible attack paths. (b) Attack Graph.
Figure 4: (a) Experimental setup showing all possible attack paths and (b) attack graph.
Table 1: Attack Path to Attack Step Mapping.
Attack Steps v
0
,v
1
v
0
,v
2.1
v
1
,v
2.2
v
2.1
,v
2.2
v
1
,v
3.1
v
3.1
,v
3.2
v
2.2
,v
3.2
v
3.2
,v
4
Path a
R
1 0 1 0 0 0 1 1
Path a
M
1 0 0 0 1 1 0 1
Path a
B
0 1 0 1 0 0 1 1
Table 2: Mapping between IDSs and the attack steps they can observe.
Attack Steps v
0
,v
1
v
0
,v
2.1
v
1
,v
2.2
v
2.1
,v
2.2
v
1
,v
3.1
v
3.1
,v
3.2
v
2.2
,v
3.2
v
3.2
,v
4
IDS 1 1 0 1 0 0 0 0 0
IDS 2 0 1 1 0 0 0 1 0
IDS 3 0 0 0 0 1 0 1 1
IDS 4 0 0 0 0 0 0 0 1
Table 3: Mapping between IDS rules and attack steps they can detect.
Attack Steps v
0
,v
1
v
0
,v
2.1
v
1
,v
2.2
v
2.1
,v
2.2
v
1
,v
3.1
v
3.1
,v
3.2
v
2.2
,v
3.2
v
3.2
,v
4
Rule A 0 0 1 1 0 1 1 0
Rule B 0 1 0 0 1 0 0 0
Rule C 1 0 0 0 0 0 0 1
Table 4: Rule deployment: Example I.
Rules Rule A Rule B Rule C
IDS 1 0 0 1
IDS 2 0 1 0
IDS 3 0 0 0
IDS 4 0 0 0
Table 5: Rule deployment: Example II.
Rules Rule A Rule B Rule C
IDS 1 0 0 0
IDS 2 0 0 0
IDS 3 0 0 0
IDS 4 0 0 1
Table 6: Rule deployment: Example III.
Rules Rule A Rule B Rule C
IDS 1 0 0 0
IDS 2 1 0 0
IDS 3 0 1 0
IDS 4 0 0 0
proach, each individual in the population represents
a potential solution, and the fitness of each individ-
ual is driven by the optimization function. Selection,
crossover, and mutation operators are applied to the
population iteratively to generate better solutions over
generations. The GA continues until a termination
criterion is met, such as reaching a maximum number
of generations or convergence to a satisfactory solu-
tion. Finally, the best solution found by the GA can
be used as the solution to the optimization problem.
Initial Population. The initial population consists of
a set of individuals, where each individual represents
a potential solution to the optimization problem. In
our case, each individual corresponds to a set of val-
ues assigned to the binary decision variables x
i j
. To
create the initial population, we can randomly gen-
erate binary vectors of length |D| · |R |, representing
different configurations of deployed rules on IDSs,
Improving the Efficiency of Intrusion Detection Systems by Optimizing Rule Deployment Across Multiple IDSs
541

ensuring diversity in the initial population to explore
a wide range of potential solutions and ensuring that
each solution satisfies the constraints.
Fitness Evaluation. The fitness score assesses the
effectiveness of a solution in detecting attack paths.
A few inherent factors characterizing the quality of a
rule deployment are identified and utilized to formu-
late a fitness evaluation function.
Selection. After completing the fitness evaluation, so-
lutions are chosen for the next generation of the GA.
Solutions with higher fitness values are more likely to
be selected for their potential to produce offspring of
higher quality. For the present scenario, steady-state
selection is used, which not only prioritizes solutions
with higher fitness, but also allows some diversity by
retaining a portion of less fit solutions.
Crossover. Crossover combines genetic information
from selected parent solutions to create new offspring,
mimicking natural reproduction by passing traits from
both parents to the next generation. In this problem,
we use a method called single-point crossover. This
technique randomly selects a point along the solution
and exchanges genetic information beyond that point
between two parent solutions.
Mutation. Mutation introduces random changes in
the genetic information of solutions to maintain diver-
sity within the population. It prevents the GA from
converging too quickly to a sub-optimal solution by
exploring new regions of the solution space. A ran-
dom percentage of genes in the solution are randomly
flipped (mutated) from 0 to 1 or vice versa.
Termination. The termination criterion determines
when the GA stops iterating and returns the best so-
lution found. In our implementation, the termination
criterion is defined as not satisfying the minimum re-
quired improvement in the solution between consec-
utive generations. This criterion ensures that the GA
stops when it reaches a plateau and further iterations
are unlikely to improve the solution significantly.
In our work, we used the Python library Py-
GAD (Gad, 2023) to solve the optimization problem.
6.1 Fitness Factors
Prioritizing the detection of frequently occurring at-
tack steps is crucial for effective rule deployment,
provided that the load constraints are met. The fre-
quency score (FA) for an attack step represents the
count of distinct paths containing that attack step. Ad-
ditionally, if an attack step in an attack path is already
detected, there’s no need to detect another step of the
same path. To account for this, the frequency of po-
tential pairs of attack steps across various paths can
be computed. A good deployment should avoid de-
Figure 5: Example Enterprise Network.
tecting attack step pairs that frequently occur together
and prioritize those that rarely occur together. The
frequency score (FP) for a pair of attack steps is the
count of distinct paths containing that pair.
Deploying a rule on an IDS that cannot observe
the corresponding attack step’s traffic adds to the IDS
load without improving detection. We denote the
count of such useless rules as CUD. The fitness of
a solution, aiming to maximize the detection of attack
paths, can be estimated using the equation:
f = α
1
· e
DAP
+ α
2
·
∑
e
FA
− α
3
·
∑
e
FP
− α
4
·CUD
α
5
Here, DAP represents the number of distinct attack
paths detected, while α
1
to α
5
are tunable parameters.
Relying solely on the DAP value for fitness evaluation
might lead to local maxima. To ensure the selection
of optimal solutions across generations, it’s crucial to
factor in FA, FP, and CUD values. A higher FA value
indicates a better deployment. This is captured by
adding the weighted sum of e
FA
for all detected at-
tack steps to the fitness score. Conversely, a higher
FP value indicates a poorer deployment. This is ac-
counted for by subtracting the weighted sum of e
FP
for all detected attack pairs from the fitness score. Ad-
ditionally, penalizing the deployment of useless rules
and increased IDS load is achieved by subtracting the
weighted CUD value from the fitness score. The im-
pact of FA, FP, and CUD diminishes as the DAP
value becomes significantly high.
7 RESULTS & DISCUSSION
In Figure 5, a relatively large enterprise network is de-
picted. A total of ten potential attack paths are identi-
fied, comprising twenty-five distinct attack steps. Six
IDSs are positioned within the network, each with
identical traffic inspection capacity but varying traffic
SECRYPT 2024 - 21st International Conference on Security and Cryptography
542

Figure 6: Comparison of fitness score only with DAP and
fitness score with DAP, FA, F P, and CUD.
loads. Thirty different IDS rules have been identified
for deployment across these IDSs. Experiments on a
prototype implementation of our approach begin with
an initial population of solutions. Steady-state selec-
tion is used to choose parents, while elitism is main-
tained by carrying the best solutions from the current
generation to the next. As new solutions are gener-
ated, many exceed the IDS capacity and are replaced
with elite solutions from the previous generation.
In Figure 6, the fitness score changes with the in-
crease in the number of detected attack paths (DAP)
in the larger example. If only DAP is used to com-
pute the fitness score, it can lead to local maxima at
the initial stages of the solution. However, incorpo-
rating other factors (FA, FP, and CUD) eliminates
unpromising partial solutions. The figure plots the
number of detected attack paths (major) and the total
number of detected attack steps (minor) on the hori-
zontal axis. Values are shown up to a DAP value of 7;
beyond this, DAP becomes the dominant factor, and
both fitness score equations produce similar results.
8 CONCLUSIONS
In this paper, we formalized the rule deployment
problem within a multi-IDS environment, considering
capacity constraints on individual IDSs. We proposed
an effective strategy for rule deployment by leverag-
ing both the attack graph and the network graph. With
fixed IDS placements assumed, our aim was to maxi-
mize the detection of attack paths directed toward crit-
ical assets. We presented a genetic algorithm-based
solution to identify IDS rule deployments.
While our focus was on fixed IDS positions, fu-
ture plans include expanding this research to optimize
both IDS positioning and rule deployment strategies
concurrently. Given the growing importance of mon-
itoring and early detection of attacks targeting critical
assets, we plan to integrate the criticality of assets into
our analysis. Additionally, future efforts will con-
sider the possibility of attackers evading IDS detec-
tion, thus enhancing the robustness of our approach.
REFERENCES
Albanese, M., Jajodia, S., and Venkatesan, S. (2018). De-
fending from stealthy botnets using moving target de-
fenses. IEEE Security & Privacy, 16(1):92–97.
Babatope, L. O., Babatunde, L., and Ayobami, I. (2014).
Strategic sensor placement for intrusion detection in
network-based IDS. Intl. Journal of Intelligent Sys-
tems and Applications, 6(2):61.
Chen, H., Clark, J. A., Shaikh, S. A., Chivers, H., and No-
bles, P. (2010). Optimising IDS sensor placement. In
Proc. of the 2010 Intl. Conf. on Availability, Reliabil-
ity and Security (ARES 2010), pages 315–320.
Chou, D. and Jiang, M. (2021). A survey on data-driven
network intrusion detection. ACM Comp. Surveys,
54(9):1–36.
Gad, A. F. (2023). PyGAD: an intuitive genetic algorithm
Python library. Multimedia Tools and Applications.
He, K., Kim, D. D., and Asghar, M. R. (2023). Adversarial
machine learning for network intrusion detection sys-
tems: a comprehensive survey. IEEE Communications
Surveys & Tutorials.
Jajodia, S. and Noel, S. (2010). Topological Vulnerability
Analysis, pages 139–154. Springer.
Liao, H.-J., Lin, C.-H. R., Lin, Y.-C., and Tung, K.-Y.
(2013). Intrusion detection system: A comprehensive
review. Journal of Network and Computer Applica-
tions, 36(1):16–24.
Mukherjee, P., Thampi, S. M., Rohith, N., Poddar, B. K.,
and Sen, I. (2023). Detection and hardening strate-
gies to secure an enterprise network. In Proc. of the
19th Intl. Conf. on Information and Systems Security
(ICISS 2023), pages 91–108.
Noel, S. and Jajodia, S. (2008). Optimal IDS sensor place-
ment and alert prioritization using attack graphs. Jour-
nal of Network Syst. Management, 16:259–275.
Sequeiros, J. a. B. F., Chimuco, F. T., Samaila, M. G.,
Freire, M. M., and In
´
acio, P. R. M. (2020). Attack
and system modeling applied to IoT, cloud, and mo-
bile ecosystems: Embedding security by design. ACM
Comput. Surveys, 53(2).
S
¨
onmez, F.
¨
O., Hankin, C., and Malacaria, P. (2022). At-
tack dynamics: An automatic attack graph generation
framework based on system topology, CAPEC, CWE,
and CVE databases. Comput. Secur., 123:102938.
Stafford, V. (2020). Zero trust architecture. NIST special
publication, 800:207.
Venkatesan, S., Albanese, M., Chiang, C.-Y. J., Sapello, A.,
and Chadha, R. (2018). Debot: A novel network-
based mechanism to detect exfiltration by architec-
tural stealthy botnets. Security and Privacy, 1(6):e51.
Venkatesan, S., Albanese, M., and Jajodia, S. (2015). Dis-
rupting stealthy botnets through strategic placement of
detectors. In 2015 IEEE Conf. on Communications
and Network Security (CNS), pages 95–103. IEEE.
Improving the Efficiency of Intrusion Detection Systems by Optimizing Rule Deployment Across Multiple IDSs
543
