
Prediction of Academic Success in a University and Improvement Using
Lean Tools
Kl
´
eber S
´
anchez
1,2
and Diego Vallejo-Huanga
1,3 a
1
Universidad Polit
´
ecnica Salesiana, Production and Industrial Operations, Quito, Ecuador
2
Escuela Polit
´
ecnica Nacional, Basic Formation Department, Quito, Ecuador
3
IDEIAGEOCA Research Group, Quito, Ecuador
Keywords:
COVID-19, Higher Education, Classification Algorithms, Lean Tools, Teaching-Learning Process.
Abstract:
The pandemic of COVID-19 caused several essential challenges for humanity. In the educational sector,
mechanisms had to be quickly implemented to migrate in-person activities to complete virtuality. Academic
institutions and society faced a paradigm shift since modifying the conditions of the teaching-learning system
produced changes in the quality of education and student approval rates. This scientific article evaluates three
classification models built by collecting data from a public Higher Education Institution to predict its approval
based on different exogenous variables. The results show that the highest performance was obtained with the
Random Forest algorithm, which has an accuracy of 61.3% and allows us to identify students whose initial
conditions generate a high probability of failing a virtual course before it starts. In addition, this research
collected information to detect opportunities for improving the prediction model, including restructuring the
questions in the surveys and including new variables. The results suggest that the leading cause of course
failure is the lack of elementary knowledge and skills students should have acquired during their secondary
education. Finally, to mitigate the problem, a readjustment of the study program is proposed along with lean
support tools to measure the results of these modifications.
1 INTRODUCTION
The first cases of the SARS-Cov2 virus were reported
in Latin America around February 2020. The pan-
demic caused many changes in several areas, such as
health, economy, education, information and commu-
nication technologies (ICT), etc. This paradigm shift
generated new challenges for higher education, not
only from the teaching aspect but from the general
perception of the student body in the face of the crisis.
Around 1.5 billion students from almost 200 countries
had to confine themselves to their homes, completely
changing their study and social interaction habits and
mechanisms. Thus, video conferences replaced the
modality change in classes, academic tutorials, and
face-to-face seminars. Therefore, changes had to be
made in the evaluation methodologies to adapt them
to the virtual modality. In addition, changes in the
administrative activities of educational centers modi-
fied the activities of dispersion and an emerging eco-
nomic crisis, causing alterations in the academic per-
a
https://orcid.org/0000-0002-2704-3858
formance of several students (Aristovnik et al., 2020).
In this context, the change from face-to-face ac-
tivities to virtual ones represented an enormous chal-
lenge for all Higher Education Institutions (HEIs).
The HEIs had to implement emergency plans for on-
line education, which require a highly dependent link-
age of technological and digital resources, limiting
education to only a sector of the student body. Thus,
the inequality gap between students increased, defin-
ing segments between those with access to the Inter-
net and adequate electronic devices and between stu-
dents who do not have these resources. Furthermore,
it was evident that some students with technologi-
cal resources cannot self-regulate or establish self-
education methodologies (Rashid and Yadav, 2020).
The reforms and new implementations have mod-
ified the teaching-learning process and the satisfac-
tion of interested parties regarding service quality.
Quality measurement in the service sector is not triv-
ial since many variables are sometimes impossible to
control. However, it is one of the fundamental as-
pects in the management of service operations. Tools
such as Lean Manufacturing are techniques geared to-
Sánchez, K. and Vallejo-Huanga, D.
Prediction of Academic Success in a University and Improvement Using Lean Tools.
DOI: 10.5220/0012815400003756
Paper published under CC license (CC BY-NC-ND 4.0)
In Proceedings of the 13th International Conference on Data Science, Technology and Applications (DATA 2024), pages 513-521
ISBN: 978-989-758-707-8; ISSN: 2184-285X
Proceedings Copyright © 2024 by SCITEPRESS – Science and Technology Publications, Lda.
513

wards continuous quality improvement (Doolen et al.,
2008); for example, in industries that use Kaizen phi-
losophy, an awareness of shared responsibility is pro-
moted between collaborators and employers, continu-
ally considering the impact of activities executed cor-
rectly and efficiently.
During the health emergency, several teachers had
to train and implement various forms of knowledge
transfer adapted to online training, as educational in-
stitutions had to rapidly migrate to digital platforms
and resources. However, the online modality lim-
its close contact between teachers and students, so it
is problematic for teachers to know the student’s re-
sponse to the in-class teaching methodology.
In active learning, the student is the protago-
nist in the acquisition of knowledge. For (Theobald
et al., 2020), through an exhaustive search and anal-
ysis of several studies carried out with students in
the disciplines of Science, Technology, Engineer-
ing, and Mathematics (STEM), evidenced a reduc-
tion in achievement gaps in exam scores and ap-
proval of graduation rates by 33% and 45%, respec-
tively. The analysis compared students represented
by active learning versus students who received the
subject in a traditional classroom. In (Abdulwahed
et al., 2012) a set of techniques associated with the
reform of mathematical education is compile, among
them, student-based methods, real-world examples,
strategies to correct gaps in basic knowledge and ap-
proaches in different forms of learning.
According to (Acero et al., 2020), students could
have a divided perception about the implementation
of ICT and online education in learning. In the study
carried out during the COVID-19 pandemic, a sam-
ple of 52 secondary and high school students was an-
alyzed, where almost 40% of the students reported
having put a lot of effort into online classes, with vol-
untary reinforcement in watching video engravings.
Similarly, around 50% of the respondents agree that
the use of digital platforms benefits their learning;
however, 60% report tension in online assessments.
Although online teaching methods show sev-
eral advantages for teaching-learning processes, their
rapid implementation during the pandemic limited
their effectiveness. Adopting sudden and unexpected
changes can influence the quality of education. When
migrating from a face-to-face modality to an online
one, it is recognized that the level of effects may
be a function of several components, such as techni-
cal infrastructure, accessibility, field of study, com-
petencies, learning pedagogies, and degree of im-
plementation in HEIs before the pandemic. Fur-
thermore, between 50% and 60% of the respon-
dents said that teachers have little or no competency
in videoconferencing, social networks, collaborative
tools, cloud repositories, multimedia editors, gam-
ification and real-time response systems (Marinoni
et al., 2020)(Torres Mart
´
ın et al., 2021).
The implementation of e-learning requires a deep
commitment of the students. In (Jamalpur et al.,
2021) mentions that before the pandemic, only 19%
of the students self-studied for more than four hours,
while during confinement, this percentage increased
to almost 40%. Additionally, they propose that on-
line programs are successful if learning environments
are healthy and there is institutional and family sup-
port. Likewise, (S
´
anchez-Almeida et al., 2021) con-
cluded that students in vulnerable conditions, assisted
by follow-up educational programs and financial aid,
significantly improve student performance. The study
revealed that the students who assisted through a pilot
academic program obtained a percentage of approval
of 46.3%. In contrast, the group that did not have sup-
port and monitoring obtained a percentage of 12.2%.
Some approaches propose combining lean tools
with new educational paradigms and their effective-
ness analysis. The research by (Hasan et al., 2020)
asserts that higher education must be able to promote
self-learning and updating in students. The article fo-
cuses on the design of learning methods for engineer-
ing students in Industry 4.0. Also these techniques are
combined with predictive analysis models to forecast
the performance and approval of a course (Buena
˜
no-
Fern
´
andez et al., 2019) (Lu et al., 2018).
Taking into account this background, this scien-
tific article aims to generate a predictive model that
explains university student approval in the context of
the COVID-19 pandemic by analyzing the variables
that significantly influence the teaching process. Fi-
nally, with these results, continuous improvement ac-
tions are proposed and framed in the Kaizen philoso-
phy. As the conditions for the teaching-learning pro-
cess have changed, a change in student passing and
dropout percentages is expected.
2 MATERIALS AND METHODS
2.1 Data Collection Methodology and
Design
The data belongs to students from an Ecuadorian pub-
lic HEI located in the city of Quito. The institution
has been in continuous operation for approximately
88 years. It trains professionals in the areas of en-
gineering, sciences, and administrative sciences and
also offers programs in the area of higher technol-
ogy. For all academic offerings, students at this IES
DATA 2024 - 13th International Conference on Data Science, Technology and Applications
514

must pass a specific leveling course for each location.
This course aims to homogenize the basic knowledge
of students who have completed secondary education.
With the approval of the course, the previously chosen
university career begins. The students of this course,
for the most part, are between 16 and 21 years of age.
This age group is made up of approximately 60% men
and 40% women. On the other hand, historically, the
students of this HEI belong to various economic sec-
tors, the majority from the lowest economic quantiles.
This research considers the data obtained between
the 2020A and 2021B periods corresponding to the
first and second semesters of each course for Engi-
neering and Sciences (CNIC) year. In these periods,
there are two relevant particularities. The first is char-
acterized by the challenges that the migration from
face-to-face to virtual activities presented to the ed-
ucational sector due to the global pandemic caused
by COVID-19, and the second, framed in an increase
in the percentage of students admitted to the univer-
sity from 24.7% to 55.6% at the end of the 2021B
semester due to the Affirmative Quotas Action Pol-
icy (PCAA). The PCAA program was implemented
in 2014 under state policy through the National Lev-
eling and Admission System for public HEIs in fa-
vor of historically discriminated groups (SENESCYT,
2021). Students of this program are admitted to the
institution even when their application grade is lower
than the average in the general population. This lower
academic performance is influenced by previous aca-
demic deficiencies and the socioeconomic vulnerabil-
ity situation that characterizes this group.
In this scientific article, data were collected from
a sample of CNIC students from the Fundamentals of
Chemistry chair, who have an academic load of con-
tact with the teacher of 6 hours weekly. The subject
is developed within a theoretical component; it does
not contemplate laboratory practices to develop ex-
perimentation skills. The data was obtained through
surveys generated in Microsoft Forms, which allows
for linking the institutional email of each student and
avoiding identity theft. The questions asked students
for data about issues related to geographic location,
availability of digital and electronic resources, con-
nectivity, and information about the home academic
environment. The questionnaire was designed to mea-
sure the speed and stability of the students’ Internet to
attend the videoconferences of the master classes.
2.2 Dataset Description
The questionnaire contained 22 open and closed ques-
tions. The answers could be alphanumeric for open-
ended questions, while for closed questions, the an-
swers could be multiple or single-choice. For one of
the questions, a Likert scale was used. The dataset,
generated from the responses to the questionnaire,
consists of 621 instances I
k
(k = 1,...,621) and 15
variables (attributes), of which 11 are qualitative and
four are quantitative. Two quantitative variables are
discrete, and the other two are continuous. To develop
the model, those variables that could be included in
a predictive analysis are considered based on previ-
ous related work in the scientific literature. Thus,
the dataset was reduced to 13 independent variables
X
j
( j = 1, ...,13), maintaining the same number of
621 instances and a dependent variable of continuous
quantitative type Y
i
that shows the passing grade N
A
obtained by the student; this variable will be modified
later as a binomial class defined by y (State).
Table 1: Coding of qualitative variables and description of
the states of the data set.
Variable
Description of
the variable
States
x
1
City
71 cities
x
2
Computer
Yes, No, Share
x
3
Availability
of computer
shared
1 - 5
x
4
Devices
multimedia
Web camera,
Microphone,
Sound in
the computer,
External Audio
x
5
Internet Yes, No
x
9
Smartphone with
messaging apps
Yes, No
x
10
Smartphone with
functional camera
Yes, No
x
11
Noise level
Silent, low,
medium, high
x
12
Lighting level Low, medium, high
x
13
Problems during
videoconference
Yes, No
y
State
Approved,
Retired, Failed
The course is developed in two bimesters, whose
final grades B1 and B2 can reach 10 points each. To
obtain N
A
, two scenarios must be considered: i) when
(B1+B2) < 9∨(B1+B2) ≥ 14 → N
A
= (B1 +B2)/2.
The student is considered to pass if (B1 + B2) ≥ 14
and fail if (B1 + B2) < 9; ii) the other scenario hap-
pens when 9 ≤ (B1 + B2) < 14, in this case, the stu-
dent must take a final exam (Ex
f
). If Ex
f
> B1 ∨
Ex
f
> B2, Ex
f
will replace the lowest grade and, as
in the first scenario, N
A
will be an average of the re-
sulting grades. In the latter case, to pass, the sum of
the updated grades must be (B1
u
+B2
u
) ≥ 12, as long
as the grade is obtained in Ex
f
> 6.
The structured dataset is presented in matrix for-
Prediction of Academic Success in a University and Improvement Using Lean Tools
515

mat k × ( j + 1). The data was cleaned and consol-
idated into a Comma Separated Values (CSV) for-
mat file. Since the information on the IES is confi-
dential, the names of the students surveyed are kept
confidential and the data collected has been masked
at the instance and attribute level. The final dataset
has been published in the GitHub code repository and
is available at the following URL: https://github.com/
dievalhu/student approval prediction. Table 1 shows
the coding and description of the qualitative variables
for the dataset collected during the 2020A and 2021B
academic periods. Table 2 shows the coding of the
quantitative variables of the dataset, along with their
mean, standard deviation, and operating range.
Table 2: Coding of quantitative variables and statistical de-
scription of the data set.
Variable
Description of
the variable
Range
Mean
x
6
Download
speed (Mbps)
0.19 - 150 22.61 ± 22.22
x
7
Devices
concurrent
online (und)
0 - 15 5 ± 2
x
8
Estudents
at home (und)
0 - 7 2 ± 1
2.3 Data Preprocessing and Modeling
The models use y as a response variable when N
A
≥ 7
takes the state Approved; on the other hand, if N
A
< 7,
the state is designated as Failed. Additionally, sup-
pose that the student has not appeared to take the sum-
mative exam of the first and/or second semester. In
that case, they are considered Retired, and there are
only 118 instances in the dataset. However, to avoid
losing these data, these instances were replaced by the
state Failed, since, for practical purposes, both states
represent that the student did not pass the course.
To validate the results, we used a random cross-
validation methodology. The training partition al-
lows models to estimate approval predictions. The
test partition allows us to evaluate the model obtained
in training. The instances used for the training and
testing phase were taken randomly, with a proportion
of 70% and 30%, respectively. A preliminary test
showed instances with states in the training partition
that were not in the test partition or vice versa. For
example, for the variable x
1
, there were cities with a
frequency of a single observation, making it impos-
sible to have that city in both partitions of the mod-
eling process. Therefore, the different towns were
grouped by province. However, when doing so, the
most significant number of instances were located in
the province of Pichincha. It was decided to remove
the variable x
1
from the model to avoid biases. Simi-
larly, in the variable x
2
, the state Shared was replaced
by Yes, given that both states represent a student with
a computer at home. Based on this last premise, the
variable x
3
was eliminated since it depends on the
state Shared eliminated in x
2
.
The predictive classification model will use the
parameters linked to the input variables of the algo-
rithm to determine whether or not a student will pass
the course. The predictions will allow the student to
be suggested to improve specific parameters that in-
crease their chances of passing the course before it
starts. Then, the final classification model uses all
quantitative variables from Table 2 and eight quali-
tative variables from Table 1.
2.4 Prediction Models and Performance
Evaluation
Three classification algorithms were trained for the
prediction process. The first was the statistical logistic
regression model that allows us to estimate the proba-
bility that the student passes (1) or fails (0) depending
on the initial conditions with which the student begins
their learning process. The second one, Random For-
est, is an assembled bagging classification algorithm
based on the prediction of the majority vote of a set
of decision trees that allow one to predict whether or
not a student will pass the CNIC. In this study, the
algorithm generated 500 decision trees to analyze the
compliance of the classification rule. Finally, we use
a Support Vector Machine (SVM) as a classification
model where each instance is treated as a vector in a
high-dimensional space. For the case study, a radial
kernel function performs a change of basis, which al-
lows the vectors to be transformed into points on a hy-
perplane that optimally separates the data of the two
classes. The output of the classification model is de-
termined by a boolean, where 0 represents a failed
student, and 1 represents a passed student.
Four metrics were selected to measure the perfor-
mance of the results of these algorithms: i) Accuracy
(Acc), ii) Recall (Re), iii) Precision (Pr), and iv) F1-
score (F1). All metrics are normalized between 0 and
1, where 0 is the worst case, and 1 is the best.
2.5 Proposal for Continuous
Improvement Using Lean Tools
The results of the model allow us to know, in ad-
vance, the attributes that the student could strengthen
before starting the course. Using the prediction al-
gorithm, we would establish specific guidelines that
would help increase the student’s chances of passing.
For example, recommended values regarding Internet
DATA 2024 - 13th International Conference on Data Science, Technology and Applications
516

download speed or possible adaptations to the phys-
ical space where students will develop their learning
could be recommended. However, it should be taken
into account that the CNIC group corresponds, for the
most part, to students with low economic resources.
Therefore, it is likely that several of the recommenda-
tions obtained from the predictive model could not be
implemented in reality, given that they depend on so-
cioeconomic factors. Therefore, continuous improve-
ment must also address other aspects.
2.5.1 Classification Model Fitting
The continuous improvement program could con-
tribute to strengthening the prediction model by al-
lowing the inclusion of other potentially relevant vari-
ables. A second survey was carried out to find
these variables in the following two academic cycles
(2022A and 2022B). Students were asked for data on
several aspects, including their enrollment number,
whether they plan to study, work, or do both during
the academic period, and their preferences regarding
the type of study, among others. Additionally, the
possible reasons contributing to the failure in the pre-
vious academic period of second enrollment students
were consulted, i.e., those who did not pass the CNIC
the last semester and chose to retake it.
The adjusted model would allow problems to be
identified before the start of the course. Likewise, it
could detect the most vulnerable students and, based
on their characteristics, implement helpful mecha-
nisms during the academic period.
2.5.2 Continuous Improvement in the
Teaching-Learning Process
It is important to note that multiple factors affect the
result of the teaching-learning process, such as fac-
tors associated with the student, the teacher, and the
learning environment. Therefore, a comprehensive
improvement plan in education should not only in-
clude a forecast model that identifies some initial is-
sues, but it is also necessary to understand several as-
pects linked to a holistic learning environment.
Two approaches were addressed to identify and
understand the problem. The first was an analysis by
the CNIC’s Fundamentals of Chemistry chair teachers
using the 3W2H question method. The technique’s
objective is to know the development of teachers’ ed-
ucational practices and their critical aspects. The sec-
ond approach involves the review of data provided
by 107 second-enrollment students. This information
provides the main reasons for the students to repeat
the course. To analyze these causes, a Cause-Effect
Diagram and the Pareto 80-20 rule were used.
2.5.3 Future Proposal for Continuous
Improvement
The action research method will decide what type of
improvements can be implemented. This methodol-
ogy allows us to describe, understand, and analyze a
phenomenon, in this case, the teaching-learning pro-
cess, during its development and influence its charac-
teristics (Coughlan and Coghlan, 2002). In general,
the continuous improvement proposal will take sev-
eral aspects related to the philosophy of Kaizen men-
tioned by Kregel (Kregel, 2019) and adapt them to the
reality of the CNIC. Continuous course improvement
will be based on various evaluations by teachers and
students. However, the latter may generate contro-
versy. In (Dowell and Neal, 1982) listed many critical
and skeptical opinions about this type of evaluation,
however, they also ensure that its application could
improve courses that require more frequent feedback.
The future improvement plan will cover several
phases following the Plan-Do-Check-Act (PDCA) cy-
cle. First place, the results of an evaluation diagnostic
are considered to know the characteristics of the stu-
dents and their degree of prior knowledge.
Secondly, once the course chapters have been
completed, questions will be asked as online surveys
so that, anonymously, the students respond about their
perception of the topics. The surveys would reveal
difficulties in understanding the topics covered, and
these findings would help adapt parts of the lecture’s
content. Then, in the days following the survey, in
cordial environments, students will be encouraged to
reflect with the teacher on the learning dynamics and
provide objective feedback.
As a third aspect, before starting the next unit, the
teacher will reflect briefly, presenting a summary of
the evaluations and comments results. Additionally,
if the teacher disagrees with a statement made by the
students, the reflection spaces will allow them the op-
portunity to express their point of view. In (Diamond,
2004) asserts that intermediate feedback significantly
improves the quality of the course. Therefore, the
fourth aspect implies that the teachers will evaluate
the exams for the first and second two months to en-
sure appropriate evaluation instruments are used.
3 RESULTS AND DISCUSSIONS
To have a general understanding of the distribution
of the quantitative independent variables that were in-
volved in the model, a box and whisker plot was cre-
ated with all the normalized data.
Figure 1 shows the three quantitative variables
Prediction of Academic Success in a University and Improvement Using Lean Tools
517

Figure 1: Box and whisker plot of the independent quanti-
tative variables obtained from the data of the first survey.
used in the model. The diagram’s purpose is to com-
pare the distribution of the data. It is observed that
there are scattered data that exceed the average by a
factor of two or greater; these values could become
relevant for the model since they stand out from the
rest. However, there could also be a problem segment-
ing the partitions for testing and training.
One possibility to improve the models’ perfor-
mance lies in transforming these quantitative vari-
ables into categorical variables according to ranges
and assigning weights to them as a hierarchy. The
ranges would be established according to expert cri-
teria or standards. These modifications would allow
the algorithm to find existing correlations instead of
identifying them with scattered data. The data also
indicate that nearly 80% of students have a camera
and microphone, which are fundamental devices for
synchronous online education; however, around 100
students, representing approximately 15% of the sam-
ple, do not have these devices.
The city variable presents 74.2% of the data in the
capital of Ecuador, Quito, and the rest is distributed
in 70 cities. It must be considered that not all territo-
ries in the country have the same quality of Internet
access, so this variable could be relevant, although, in
our model, it was excluded. The data analysis sug-
gests that this question should be modified in the sur-
vey; instead of asking about the location, one could
have a category of two states, urban and rural zones.
Another modification that can be made to the sur-
vey to improve the data obtained is related to the vari-
ables x
11
and x
12
. The two variables can be unified
into a single question that inquires about the pos-
session or absence of physical space designated ex-
clusively for studying. Furthermore, the volume of
respondents must be increased to avoid eliminating
states in the categorical variables, as was done for x
2
and y.
3.1 Model Performance
The performance evaluation metrics of the different
models evaluated in the 186 test instances are shown
in Table 3.
Table 3: Performance metrics of the classifications models.
Model
Logistic
Regression
Random
Forest
SVM
Acc 0.4839 0.6129 0.6129
Re 0.3611 0.3056 0.0000
Pr 0.3421 0.5000 —-
F1 0.3514 0.3793 —-
The Logistic Regression model has an Acc of
0.4839. This value can be interpreted as an approx-
imate accuracy of 50%, that is, the model has little
reliability because the prediction can be attributed to
simple randomness. The Re and the Pr are around
36% and 34%, respectively. These percentages could
be considered insufficient, so they cannot be reli-
able. Based on these metrics, the Logistic Regression
model is ruled out as a valid tool to forecast these data.
In Random Forest the Acc is around 61%, which
can be considered a good prediction given the nature
of the variables. Most of the variables in the model
are qualitative; therefore, the relevance of many of
them or the whole could be interpreted subjectively
for the vision of the teacher/student. The relatively
low values of Re and Pr 30.56% and 50% respectively
do not discredit the reliability of the model since it is
not only attractive to detect students with chances of
passing but it is also essential, or even more, to detect
students with a high probability of failing the CNIC.
Finally, when analyzing the metrics of the SMV
model, it is concluded that this model with these data
cannot predict the passing students (Re equal to zero).
Consequently, the values of Pr and F1 remain indeter-
minate. In this algorithm, the Acc is 61.29%, equaling
the performance of the Random Forest model.
The Random Forest and SVM models have the
same performance in the Acc metric, but only the Ran-
dom Forest model can predict to the approved and
reproved with the same performance value. Conse-
quently, based on the arguments presented, this last
classification algorithm is the best forecast option.
3.2 New Variables to Consider for
Model Adjustment
Adding other variables to the model could help im-
prove its performance, e.g., students belonging to
second enrollment, which for the dataset represents
31.5%, could have a greater probability of passing
compared to new students. Likewise, a similar per-
DATA 2024 - 13th International Conference on Data Science, Technology and Applications
518
centage of students did not choose their current career
as their first choice of study. This fact could influence
motivation throughout the academic period. On the
other hand, a segment of approximately 20% affirms
that they have family problems that negatively affect
their academic performance.
Finally, an 83.5% of students prefer in-person
classes. This variable could not be included within the
model, but in a future study, the performance of the
students with a preference towards the virtual modal-
ity could be investigated.
3.3 Continuous Improvement in the
Teaching-Learning Process
The 3W2H methodology followed by the professors
of the Fundamentals of Chemistry shows that the
underlying problem is that the failure rate among
CNIC students exceeds the passing rate. This prob-
lem causes the demand for students in the courses
that initially had assigned places to decrease, and ac-
tions should focus on training students to acquire an
appropriate level of skills and knowledge that guar-
antee academic. To identify the level of skills and
knowledge, it is necessary to detect critical problems
through collaboration and exchange of experiences
between the department professors.
The joint analysis made it possible to detect sev-
eral barriers. The most important lies in the lack of
basic knowledge and skills that students should have
acquired during their secondary education and that,
for some reason, they did not do so. Although the ob-
jective of the CNIC is to level applicants’ knowledge
of the careers offered by the IES, its function is not
to provide secondary education from the beginning.
Instead, the CNIC seeks to strengthen the knowledge
previously acquired during secondary education.
Based on these arguments, the professors of the
Fundamentals of Chemistry chair mentioned poor
reading comprehension among the poorly developed
elementary knowledge and skills, and the student
faces challenges when reading aloud fluently and pre-
cisely. Limited competence in basic arithmetic, al-
gebra, and trigonometry, reduced ability to use a cal-
culator. Most students have a rote and poorly reflec-
tive learning style and a low ability to recognize the
meaning of physical or chemical quantities and mag-
nitudes. Furthermore, class participation by students
is sporadic; finally, it was detected that many students
took advantage of the virtual modality to commit acts
of academic dishonesty. The teachers’ point of view
of the problem is essential, as is the students’ view.
Within the GitHub code repository, where the datasets
were stored, the analysis of the rest of the factors and
points of view as causes of failure is also shown.
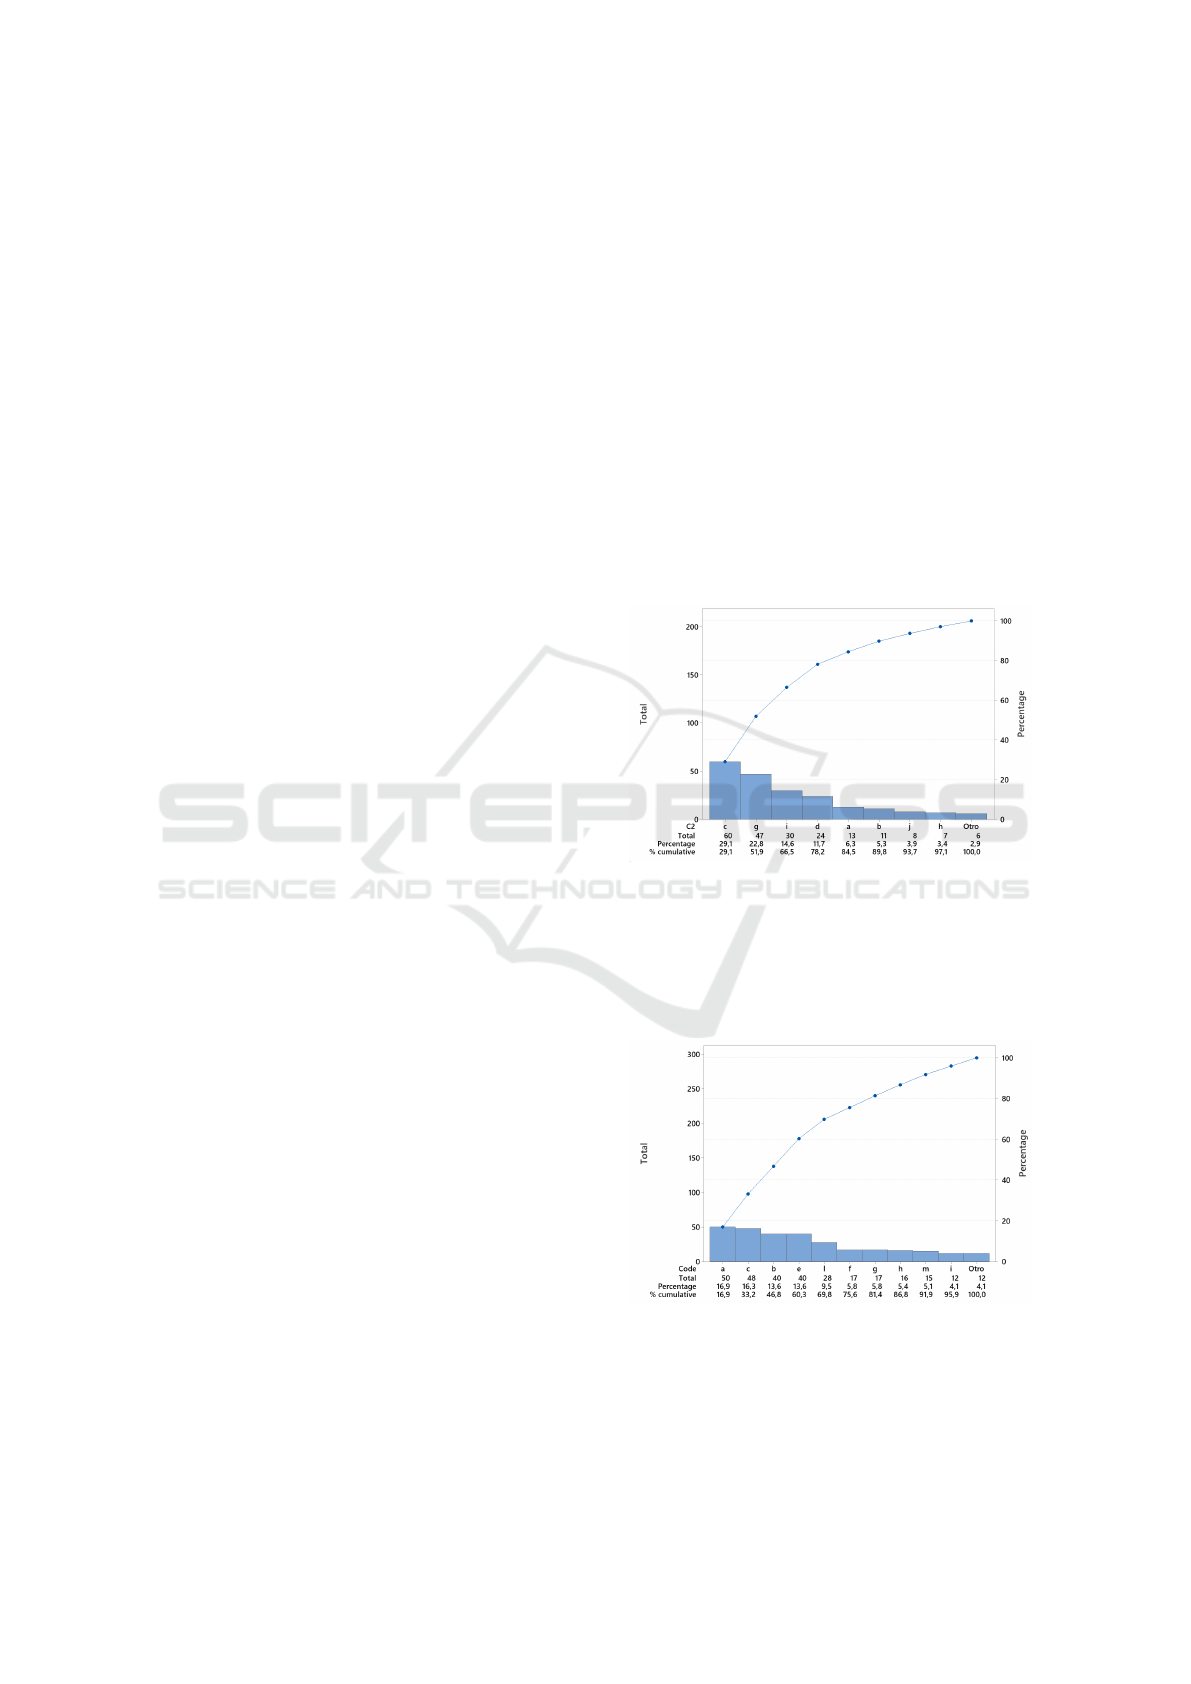
Figures 2 and 3 illustrate the Pareto diagrams that
show students’ points of view obtained after process-
ing the data provided through a survey by second-
enrollment students. The analysis identifies that the
first cause of repetition of the CNIC, with an inci-
dence of 29.1%, is poor secondary education aca-
demic training. Likewise, it is established that the
leading cause of repetition of the Fundamentals of
Chemistry subject with 16.9% is the lack of commit-
ment on the part of the student, which, together with,
once again, the poor academic training of secondary
education. They register a cumulative 33.2% of the
problems. Therefore, it can be assured that the men-
tioned causes must receive priority to resolve 80% of
the issues. Once improvement actions focused on mit-
igating these triggers are taken, repetition rates could
be expected to decrease.
Figure 2: Pareto diagram of the causes of loss of the
semester according to second enrollment students.
The poor academic training in secondary instruc-
tion could explain why some students do not under-
stand the subject and perceive that the time spent on
evaluations is insufficient.
Figure 3: Pareto diagram of the causes of loss of the Fun-
damentals of Chemistry subject according to second enroll-
ment students.
By combining the positions of students and teach-
ers, both agree on identifying the main problem.
Prediction of Academic Success in a University and Improvement Using Lean Tools
519
Therefore, the deficient previous academic training
is closely related to the findings found in the 3W2H
analysis. The lack of this basic knowledge and skills
could have been caused, among other factors, by a
health emergency caused by the COVID-19 pandemic
since, during this event, there were several challenges
for the educational sector and, to a greater extent, for
students in vulnerable conditions and those who have
limited economic resources. Therefore, an adaptation
to the curricular programs must be considered to con-
tribute to the solution.
Senior management made adaptations in a new
Subject Study Plan (PEA). To propose the reform in
the subject of Fundamentals of Chemistry, the author-
ities appointed a delegate from the Faculty of Chemi-
cal Engineering and Agroindustry who, in collabora-
tion with the professors of the CNIC who are part of
the chair, carry out the reforms. In this new curricu-
lum, the number of hours of contact with the teacher
was reduced from 24 to 20, and a chapter dedicated to
measurement systems, types of units, basic calcula-
tions, and magnitude transformations was also incor-
porated. On the other hand, the new PEA addresses
the topics that are in sequence with the first semester
programs and are of greater relevance. The reform
eliminates the topics that are less concatenated or re-
thinks them to be developed in a condensed manner.
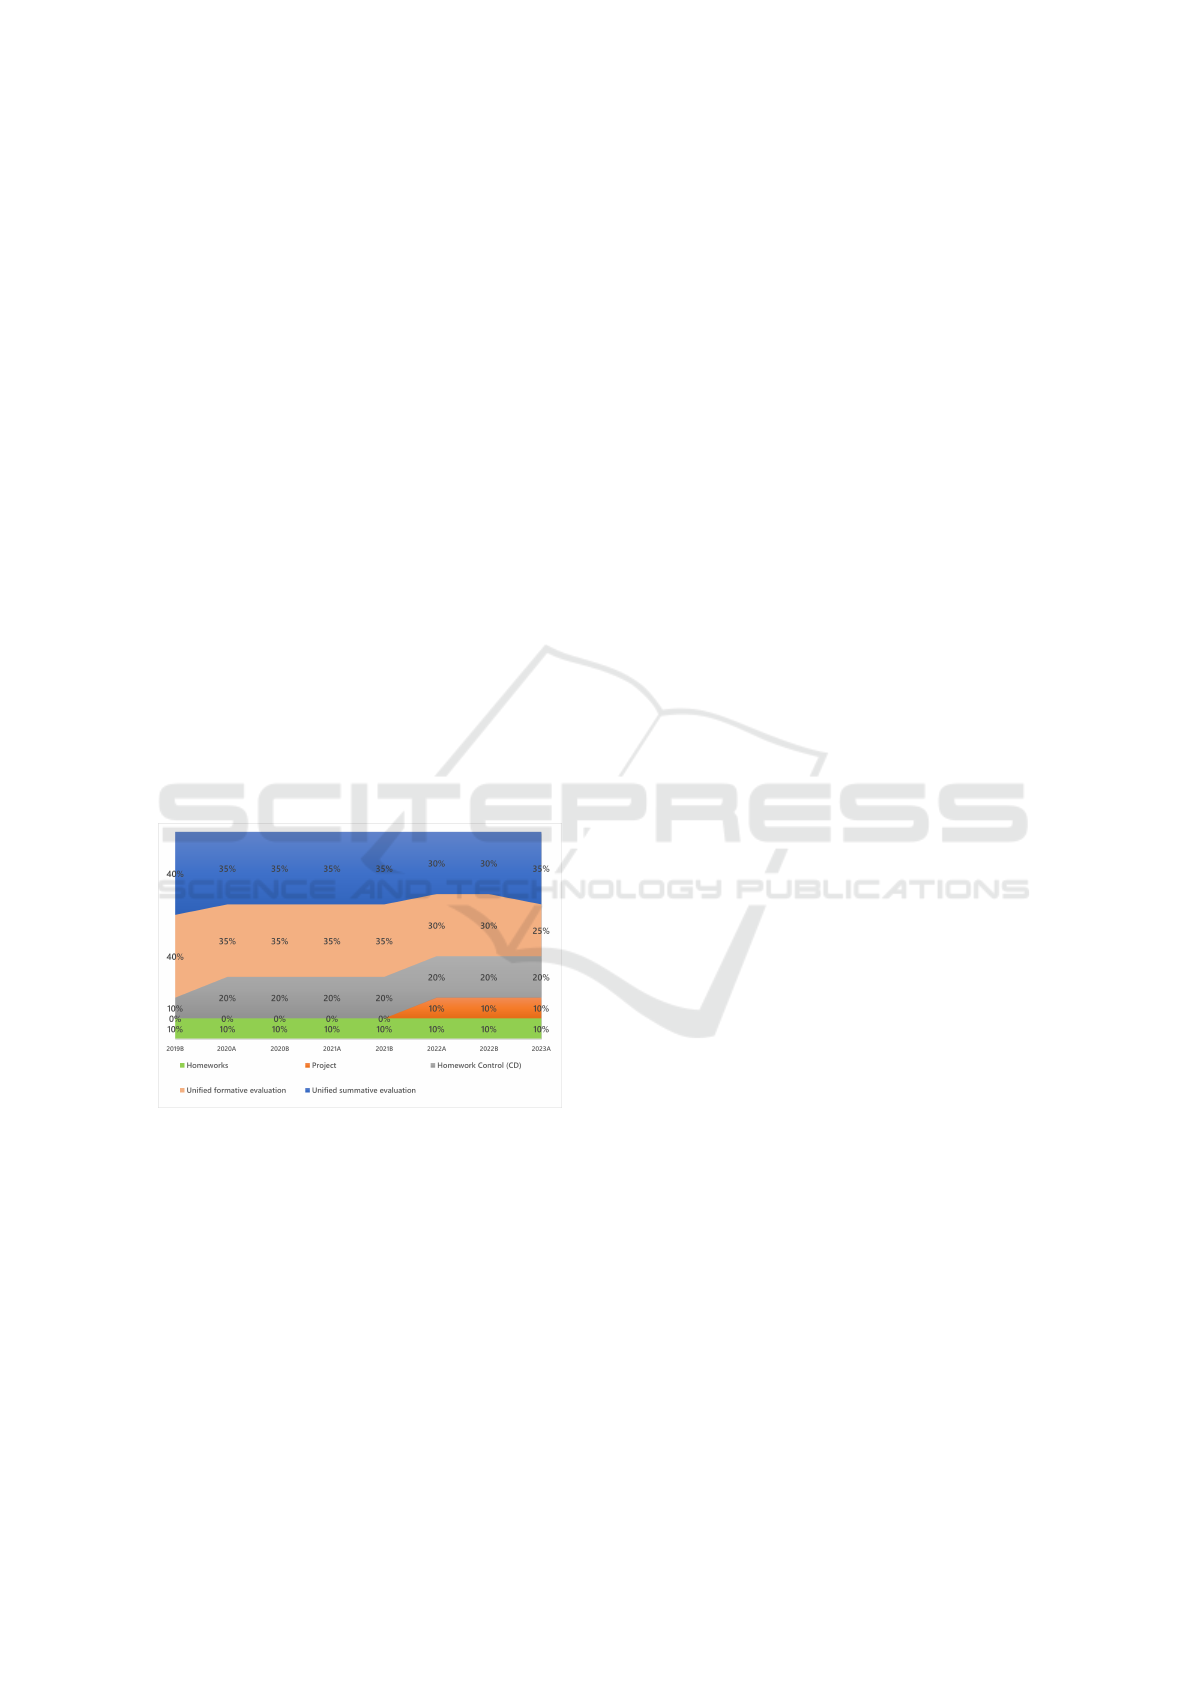
Figure 4: Evolution over time of the weightings of the eval-
uation elements in the bimonthly qualification.
At the same time, the problems were identified
and work was being done on the new PEA. The pro-
fessors of the chair decided to redistribute the weight-
ing of the grades. Figure 4 describes these changes
and their evolution over time. The 2019B semester
corresponds to the weighting before the health emer-
gency. These decisions were made to introduce di-
versity into the evaluation elements and increase the
scarce social interaction generated by the health cri-
sis. Additionally, starting in the 2020B period, the
use of ICT was active.
It is essential to highlight that students mention
their lack of commitment as a critical aspect, which
could be strongly influenced by the pandemic that
triggered the accelerated implementation of the vir-
tual modality. Finally, there was deep reflection
and acquisition of applicable knowledge even once
the COVID-19 pandemic was over. Therefore, the
progress in the use of ICT cannot be wasted in the
teaching-learning process, which is why the IES in-
vested in the modernization of classrooms. The learn-
ing in this period was also helpful in identifying the
ICT tools that teachers need to face the challenges
in their daily work. However, experience establishes
that in the future, they must also do so in pedagogi-
cal skills, rhetoric, structuring of ideas, feedback, and
cooperation.
4 CONCLUSIONS AND
LIMITATIONS
This paper used three classification algorithms to pre-
dict the approval of students of the CNIC developed in
virtual mode at a public HEI. The data for modeling
included factors related to the availability of digital
and electronic resources, Internet access, and infor-
mation about the home environment. The best result
was the Random Forest model, with an approximate
accuracy of 61% and most of the predictor variables
being qualitative. The prediction information will al-
low the student to be suggested to improve specific
parameters that increase their chances of passing the
CNIC before starting.
To undertake a continuous improvement of the
teaching-learning process, it was detected through a
3W2H analysis and a Pareto Diagram that the leading
cause of failure in the CNIC is the lack of knowledge
and elementary skills that students should have ac-
quired during their secondary education. The possible
origin of the problem is the pandemic generated by
COVID-19. This situation posed several challenges
for the educational sector, especially for students in
situations of socio-economic vulnerability. To solve
the problem, this research proposes alternatives such
as changing the rating weights, diversifying the eval-
uation elements, and actively including ICT. Further-
more, while these changes are being applied, propose
and design the new study plan based on the academic
needs of the interested parties. Likewise, this work
ends with a proposal for future continuous improve-
ment.
DATA 2024 - 13th International Conference on Data Science, Technology and Applications
520

ACKNOWLEDGEMENTS
This work was supported by IDEIAGEOCA Research
Group of Universidad Polit
´
ecnica Salesiana in Quito,
Ecuador.
REFERENCES
Abdulwahed, M., Jaworski, B., and Crawford, A. (2012).
Innovative approaches to teaching mathematics in
higher education: a review and critique.
Acero, J. M. A., Coca, M. M., and Coca, D. M. (2020).
Motivaci
´
on de alumnos de educaci
´
on secundaria y
bachillerato hacia el uso de recursos digitales durante
la crisis del covid-19. Revista de Estilos de Apren-
dizaje, 13(Especial):68–81.
Aristovnik, A., Ker
ˇ
zi
ˇ
c, D., Rav
ˇ
selj, D., Toma
ˇ
zevi
ˇ
c, N., and
Umek, L. (2020). Impacts of the covid-19 pandemic
on life of higher education students: A global perspec-
tive. Sustainability, 12(20):8438.
Buena
˜
no-Fern
´
andez, D., Gil, D., and Luj
´
an-Mora, S.
(2019). Application of machine learning in predict-
ing performance for computer engineering students:
A case study. Sustainability, 11(10):2833.
Coughlan, P. and Coghlan, D. (2002). Action research for
operations management. International journal of op-
erations & production management, 22(2):220–240.
Diamond, M. R. (2004). The usefulness of structured mid-
term feedback as a catalyst for change in higher edu-
cation classes. Active Learning in Higher Education,
5(3):217–231.
Doolen, T. L., Van Aken, E. M., Farris, J. A., Worley, J. M.,
and Huwe, J. (2008). Kaizen events and organiza-
tional performance: a field study. International jour-
nal of productivity and performance management.
Dowell, D. A. and Neal, J. A. (1982). A selective review of
the validity of student ratings of teaching. The Journal
of Higher Education, 53(1):51–62.
Hasan, M. Z., Mallik, A., and Tsou, J.-C. (2020). Learning
method design for engineering students to be prepared
for industry 4.0: a kaizen approach. Higher Educa-
tion, Skills and Work-Based Learning.
Jamalpur, B., Chythanya, K. R., Kumar, K. S., et al. (2021).
A comprehensive overview of online education–
impact on engineering students during covid-19. Ma-
terials Today: Proceedings.
Kregel, I. (2019). Kaizen in university teaching: continuous
course improvement. International Journal of Lean
Six Sigma.
Lu, O. H., Huang, A. Y., Huang, J. C., Lin, A. J., Ogata, H.,
and Yang, S. J. (2018). Applying learning analytics
for the early prediction of students’ academic perfor-
mance in blended learning. Journal of Educational
Technology & Society, 21(2):220–232.
Marinoni, G., Van’t Land, H., Jensen, T., et al. (2020). The
impact of covid-19 on higher education around the
world. IAU global survey report, 23.
Rashid, S. and Yadav, S. S. (2020). Impact of covid-19
pandemic on higher education and research. Indian
Journal of Human Development, 14(2):340–343.
S
´
anchez-Almeida, T., Naranjo, D., Gilar-Corbi, R., and
Reina, J. (2021). Effects of socio-academic inter-
vention on student performance in vulnerable groups.
Sustainability, 13(14):7673.
SENESCYT (2021). Acuerdo no.senescyt-2021-
reglamento del sistema nacional de nivelaci
´
on y
admisi
´
on. Secretar
´
ıa de Educaci
´
on Superior, Ciencia,
Tecnolog
´
ıa e Innovaci
´
on, NA(1):18–21.
Theobald, E. J., Hill, M. J., Tran, E., Agrawal, S., Ar-
royo, E. N., Behling, S., Chambwe, N., Cintr
´
on, D. L.,
Cooper, J. D., Dunster, G., et al. (2020). Active
learning narrows achievement gaps for underrepre-
sented students in undergraduate science, technology,
engineering, and math. Proceedings of the National
Academy of Sciences, 117(12):6476–6483.
Torres Mart
´
ın, C., Acal, C., El Homrani, M., and Mingo-
rance Estrada,
´
A. C. (2021). Impact on the virtual
learning environment due to covid-19. Sustainability,
13(2):582.
Prediction of Academic Success in a University and Improvement Using Lean Tools
521
