
An Exploratory Analysis of Malaria and Climatic Factors in India
Sachin Yadav Bodke
1 a
and Usha Ananthakumar
2 b
1
Industrial Engineering and Operations Research, IIT Bombay, India
2
Shailesh J. Mehta School of Management, IIT Bombay, India
Keywords:
India, Malaria Transmission, Seasonality, Rainfall, Temperature.
Abstract:
Malaria remains a significant health challenge in India, prompting a thorough analysis of cases in recent years
from 2020 to 2022. This study focuses on understanding the spread of malaria over time and across different
states, specifically emphasizing the impact of climatic factors such as rainfall and temperature. India’s di-
verse climatic conditions, ranging from hot summers to cold winters, contribute to the complexity of malaria
dynamics. Variations in malaria prevalence were observed with changes in rainfall and temperature, particu-
larly during the months of July to October. Our findings reveal a notable increase in malaria cases during a
period characterized by significant rainfall and temperature. The study identifies a significant prevalence of
malaria cases in India’s West, East, and North East regions with peak transmission occurring in the rainy sea-
son months. Considering the intricate interplay between climatic factors and disease transmission, this study
contributes valuable insights for tailored malaria control strategies during heightened transmission periods.
1 INTRODUCTION
Malaria, a life-threatening vector-borne disease trans-
mitted by infected Anopheles mosquitoes, remains a
significant cause of morbidity and mortality world-
wide, particularly in tropical and subtropical regions.
This study focuses on the spatio-temporal analysis of
malaria in India, a country characterized by diverse
climates and a large population.
In 2021, nearly half of the global population was
at risk of malaria, with an estimated 247 million cases
reported worldwide, slightly higher than the 245 mil-
lion cases in 2020. The majority of cases in 2021 (95
percent) were concentrated in the WHO African re-
gion, while the WHO South-East Asia Region and the
WHO Eastern Mediterranean Region accounted for
2 percent and 3 percent, respectively. The COVID-
19 pandemic led to disruptions in essential malaria
services including reporting of Malaria deaths, thus
witnessing a decline from 625000 in 2020 to 619000
in 2021. The percentage of total malaria deaths in
children under 5 years decreased from 87% in 2000
to 76% in 2015, with no significant change since
then (WHO, 2022). The WHO South-East Asia Re-
gion, with nine malaria-endemic countries in 2021,
accounted for 5.4 million cases and 9,000 deaths, con-
a
https://orcid.org/0009-0000-8947-455X
b
https://orcid.org/0000-0003-1983-2168
tributing 2% to the global burden of malaria cases.
Over the past two decades, the region has witnessed a
76% reduction in malaria cases, from 22.8 million in
2000 to 5.4 million in 2021, and an 82% decline in in-
cidence, from 17.9 to 3.2 per 1000 population at risk.
India, in particular, represented 79% of all malaria
cases in the region in 2021, with about 40% attributed
to the P. vivax strain. Certain Indian states, including
Jharkhand, West Bengal, Uttar Pradesh, Chhattisgarh,
Odisha, Gujarat, and Madhya Pradesh, consistently
reported high malaria cases (WHO, 2022).
Approximately 95% of India’s population resides
in malaria-endemic areas, with the majority of cases
(80%) originating from tribal, hilly, and inaccessible
regions where about 20% of the population lives. No-
tably, from 2020 to 2022, there were 506,764 reported
malaria cases and 262 reported deaths due to malaria
in India (NVBDCP, 2022). The continued prevalence
of malaria in specific geographic and demographic ar-
eas underscores the importance of targeted interven-
tions and sustained efforts to control and eliminate the
disease.
1.1 GIS in Malaria Research
Geographic Information System (GIS) plays a piv-
otal role in malaria research and control, offering
a versatile tool for various applications. GIS has
Bodke, S. and Ananthakumar, U.
An Exploratory Analysis of Malaria and Climatic Factors in India.
DOI: 10.5220/0012817400003756
Paper published under CC license (CC BY-NC-ND 4.0)
In Proceedings of the 13th International Conference on Data Science, Technology and Applications (DATA 2024), pages 159-168
ISBN: 978-989-758-707-8; ISSN: 2184-285X
Proceedings Copyright © 2024 by SCITEPRESS – Science and Technology Publications, Lda.
159

proven effective in the creation of base maps, spot
maps, and different maps. It excels in mapping vec-
tor breeding habitats, delineating malaria risk zones,
and analyzing regions with high disease prevalence.
By utilizing GIS, researchers can generate insightful
maps that aid in understanding past and present dis-
ease trends. By mapping malaria incidence and risk,
decision-makers can identify priority areas for inter-
vention, optimizing resource allocation and response
strategies. This targeted approach enhances the ef-
ficiency of disease control efforts. Moreover, GIS-
based mapping has proven invaluable in monitoring
and evaluating malaria control activities on a broader
scale. This technology facilitates the visual represen-
tation of control measures’ impact over time, enabling
authorities to assess the effectiveness of implemented
strategies. This, in turn, contributes to the refinement
and improvement of ongoing malaria control initia-
tives.
Noteworthy examples of GIS application in
malaria research and control extend globally. Several
countries, including various African nations, Brazil,
Sri Lanka, Thailand, the Republic of Korea, Indone-
sia, and Malaysia, have harnessed GIS to enhance
their understanding of malaria dynamics and optimize
control measures (Saxena et al., 2009). In the context
of India, GIS-based studies have been conducted in
specific districts. Notably, in 2007, GIS was first in-
corporated into the national control program for tribal
malaria in Madhya Pradesh (Srivastava et al., 2009).
This integration marked a significant stride in lever-
aging GIS for targeted interventions and data-driven
decision-making in the fight against malaria.
1.2 Climatic Factors and Malaria
Climatic conditions significantly influence the
mosquito’s life cycle and the malaria parasite’s
development. Numerous studies have established a
correlation between malaria incidence and various
climatic factors, including rainfall, relative humidity,
and temperature. Investigating the relationship be-
tween malaria incidence and these climatic variables
is imperative to provide the health system with early
warning signals. Such insights are crucial for the
timely implementation of effective vector control
activities. Understanding the interplay between
climatic conditions and malaria incidence allows for
the identification of potential risk periods. Early
detection of trends in malaria incidence based on
climatic factors enables the health system to imple-
ment preventive measures and targeted interventions
proactively. This proactive approach is instrumental
in curbing the spread of malaria and minimizing its
impact on public health.
In essence, the association between climatic con-
ditions and malaria incidence serves as a valuable tool
for developing predictive models and early warning
systems. By leveraging this knowledge, health au-
thorities can enhance their preparedness and response
strategies, ensuring a more efficient and timely con-
trol of malaria outbreaks.
1.3 Motivation for this Study
The justification for conducting this study lies in the
need to comprehensively understand the geospatial
distribution and spatiotemporal clustering of reported
malaria cases over a three-year period spanning recent
years. This investigation aims to provide valuable in-
sights that can inform targeted malaria interventions
and resource allocation, particularly in regions with
high malaria endemicity at the state level. Given the
current context of climate change, examining the cor-
relation between malaria incidence and climatic fac-
tors becomes crucial. This study seeks to contribute
to malaria surveillance efforts by predicting disease
outbreaks in advance. The analysis of such associa-
tions can enhance early warning systems, allowing for
proactive measures to be implemented in regions sus-
ceptible to increased malaria transmission. Further-
more, the evaluation of the existing malaria surveil-
lance system in India is an essential component of this
study. By identifying areas of improvement and refin-
ing the surveillance process, this study aims to con-
tribute to the overall effectiveness of malaria control
measures in India
2 LITERATURE SURVEY
2.1 Background of Malaria
Malaria is a vector-borne disease caused by Plas-
modium parasite transmitted through the bites of in-
fected female Anopheles mosquitoes, which are ac-
tive between dusk and dawn. These mosquitoes serve
as vectors, living organisms capable of transmitting
infectious agents between humans or from animals
to humans. Of the five Plasmodium species caus-
ing Malaria in humans, P. falciparum and P. vivax
pose the greatest threat, with P. falciparum being
the most lethal. Globally, in 2021, there were ap-
proximately 247 million reported malaria cases and
619,000 malaria-related deaths. Alarmingly, chil-
dren under the age of five accounted for 67 per-
cent of these global malaria deaths in 2018 (WHO,
2022)(NVBDCP, 2022). The incubation period for
DATA 2024 - 13th International Conference on Data Science, Technology and Applications
160

most malaria cases typically ranges from seven to
thirty days, representing the time between the bite
of an infected Anopheles mosquito and the onset of
initial symptoms. Malaria symptoms can vary from
mild or nonexistent to severe and life-threatening.
Common symptoms include fever, chills, sweating,
headaches, body aches, nausea, vomiting, and gen-
eral malaise. Preventing and reducing malaria trans-
mission primarily rely on two forms of vector control:
insecticide-treated mosquito nets and indoor residual
spraying. Additionally, antimalarial medications play
a crucial role in preventing Malaria. Suspected cases
are confirmed through parasite-based diagnostic test-
ing, which may involve microscopy or a rapid diag-
nostic test. Early diagnosis and treatment are im-
perative to reduce transmission and prevent fatalities
(CDCP, 2020b).
Several risk factors contribute to the prevalence
of Malaria, including climatic and environmental fac-
tors, genetic factors, and population density. Socio-
economic and behavioral risk factors, such as a lack
of knowledge about Malaria and its control, cul-
tural adherence to traditional and ineffective treat-
ments, and entering endemic regions without preven-
tive measures due to poverty or ignorance, also play
a role. Human activities that create mosquito breed-
ing sites, as well as night-time exposure of farmers to
mosquito bites during agricultural work, contribute to
the risk. Additionally, health system-related factors,
such as shortages in human and financial resources,
drugs, and equipment, impact the control and man-
agement of Malaria (CDCP, 2020a). Numerous re-
search studies have unequivocally established a sig-
nificant link between vector-borne diseases and envi-
ronmental factors, offering a key to predicting disease
outbreaks and implementing effective control mea-
sures. Coldblooded arthropod vectors, crucial agents
in these diseases, undergo profound impacts due to
temperature fluctuations, influencing their develop-
ment, behavior, reproduction, and overall population
dynamics. Moreover, the interplay of temperature
with humidity affects pathogen development within
vectors. The significance of rainfall and seasonality
in creating breeding grounds for disease vectors can-
not be understated, further emphasizing the diverse
environmental risk factors, including altitude, slope,
soil type, vegetation, and land use/land cover (Gage
et al., 2008).
2.2 Climatic Factors and Malaria
Transmission
The triad of temperature, relative humidity, and pre-
cipitation emerges as pivotal in the context of malaria
transmission, orchestrating spatiotemporal changes in
malaria vectors. Rainfall, humidity, climate seasonal-
ity, and temperature collectively contribute to 70%-
90% of the malaria risk. The transmission of Plas-
modium falciparum, the causative parasite, is intri-
cately tied to temperature thresholds, with limitations
below 16°C – 19°C and above 33°C – 39°C. Relative
humidity plays a multifaceted role, impacting vector
breeding, parasite development, and the spatial diffu-
sion of malaria transmission. Areas with high vege-
tation in close proximity to human habitation become
hotspots for malaria transmission, particularly when
the distance from mosquito breeding sites is less than
2.5 km (Palaniyandi et al., 2017).
2.3 Forests as Malaria Hotspots
Forests emerge as fertile grounds for malaria trans-
mission due to conducive conditions— vegetation
cover, temperature, rainfall, and humidity—favoring
the distribution and survival of malaria vectors. Tribal
populations dwelling in forested areas rely predom-
inantly on indigenous treatments due to factors like
illiteracy, adherence to age-old traditions, and a deep-
seated fear of the external world. The challenges
are compounded by poor communication infrastruc-
ture, particularly during the rainy season, when
mosquito dispersal dynamics are affected by even
slight changes in distances from bodies of water (Kar
et al., 2014).
2.4 Recent Studies and Geographical
Variations
Over the past decade, numerous studies have delved
into the association between malaria incidence and
climatic factors, presenting a nuanced understand-
ing of the temporal dynamics. Investigations in
China, South Africa, Iran, Thailand, Uganda, Burk-
ina Faso, and India have provided valuable insights
into the complex relationships involving meteorolog-
ical factors. The temporal lagged association between
weekly malaria incidence and meteorological factors
in 30 counties in southwest China from 2004 to 2009
is shown in (Zhao et al., 2014). Also, an inves-
tigation of the effect of monthly rainfall variations
on malaria transmission in five districts of Limpopo
Province of South Africa for the period 1998 to 2017
is presented in (Adeola et al., 2019). Furthermore,
the association of monthly malaria incidence with cli-
matic factors from 2000 to 2012 was studied in Sis-
tan and Baluchestan, Iran (Mohammadkhani et al.,
2019). The association of weekly malaria incidence
with climatic data throughout the country from 2012
An Exploratory Analysis of Malaria and Climatic Factors in India
161

to 2017 in Thailand is presented in (Kotepui et al.,
2018). Temporal relationships between environmen-
tal factors of weekly rainfall, temperature, and en-
hanced vegetation index series and malaria morbidity
over the period January 2010–May 2013 in Uganda
were studied using cross-correlation (Kigozi et al.,
2016). Case studies from Bhutan and Odisha, India,
reveal distinct geographical nuances. Bhutan experi-
ences a rise in P falciparum cases with rainfall, and
the seasonal peak aligns with the monsoon. The P
falciparum cases increased by 0.7% for a one mm
rainfall, while climatic factors (Temperature, Rain-
fall) were not associated with P vivax (Wangdi et al.,
2020). Odisha reported 26.9% of the total malaria
cases (2005-2010) in India, contributing significantly
to India’s malaria burden, relying on numerical sim-
ulations using the VECTRI model, showing the peak
of transmission associated with specific temperature
and rainfall ranges (Singh Parihar et al., 2019).
3 METHODOLOGY
3.1 Research Objectives
1. To analyze the geospatial distribution of reported
malaria cases in India. 2. To explore spatiotemporal
clustering of reported malaria cases in India. 3. To
study the association of spatiotemporal clustering of
reported malaria cases, if any, and potential climatic
factors in India.
3.2 Study Area
India, spanning an expansive area of approximately
3.29 million square kilometers, stands as a vast and
diverse subcontinent. There are 28 states in In-
dia. The geographical features include the towering
Himalayan mountain range in the north, the fertile
Gangetic plains, the arid Thar Desert in the west, and
the extensive coastline along the Arabian Sea and the
Bay of Bengal. The extensive coastline stretches for
7,517 km, and the holiest river, the Ganga or Ganges,
flows for a remarkable 2,510 km. This diverse to-
pography contributes to a wide range of climates and
ecosystems across the country. Geographically, In-
dia can be broadly categorized into four regions: the
plains, mountains, southern peninsula, and the desert.
The eastern and central regions are characterized by
the fertile Indo-Gangetic plains, while the arid Thar
Desert graces the northwest in Rajasthan. Southern
India predominantly features the Deccan plateau, bor-
dered by the Western Ghats and Eastern Ghats moun-
tain ranges along the coastal areas. Additionally, the
Aravallis and Vindhyachal are prominent mountain
ranges in India. India is the first-most populous coun-
try globally, with a population of approximately 1.42
billion people.
India’s environmental landscape is characterized
by a tropical climate, creating distinct wet and dry
seasons. The maximum temperature is 40°C to
47.3°C, and the minimum temperature is -4°C to -
1°C . The average annual rainfall is 1635 mm. Mon-
soon rains, typically from June to September, bring
heavy precipitation and contribute significantly to the
country’s water resources. The tropical conditions,
with warm temperatures and high humidity, provide
an ideal environment for the proliferation of disease
vectors, particularly mosquitoes. Vegetation ranges
from dense forests in the Western Ghats to arid land-
scapes in Rajasthan, contributing to the biodiversity
of the subcontinent. The tropical climate of India,
with its pronounced wet season during the monsoons,
creates favorable conditions for the transmission of
vector-borne diseases. Malaria, in particular, thrives
in areas with abundant rainfall and warm tempera-
tures. Environmental factors, including temperature,
humidity, and vegetation cover, significantly influ-
ence the breeding and survival of disease vectors,
such as mosquitoes.
3.3 Data Collection
Malaria case data for the period of the specified time-
frame was procured from the records of the ”National
Center for Vector-Borne Diseases Control.” These
records serve as a comprehensive source for under-
standing the distribution of malaria cases over the
specified timeframe and over all states of India. Addi-
tional datasets were acquired to enhance the contex-
tual understanding of the malaria data. Demographic
information, providing insights into the population
structure and distribution, was sourced from IndiaS-
tat, a reputable data repository. IndiaStat serves as
a valuable resource for climatic data, contributing to
a holistic analysis of the correlation between malaria
cases and climatic factors.
Furthermore, climate records were obtained from
the India Meteorological Department, Pune, a crucial
element in comprehending the environmental factors
influencing malaria transmission. IndiaStat, serving
as a reference for climate records, emphasizes the re-
liability and accuracy of the data, ensuring a robust
foundation for assessing the climatic conditions dur-
ing the specified period. The collaborative nature of
data availability on IndiaStat, in association with the
India Meteorological Department, Pune, adds credi-
bility to the climate data used in the study. More-
DATA 2024 - 13th International Conference on Data Science, Technology and Applications
162

over, the public facilities (i.e., number of hospitals
and beds) and the number of beds records state-wise
were obtained from the Ministry of Health and Family
Welfare.
This multifaceted approach ensures a comprehen-
sive dataset that encompasses the health-related as-
pects of malaria and demographic and climatic di-
mensions crucial for a nuanced analysis of the inter-
play between climatic factors and malaria transmis-
sion.
3.4 Data Cleaning and Software Use
Data download was done in Microsoft Office 2019
Excel. All data cleaning and data analysis were
done using the Python software version Google Co-
lab. QGIS software desktop version 3.34 was used
to extract the India map shapefile. Data cleaning in-
volves the conversion of raw data into a coherent and
reliable format suitable for analysis. Ensuring a con-
sistent and reproducible approach to data cleaning is
essential. Python software provides an effective plat-
form for performing reproducible data-cleaning tasks.
Following tidy data principles ensures that each vari-
able occupies its designated column, each observation
aligns with a specific row, and every value is appro-
priately situated. Adhering to these rules facilitates
a more efficient and organized workflow within the
Python environment, enhancing the overall data anal-
ysis process.
Secondary data files of annual state-wise and
monthly malaria case data for the years 2020 to 2022
were read in Python software for their data cleaning.
Only relevant columns were kept, and the columns
were given proper variable names to be used dur-
ing analysis. Then, all datasets for 2020 to 2022
were merged into a single dataset. All variables were
checked for missing values and imputation was car-
ried out. Data on the temperature are in degrees Cel-
sius (°C) and rainfall in mm. The malaria situation
in India from 2020 to 2022 was analyzed using the
number of monthly malaria cases and the population.
The geospatial distribution of reported malaria cases
in India from 2020 to 2022 was analyzed by creating
choropleth maps at the state level. Pearson correlation
analysis was done to study the association between
monthly state-wise malaria cases, monthly statewise
rainfall, and temperature values.
4 DATA ANALYSIS AND RESULTS
In our comprehensive study against malaria in India
over the years 2020 to 2022, a multifaceted analytical
Figure 1: Monthly Average Malaria Cases for 2020-2022.
strategy was applied to gain nuanced insights into the
temporal trends, seasonal patterns, and geospatial dis-
tribution of malaria cases. Section 4.1 provides results
on the first objective, that is, to analyze the geospatial
distribution of reported malaria cases in India by the
creation of choropleth maps at state levels. Section
4.2 presents results related to the second objective:
to explore the spatiotemporal clustering of reported
malaria cases in India. The results of the third objec-
tive (to study the association of spatiotemporal clus-
tering of malaria cases with potential climatic factors)
is presented in section 4.3.
4.1 Epidemiological Situation of
Malaria in India During 2020-2022
The epidemiological situation of malaria in India dur-
ing 2020-2022 was analyzed in terms of population,
blood samples examined, total malaria cases, percent-
age of PF malaria cases, and deaths. The average
monthly malaria cases are shown in Figure 1, and data
from NVBDCP is summarized in Table 1.
The number of blood samples examined has in-
creased from 2020 to 2022. The total number of
malaria cases decreased in 2021 but increased again
in 2022. Also, Pf cases and deaths have decreased
over the period of study. The histogram shows India’s
monthly average malaria cases from 2020 to 2022.
Here, we can see malaria at its peak from July to
November. Temporal analysis has provided a nuanced
understanding of malaria cases’ seasonality and tem-
poral trends. The identification of peak periods and
variations over the study period contributes to a more
comprehensive grasp of the disease dynamics.
India is divided into different regions; the North-
East region ( Arunachal Pradesh, Assam, Meghalaya,
Manipur, Nagaland, Mizoram, Tripura), East region
An Exploratory Analysis of Malaria and Climatic Factors in India
163
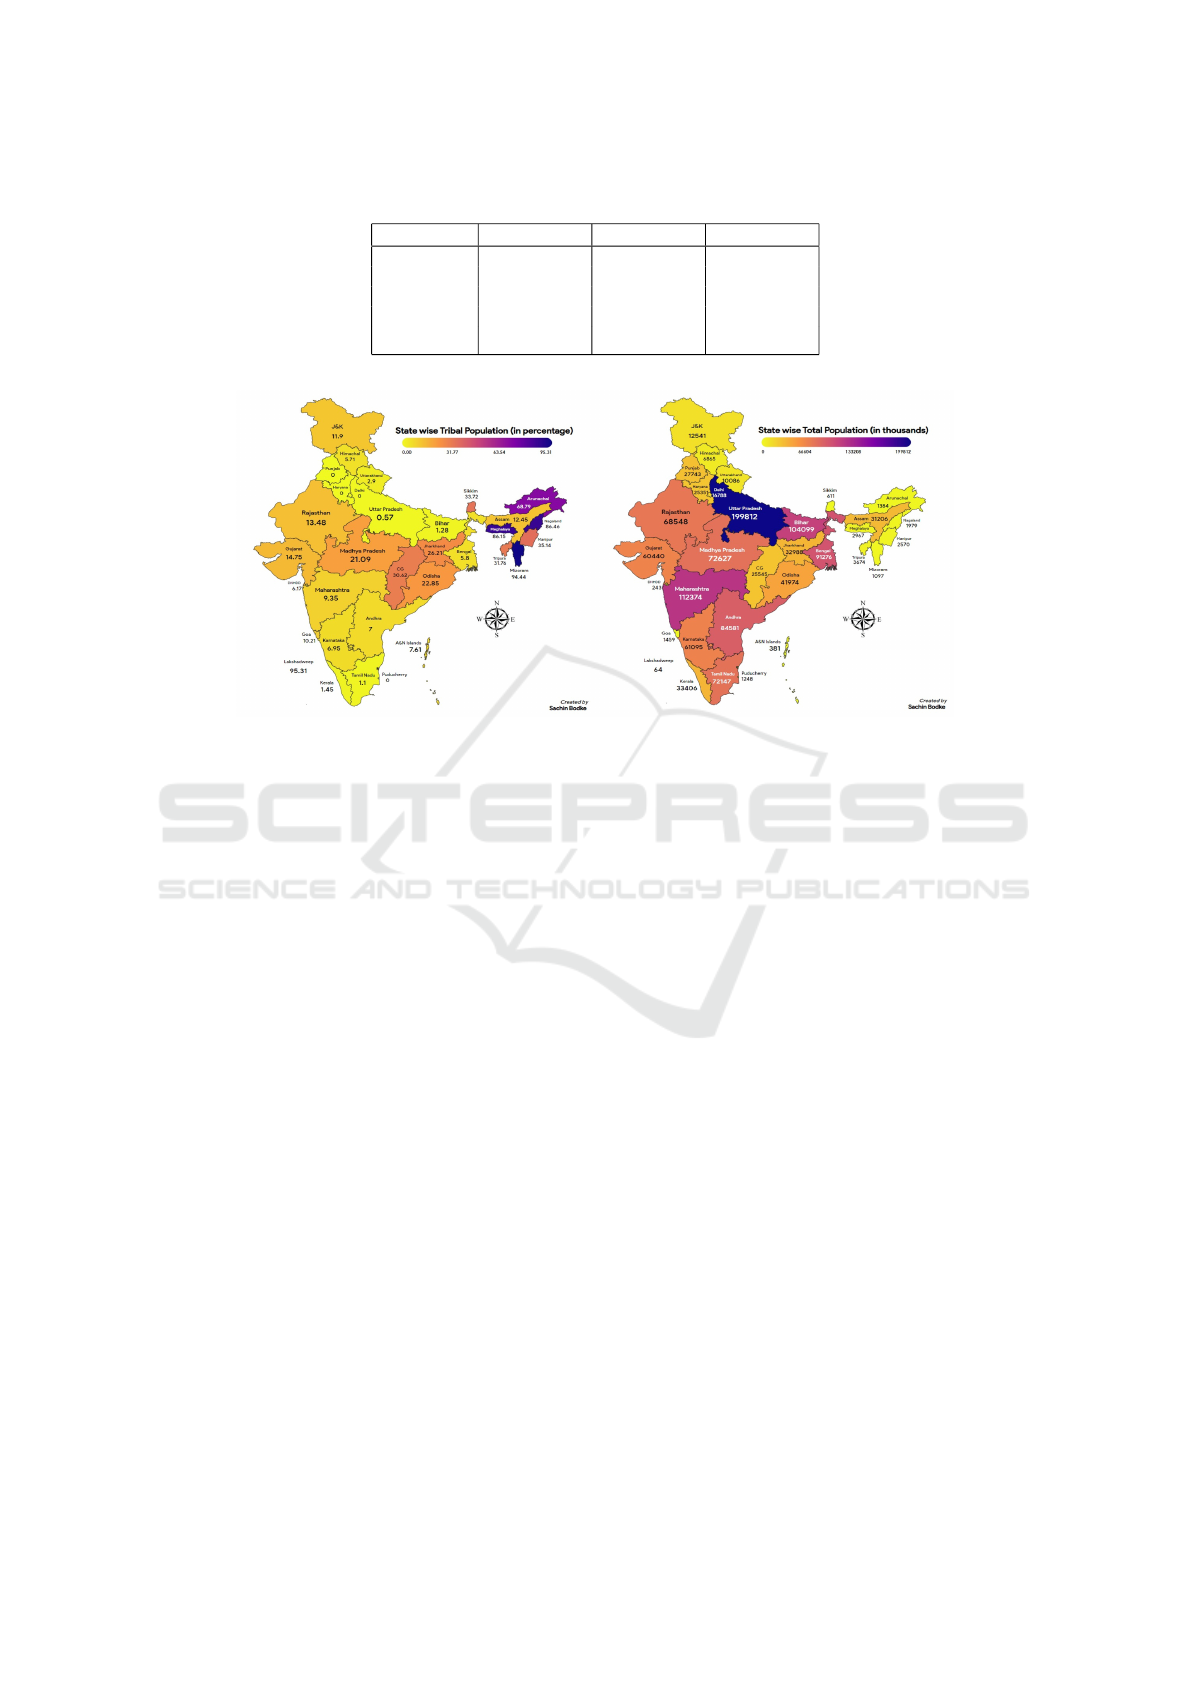
Table 1: Epidemiological situation of malaria in India during 2020-2022.
Year 2020 2021 2022
Population 1396387127 1407563842 1417173173
BSE 97177024 114391977 152083001
Total Cases 186532 161753 176522
Pf Cases 119088 101566 101068
Deaths 93 90 83
BSE: Blood Sampled Examined, Pf: Plasmodium falciparum
Figure 2: State-wise total population density and tribal population in India based on census 2011.
( Odisha, Chhattisgarh, Jharkhand, and West Ben-
gal), East-South region (Telangana, Andhra Pradesh),
South region (Kerla, Tamil-Nadu), South-west re-
gion (Karnataka, Goa), West region (Maharashtra,
Gujrat), Central region (Madhya Pradesh), Middle-
West region (Rajastan), North region (Haryana, Pun-
jab, Delhi, Himachal Pradesh, Uttarakhand, Jammu
Kashmir, Ladakh).
Figure 2 shows how population density and tribal
population were distributed geographically in India in
the year 2011 based on 2011 census data. Mostly,
the states on the eastern and northeastern sides are
characterized by low population density and a high
proportion of the tribal population, and states on the
western and middle western sides are characterized
by higher population density and a lower proportion
of the tribal population.
4.2 Geospatial Distribution of Malaria
Cases at the State Level
In order to analyze the geospatial distribution of re-
ported malaria cases at the state level, choropleth
maps showing the geospatial distribution of the pro-
portion of malaria cases among states were cre-
ated. Figure 3 shows choropleth maps depicting the
geospatial distribution of Malaria cases among states
in India from the year 2020 to 2022. Overall, malaria
cases in the states increased in 2021 and again de-
creased in 2022. Some of the states in the eastern
region of India had higher cases than those in the
non-eastern region. Odisha, Chhattisgarh, Jharkhand,
West Bengal, Maharashtra, and Uttar Pradesh had the
highest malaria cases in this three-year period. Figure
4 shows choropleth maps depicting the geospatial dis-
tribution of Malaria cases/Population ratio among all
states in India from the year 2020 to 2022. Overall,
the ratio in India has increased. Mizoram, Tripura,
Odisha, Chhattisgarh, Uttarakhand, and Jharkhand
have the highest ratio values.
4.3 Association of Spatiotemporal
Clustering of Malaria Cases with
Climatic Factors
To study the association of spatiotemporal clustering
of reported malaria cases with climatic factors, we
have considered monthly malaria cases and climatic
variables, namely monthly rainfall (in mm) and tem-
perature (in °C ) for various states of India. Rainy
season in India is usually from June to October. It
was observed that there was a peak in malaria cases in
July, August, and September, and most of the malaria
cases were reported from July to October each year
from 2020 to 2022. Thus, malaria cases in India fol-
low seasonal patterns. Figure 5 shows choropleth
maps depicting the geospatial distribution of annual
rainfall among all states in India from 2020 to 2022.
DATA 2024 - 13th International Conference on Data Science, Technology and Applications
164
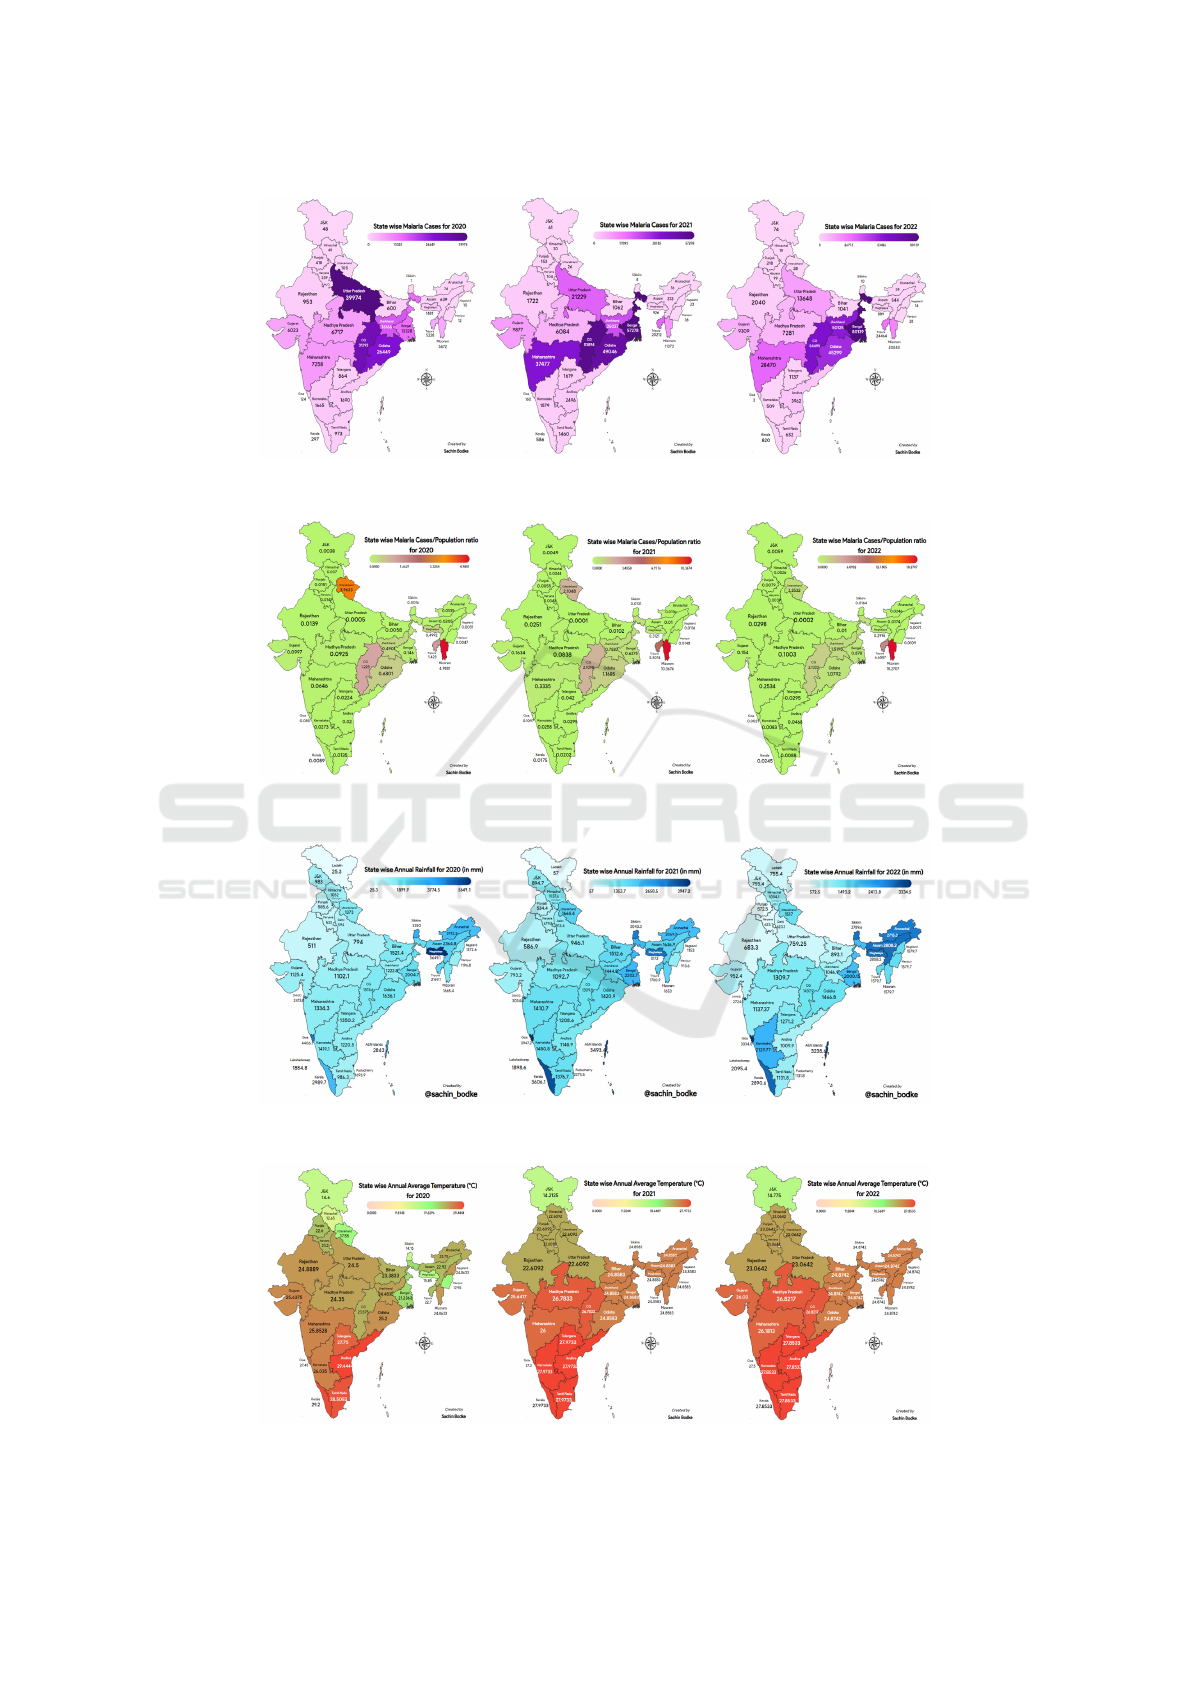
Figure 3: Total malaria cases in India from 2020 to 2022.
Figure 4: Malaria cases/Population ratio in India from 2020 to 2022.
Figure 5: Annual Rainfall in India from 2020 to 2022.
Figure 6: Annual Average Temperature in India from 2020 to 2022.
An Exploratory Analysis of Malaria and Climatic Factors in India
165
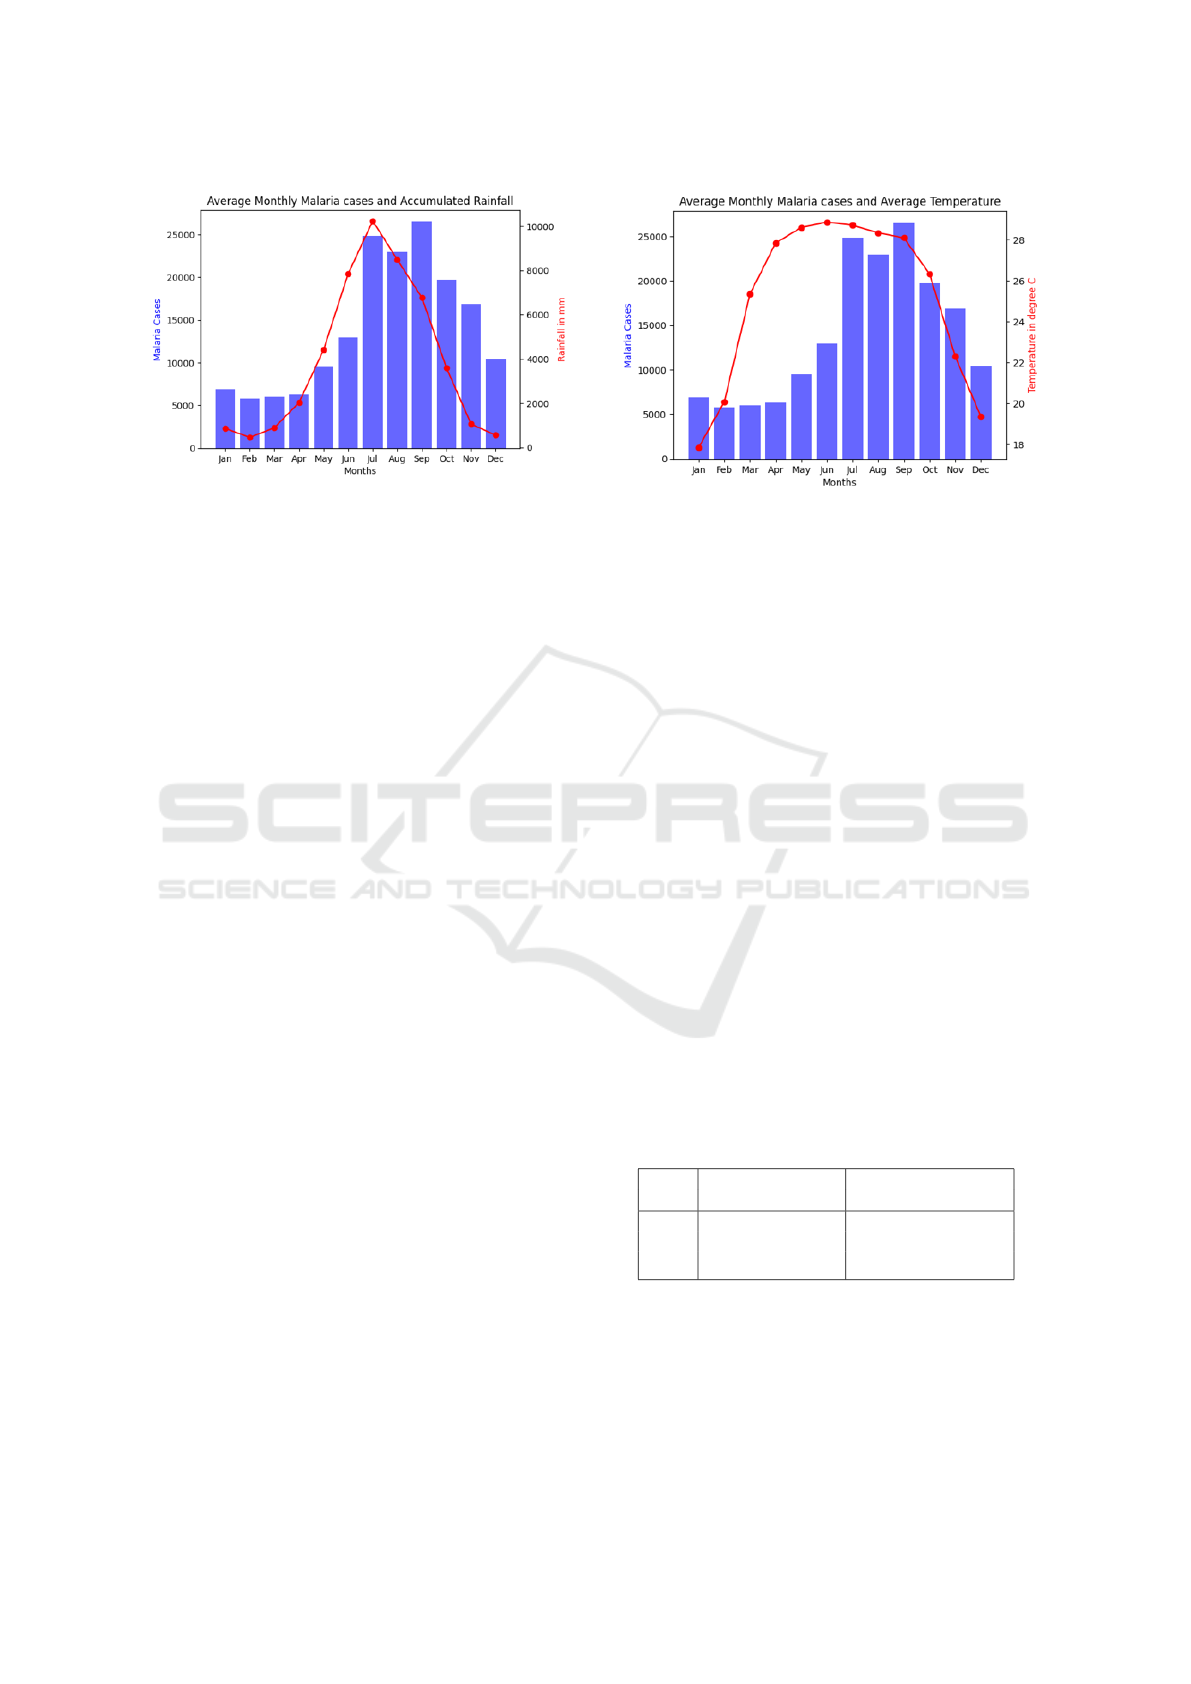
Figure 7: Monthly average malaria cases and rainfall.
The overall rainfall pattern was high in 2021. Also,
the south-region and northeast regions had higher
rainfall records. Figure 6 shows choropleth maps de-
picting the geospatial distribution of annual average
temperature among all states in India from 2020 to
2022. The overall temperature has increased by ap-
proximately 0.3 °C. The South-region states have a
27 °C to 28 °C average temperature, the North-East
region has a 24 °C to 25 °C average temperature,
the west region has 25 °C to 27 °C average temper-
ature, and the north region has 23 °C to 24 °C (except
Jammu and Kashmir, it has 14 °C to 15 °C). Summary
statistics of monthly state-wise malaria cases and me-
teorological variables in India in the three-year period
from 2020 to 2022 are as follows. The temperature
was lowest (-13.6 °C) in the North region (Himachal
Pradesh) in January month of 2020 year and highest
(48.9 °C) in the Middle-west region (Rajasthan: Gan-
ganagar) in May month of the year 2020. Monthly
rainfall was highest (1470.9 mm) in July 2020, while
monthly malaria cases were highest (15330 cases) in
September 2020 in the Uttar Pradesh state of India.
India’s diverse climatic conditions, encompassing
distinct summer, winter, and monsoon seasons, con-
tribute to a complex geographical and environmental
tapestry. Figure 7 presents the average malaria cases
along with the monthly average rainfall. The mon-
soon season, prevailing from June to September dis-
plays variations across the country. Desert regions
witness minimal rainfall, while southern parts, partic-
ularly South India, receive substantial precipitation.
The Himalayan region experiences pleasant spring
and autumn seasons.
From April to June, summers in India are charac-
terized by high temperatures, averaging 40 to 49 de-
grees Celsius. Different regions of India showcase a
wide range of climates. Southern states enjoy a pleas-
ant winter season from November to February, with
temperatures ranging between 17 to 20 degrees Cel-
Figure 8: Monthly average malaria cases and temperature.
sius. Western states also experience agreeable winter
climates, while northern states endure freezing tem-
peratures and heavy snowfall due to their proximity
to the Himalayas. Eastern states similarly encounter
extreme cold conditions. Figure 8 presents the av-
erage malaria cases along with the monthly average
temperature. It can be seen that the range of 26 de-
grees Celsius to 29 degrees Celsius is the tempera-
ture for peak malaria cases. Leveraging geograph-
ical information systems (GIS), geospatial distribu-
tion mapping became a powerful tool to visualize the
spatial patterns of malaria occurrences across differ-
ent regions in India. Identifying hotspots and areas
with higher disease prevalence contributed to a spa-
tially informed understanding of malaria dynamics.
This geospatial perspective provided crucial insights
for targeted interventions, including resource alloca-
tion and region-specific control measures. Addition-
ally, examining the correlation between malaria cases
and meteorological factors allowed for a deeper un-
derstanding of dynamics of malaria. The summary
statistics of these Pearson correlation coefficients are
given in Table 2, highlighting the significance of these
associations.
Table 2: Correlation Coefficient Between Monthly Malaria
Cases and Meteorological Data.
Year Monthly Rainfall Temperature (in °C)
(in mm)
2020 0.73* NA
2021 0.70* 0.53
2022 0.83* 0.48
Note: In Table 2 * means p-value < 0.05, and NA
means temperature data was not available.
Table 2 shows that the correlation coefficient be-
tween monthly malaria cases and rainfall was high
and significant compared to the correlation coeffi-
DATA 2024 - 13th International Conference on Data Science, Technology and Applications
166
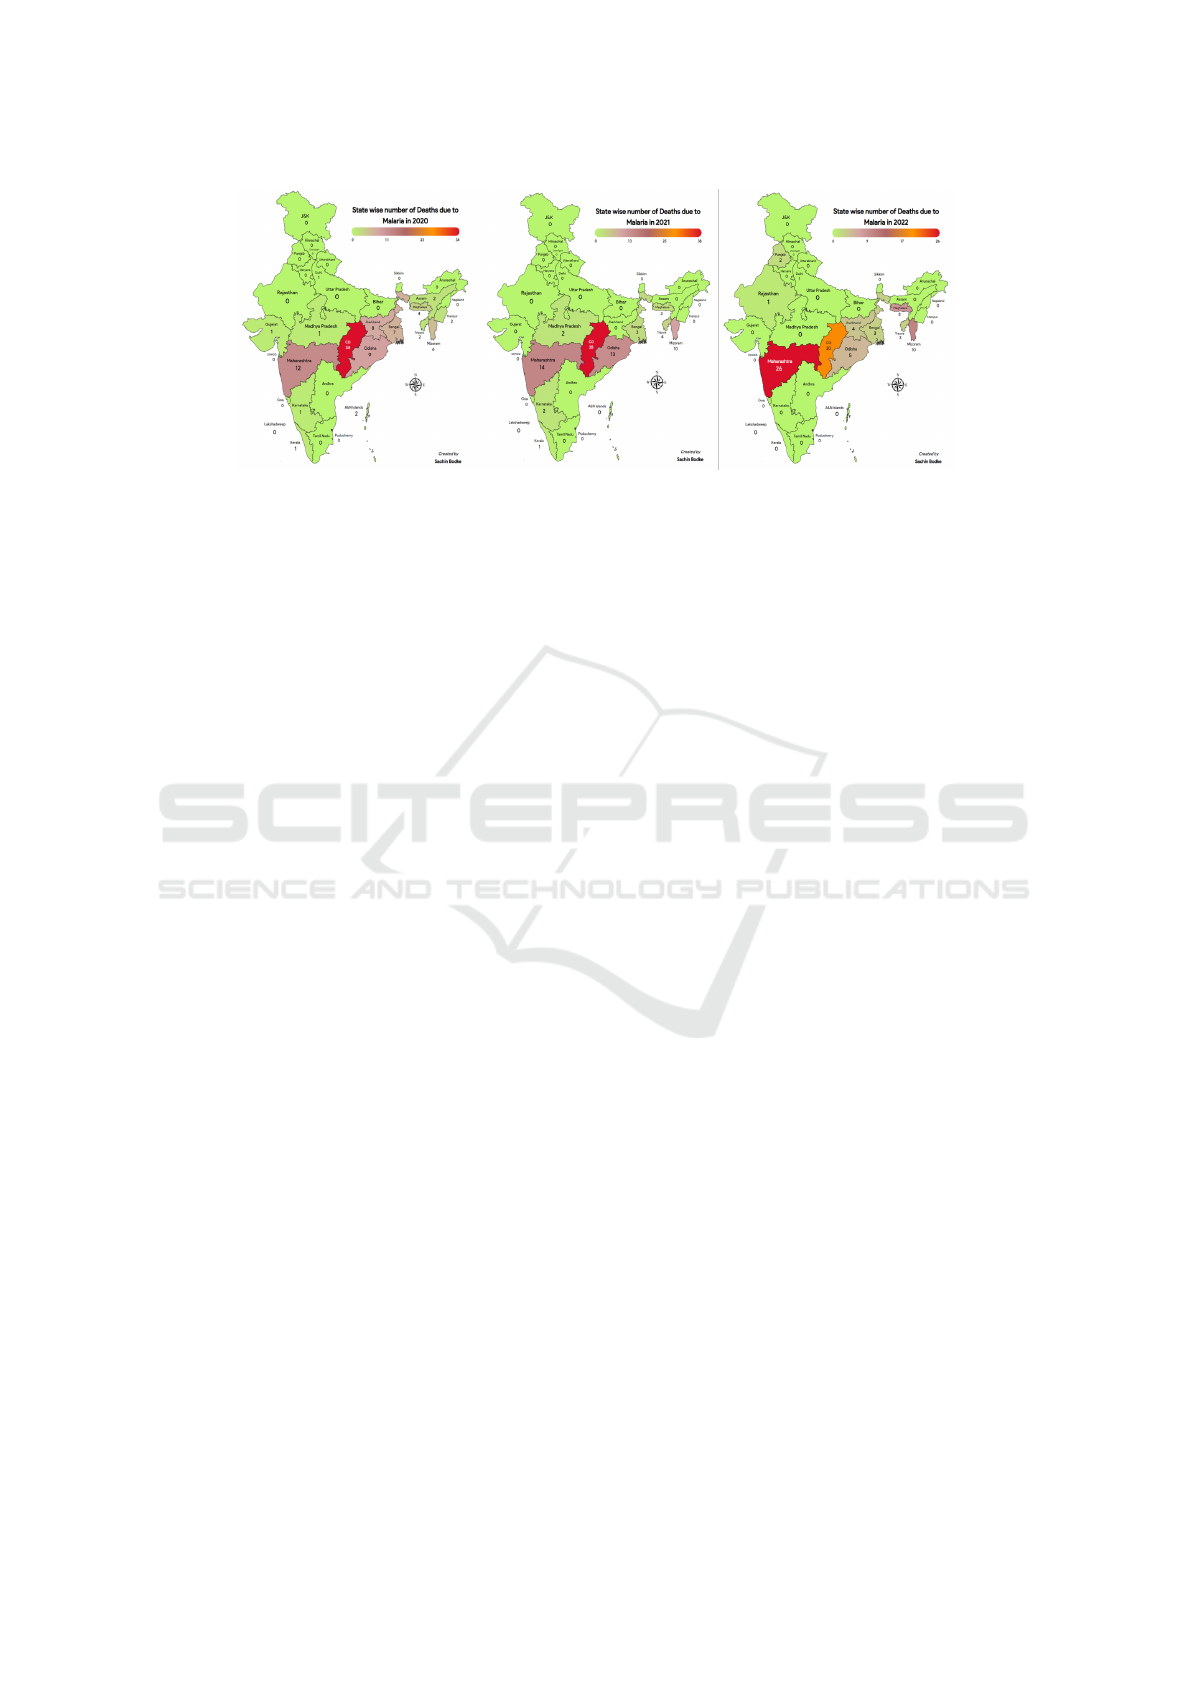
Figure 9: Deaths due to Malaria in India from 2020 to 2022.
cient between monthly malaria cases and temperature.
A positive correlation was found between monthly
malaria cases and rainfall, while no significant cor-
relation was observed with temperature.
All of these aspects underscore the importance
of considering spatial and environmental factors in
malaria control strategies.
4.4 Deaths due to Malaria
Figure 9 shows the number of deaths due to Malaria
in India from 2020 to 2022. Maharashtra, Chattis-
garh, Odisha, Jharkhand, West Bengal, Mizoram, and
Meghalaya had higher mortality. The mortality was
at its peak in Maharashtra and Chattisgarh states.
5 DISCUSSION
The results of our study on the spatiotemporal clus-
tering of reported malaria cases in India unveil valu-
able insights into the geographic and temporal dy-
namics of malaria incidence. Geospatial analysis us-
ing Geographic Information System (GIS) tools has
allowed us to map the distribution of reported cases,
revealing areas with significant clustering. Our find-
ings indicate that certain regions within India exhibit
higher concentrations of malaria cases, emphasizing
the need for targeted interventions in these specific
geographic hotspots. These interventions may include
intensified vector control measures, improved health-
care accessibility, and community engagement initia-
tives. Establishing an early warning system based on
the identified spatiotemporal patterns will enable pub-
lic health authorities to respond promptly to potential
outbreaks, thereby reducing the impact of malaria on
affected communities.
As we move forward, continuous monitoring and
evaluation will be crucial for assessing the effec-
tiveness of implemented interventions and adapting
strategies based on evolving spatiotemporal patterns.
Our study is a vital resource for informing evidence-
based and context-specific malaria control efforts in
India, supporting public health initiatives with action-
able insights from the comprehensive analysis of re-
ported malaria cases.
REFERENCES
Adeola, A., Ncongwane, K., Abiodun, G., Makgoale, T.,
Rautenbach, H., Botai, J., Adisa, O., and Botai, C.
(2019). Rainfall trends and malaria occurrences in
limpopo province, south africa. International Jour-
nal of Environmental Research and Public Health,
16(24):5156.
CDCP (2020a). Cdc-centers for disease control
and prevention (2019b), about malaria biology.
https://www.cdc.gov/malaria/about/biology/index.html.
CDCP (2020b). Cdc-centers for disease control
and prevention (2019b), about malaria disease.
https://www.cdc.gov/malaria/about/disease.html.
Gage, K. L., Burkot, T. R., Eisen, R. J., and Hayes, E. B.
(2008). Climate and vectorborne diseases. American
journal of preventive medicine, 35(5):436–450.
Kar, N. P., Kumar, A., Singh, O. P., Carlton, J. M., and
Nanda, N. (2014). A review of malaria transmission
dynamics in forest ecosystems. Parasites & vectors,
7:1–12.
Kigozi, R., Zinszer, K., Mpimbaza, A., Sserwanga, A.,
Kigozi, S. P., and Kamya, M. (2016). Assessing tem-
poral associations between environmental factors and
malaria morbidity at varying transmission settings in
uganda. Malaria journal, 15:1–6.
Kotepui, M., Kotepui, K. U., et al. (2018). Impact of
weekly climatic variables on weekly malaria inci-
dence throughout thailand: a country-based six-year
retrospective study. Journal of Environmental and
Public Health, 2018.
Mohammadkhani, M., Khanjani, N., Bakhtiari, B.,
Tabatabai, S. M., and Sheikhzadeh, K. (2019). The
relation between climatic factors and malaria inci-
An Exploratory Analysis of Malaria and Climatic Factors in India
167

dence in sistan and baluchestan, iran. Sage Open,
9(3):2158244019864205.
NVBDCP (2022). National vector borne disease con-
trol programme (nvbdcp), 2020-2022. https://ncvbdc.
mohfw.gov.in/.
Palaniyandi, M., Anand, P., and Pavendar, T. (2017). En-
vironmental risk factors in relation to occurrence of
vector borne disease epidemics: Remote sensing and
gis for rapid assessment, picturesque, and monitoring
towards sustainable health. International Journal of
Mosquito Research, 4(3):9–20.
Saxena, R., Nagpal, B., Srivastava, A., Gupta, S., and
Dash, A. (2009). Application of spatial technology
in malaria research & control: some new insights. In-
dian Journal of Medical Research, 130(2):125–132.
Singh Parihar, R., Bal, P. K., Kumar, V., Mishra, S. K.,
Sahany, S., Salunke, P., Dash, S. K., and Dhiman,
R. C. (2019). Numerical modeling of the dynamics
of malaria transmission in a highly endemic region of
india. Scientific Reports, 9(1):11903.
Srivastava, A., Nagpal, B., Joshi, P., Paliwal, J., and Dash,
A. (2009). Identification of malaria hot spots for fo-
cused intervention in tribal state of india: a gis based
approach. International Journal of Health Geograph-
ics, 8:1–8.
Wangdi, K., Xu, Z., Suwannatrai, A. T., Kurscheid, J., Lal,
A., Namgay, R., Glass, K., Gray, D. J., and Clements,
A. C. (2020). A spatio-temporal analysis to identify
the drivers of malaria transmission in bhutan. Scien-
tific Reports, 10(1):7060.
WHO (2022). World malaria report 2022. https:
//www.who.int/teams/global-malaria-programme/
reports/world-malaria-report-2022.
Zhao, X., Chen, F., Feng, Z., Li, X., and Zhou, X.-H.
(2014). The temporal lagged association between
meteorological factors and malaria in 30 counties in
south-west china: a multilevel distributed lag non-
linear analysis. Malaria journal, 13:1–12.
DATA 2024 - 13th International Conference on Data Science, Technology and Applications
168
